
T1 Energy Inc. (TE) FY2026 Q2 Balance Sheet

Balance Sheet

As of 2026-06-30

Swipe to see the full flow
T1 Energy Inc. (TE) FY2026 Q2 Balance SheetBalance sheet as of 2026-06-30. The chart shows assets, liabilities and equity at that date.Current liabilities$577.48 MLiabilities$1.37 BCurrent assets$751.20 MAssets$1.64 BNon-current liabilities$789.52 MEquity$201.78 MNon-current assets$891.07 MGross equity(calculated)$1.37 BRedeemable preferred stock$73.50 MHOLDINGSASSET CLASSASSETSCLAIM CLASSCLAIM SUB-CLASSCLAIMSInventoryAdvances to suppliersAccounts receivable trade, net - related partiesGovernment grants receivable, netCash and cash equivalentsRestricted cashOther current assetsCurrent assets of discontinued operationsProperty and equipment, netRight-of-use asset under operating leasesIntangible assets, netGoodwillOther assetsRestricted cashDeferred revenueAccounts payable and accrued liabilities - related parties - Related partyAccounts payable - Nonrelated partyAccrued liabilities and otherCurrent liabilities of discontinued operationsCurrent portion of long-term debtDerivative liabilitiesConvertible notes - Nonrelated partyOperating lease liabilityLong-term debt - Nonrelated partyLong-term debt - Related partyLong-term deferred revenueOther long-term liabilitiesDeferred tax liabilityAdditional paid-in capitalCommon stock, $0.01 par value, 280,604 and 266,267 shares issued and outstanding as of June 30, 2026 and December 31, 2025, respectivelyRedeemable preferred stock - Series B1 Preferred StockRedeemable preferred stock - Series B Preferred StockCurrent assetsNon-current assetsAssetsCurrent liabilitiesNon-current liabilitiesLiabilitiesEquityGross equity (calculated)Accumulated deficitAccumulated other comprehensive lossRedeemable preferred stockDeferred revenueDeferred revenue$150.40 MAccounts payable and accrued liabilities - related parties - Related partyAccounts payable and accrued liabilities- related parties - Related party$125.74 MCurrent liabilitiesCurrent liabilities$577.48 MAccounts payable - Nonrelated partyAccounts payable - Nonrelated party$102.28 MAccrued liabilities and otherAccrued liabilities and other$86.09 MLiabilitiesLiabilities$1.37 BCurrent liabilities of discontinued operationsCurrent liabilities of discontinued operations$62.03 MInventoryInventory$228.77 MCurrent portion of long-term debtCurrent portion of long-term debt$49.59 MAdvances to suppliersAdvances to suppliers$133.23 MCurrent assetsCurrent assets$751.20 MDerivative liabilitiesDerivative liabilities$1.35 MAccounts receivable trade, net - related partiesAccounts receivable trade, net - related parties$98.65 MGovernment grants receivable, netGovernment grants receivable, net$95.39 MAssetsAssets$1.64 BConvertible notes - Nonrelated partyConvertible notes - Nonrelated party$328.97 MNon-current liabilitiesNon-current liabilities$789.52 MCash and cash equivalentsCash and cash equivalents$79.11 MOperating lease liabilityOperating lease liability$206.16 MRestricted cashRestricted cash$70.21 MLong-term debt - Nonrelated partyLong-term debt - Nonrelated party$116.53 MOther current assetsOther current assets$38.61 MLong-term debt - Related partyLong-term debt - Related party$54.85 MCurrent assets of discontinued operationsCurrent assets of discontinued operations$7.23 MLong-term deferred revenueLong-term deferred revenue$48.19 MEquityEquity$201.78 MOther long-term liabilitiesOther long-term liabilities$31.29 MNon-current assetsNon-current assets$891.07 MProperty and equipment, netProperty and equipment, net$430.42 MDeferred tax liabilityDeferred tax liability$3.52 MGross equity (calculated)Gross equity(calculated)$1.37 BRedeemable preferred stockRedeemable preferred stock$73.50 MRight-of-use asset under operating leasesRight-of-use asset under operating leases$218.32 MIntangible assets, netIntangible assets, net$157.78 MGoodwillGoodwill$57.45 MAdditional paid-in capitalAdditional paid-in capital$1.37 BOther assetsOther assets$19.99 MRestricted cashRestricted cash$7.12 MCommon stock, $0.01 par value, 280,604 and 266,267 shares issued and outstanding as of June 30, 2026 and December 31, 2025, respectivelyCommon stock$2.81 MRedeemable preferred stock - Series B1 Preferred StockRedeemable preferred stock - Series B1 Preferred Stock$55.21 MRedeemable preferred stock - Series B Preferred StockRedeemable preferred stock - Series B Preferred Stock$18.29 MAccumulated deficitAccumulated deficit−$1.16 BAccumulated other comprehensive lossAccumulated other comprehensive loss−$15.22 M
Chart details

T1 Energy Inc. (TE) FY2026 Q2 Balance Sheet

Balance sheet as of 2026-06-30. The chart shows assets, liabilities and equity at that date.

Assets
1,642,269,000 US dollars
Current assets
751,195,000 US dollars
Non-current assets
891,074,000 US dollars
Liabilities
1,366,995,000 US dollars
Current liabilities
577,476,000 US dollars
Non-current liabilities
789,519,000 US dollars
Equity
201,779,000 US dollars
Redeemable preferred stock
73,495,000 US dollars
Inventory
228,773,000 US dollars
Advances to suppliers
133,231,000 US dollars
Accounts receivable trade, net - related parties
98,645,000 US dollars
Government grants receivable, net
95,390,000 US dollars
Cash and cash equivalents
79,109,000 US dollars
Restricted cash
70,207,000 US dollars
Other current assets
38,611,000 US dollars
Current assets of discontinued operations
7,229,000 US dollars
Property and equipment, net
430,416,000 US dollars
Right-of-use asset under operating leases
218,320,000 US dollars
Intangible assets, net
157,781,000 US dollars
Goodwill
57,449,000 US dollars
Other assets
19,988,000 US dollars
Restricted cash
7,120,000 US dollars
Deferred revenue
150,398,000 US dollars
Accounts payable and accrued liabilities - related parties - Related party
125,736,000 US dollars
Accounts payable - Nonrelated party
102,282,000 US dollars
Accrued liabilities and other
86,085,000 US dollars
Current liabilities of discontinued operations
62,030,000 US dollars
Current portion of long-term debt
49,593,000 US dollars
Derivative liabilities
1,352,000 US dollars
Convertible notes - Nonrelated party
328,970,000 US dollars
Operating lease liability
206,161,000 US dollars
Long-term debt - Nonrelated party
116,534,000 US dollars
Long-term debt - Related party
54,850,000 US dollars
Long-term deferred revenue
48,189,000 US dollars
Other long-term liabilities
31,291,000 US dollars
Deferred tax liability
3,524,000 US dollars
Additional paid-in capital
1,371,216,000 US dollars
Common stock, $0.01 par value, 280,604 and 266,267 shares issued and outstanding as of June 30, 2026 and December 31, 2025, respectively
2,806,000 US dollars
Accumulated deficit
negative 1,157,027,000 US dollars
Accumulated other comprehensive loss
negative 15,216,000 US dollars
Redeemable preferred stock - Series B1 Preferred Stock
55,210,000 US dollars
Redeemable preferred stock - Series B Preferred Stock
18,285,000 US dollars
Gross equity (calculated)
1,374,022,000 US dollars. Net equity plus the magnitudes of its negative contributions equals gross positive equity. The negative contributions enter this reconciliation as add-backs; their filed signs stay negative.

Chart connections

  • Assets equal liabilities plus temporary equity plus consolidated equity. Consolidated equity includes noncontrolling interests when reported.
  • Treasury shares and other negative equity contributions reduce equity.
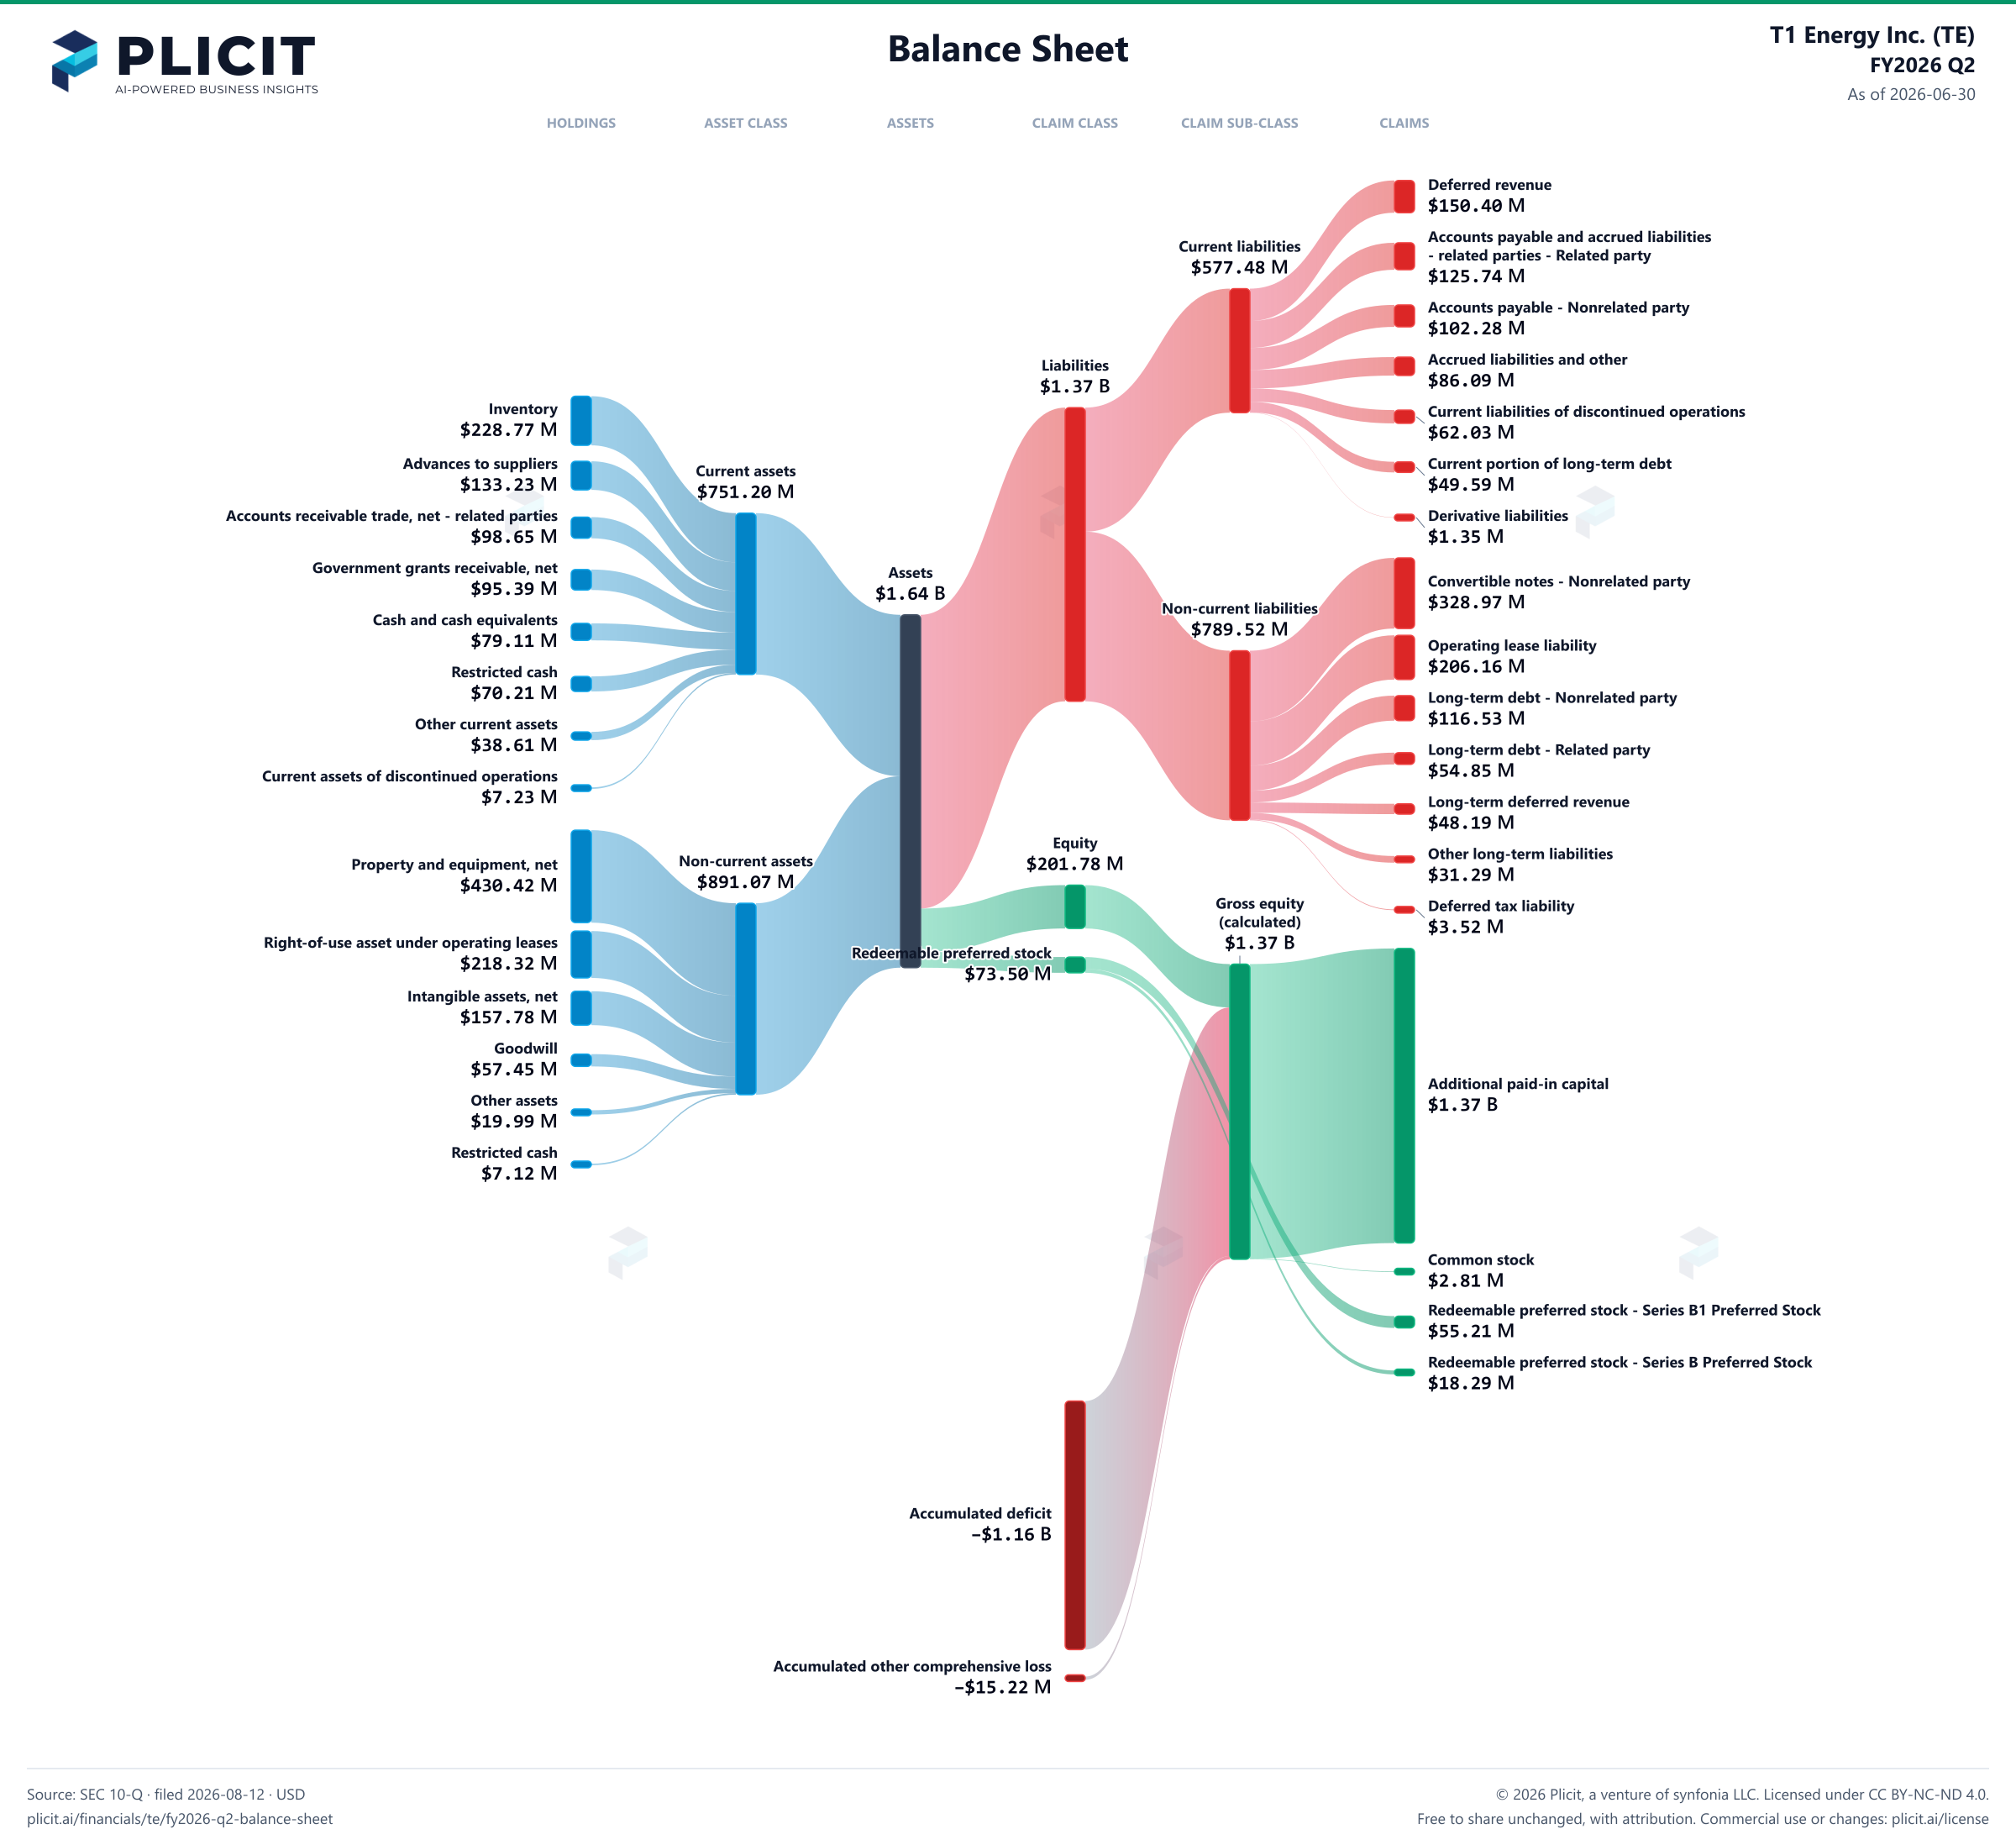
T1 Energy Inc. (TE) FY2026 Q2 Balance Sheet Sankey chart
Free to share unchanged, with credit to Plicit.ai · CC BY-NC-ND 4.0Download PNG

Newsletter

Get the teardowns by email

Subscribe if you want the public-company teardowns in your inbox when they're released.

Product waitlist

Health Check and Teardown for your own company

A health check uncovers insights of your private books, not a public ticker. Join this list to get notified as soon as we go-live!