
TE CONNECTIVITY PLC (TEL) FY2025 Annual P&L / Income Statement

Revenue by Business Segment by Industry End Market

2024-09-28 to 2025-09-26

Swipe to see the full flow
TE CONNECTIVITY PLC (TEL) FY2025 Annual P&L / Income StatementIncome statement for 2024-09-28 through 2025-09-26. View: Segments by Industry End Market. Revenue uses this breakdown; costs and expenses retain the consolidated categories.SOURCESREVENUEGROSSOPERATINGPRE-TAXNETTransportation Solutions - AutomotiveIndustrial Solutions - Digital data networksIndustrial Solutions - Automation and connected livingIndustrial Solutions - Aerospace, defense, and marineTransportation Solutions - Commercial transportationIndustrial Solutions - EnergyTransportation Solutions - SensorsIndustrial Solutions - MedicalNet salesGross marginCost of salesOperating incomeOperating expenses (calculated)Selling, general, and administrative expensesResearch, development, and engineering expensesAcquisition and integration costsRestructuring and other charges, netIncome from continuing operations before income taxesOther income (expense), net (calculated)Net incomeIncome tax (expense) benefitIncome (loss) from discontinued operations, net of income taxesIncome from continuing operations before income taxesIncome from continuingoperations beforeincome taxes$3.20 BNet salesNet sales$17.26 BGross marginGross margin$6.08 BOperating incomeOperating income$3.21 BNet incomeNet income$1.84 BTransportation Solutions - AutomotiveTransportation Solutions - Automotive$7.05 BOperating expenses (calculated)Operating expenses(calculated)$2.87 BIncome tax (expense) benefitIncome tax(expense) benefit$1.36 BSelling, general, and administrative expensesSelling, general, andadministrative expenses$1.87 BCost of salesCost of sales$11.18 BIndustrial Solutions - Digital data networksIndustrial Solutions -Digital data networks$2.21 BOther income (expense), net (calculated)Other income,net (calculated)−$7.00 MResearch, development, and engineering expensesResearch, development,and engineering expenses$829.00 MIndustrial Solutions - Automation and connected livingIndustrial Solutions - Automationand connected living$2.15 BIncome (loss) from discontinued operations, net of income taxesIncome (loss)from discontinuedoperations, net−$1.00 MAcquisition and integration costsAcquisition and integration costs$47.00 MIndustrial Solutions - Aerospace, defense, and marineIndustrial Solutions -Aerospace, defense, and marine$1.48 BRestructuring and other charges, netRestructuring andother charges, net$126.00 MTransportation Solutions - Commercial transportationTransportation Solutions -Commercial transportation$1.43 BIndustrial Solutions - EnergyIndustrial Solutions - Energy$1.34 BTransportation Solutions - SensorsTransportation Solutions - Sensors$911.00 MIndustrial Solutions - MedicalIndustrial Solutions - Medical$692.00 M
Chart details

TE CONNECTIVITY PLC (TEL) FY2025 Annual P&L / Income Statement

Income statement for 2024-09-28 through 2025-09-26. View: Segments by Industry End Market. Revenue uses this breakdown; costs and expenses retain the consolidated categories.

Net sales
17,262,000,000 US dollars
Cost of sales
11,183,000,000 US dollars
Gross margin
6,079,000,000 US dollars
Operating expenses (calculated)
2,868,000,000 US dollars
Operating income
3,211,000,000 US dollars
Other income (expense), net (calculated)
negative 7,000,000 US dollars
Income from continuing operations before income taxes
3,204,000,000 US dollars
Income tax (expense) benefit
1,361,000,000 US dollars
Net income
1,842,000,000 US dollars
Industrial Solutions - Aerospace, defense, and marine
1,483,000,000 US dollars
Industrial Solutions - Automation and connected living
2,147,000,000 US dollars
Industrial Solutions - Digital data networks
2,208,000,000 US dollars
Industrial Solutions - Energy
1,344,000,000 US dollars
Industrial Solutions - Medical
692,000,000 US dollars
Transportation Solutions - Automotive
7,052,000,000 US dollars
Transportation Solutions - Commercial transportation
1,425,000,000 US dollars
Transportation Solutions - Sensors
911,000,000 US dollars
Acquisition and integration costs
47,000,000 US dollars
Research, development, and engineering expenses
829,000,000 US dollars
Restructuring and other charges, net
126,000,000 US dollars
Selling, general, and administrative expenses
1,866,000,000 US dollars
Income (loss) from discontinued operations, net of income taxes
negative 1,000,000 US dollars. Reported below-tax contribution to net income.

Chart connections

  • Revenue less cost of revenue equals gross profit; gross profit less operating expenses equals operating income.
  • Operating income plus other income or expense equals income before tax. Income before tax less income tax expense or benefit, plus the explicitly reported below-tax contributions, equals net income.
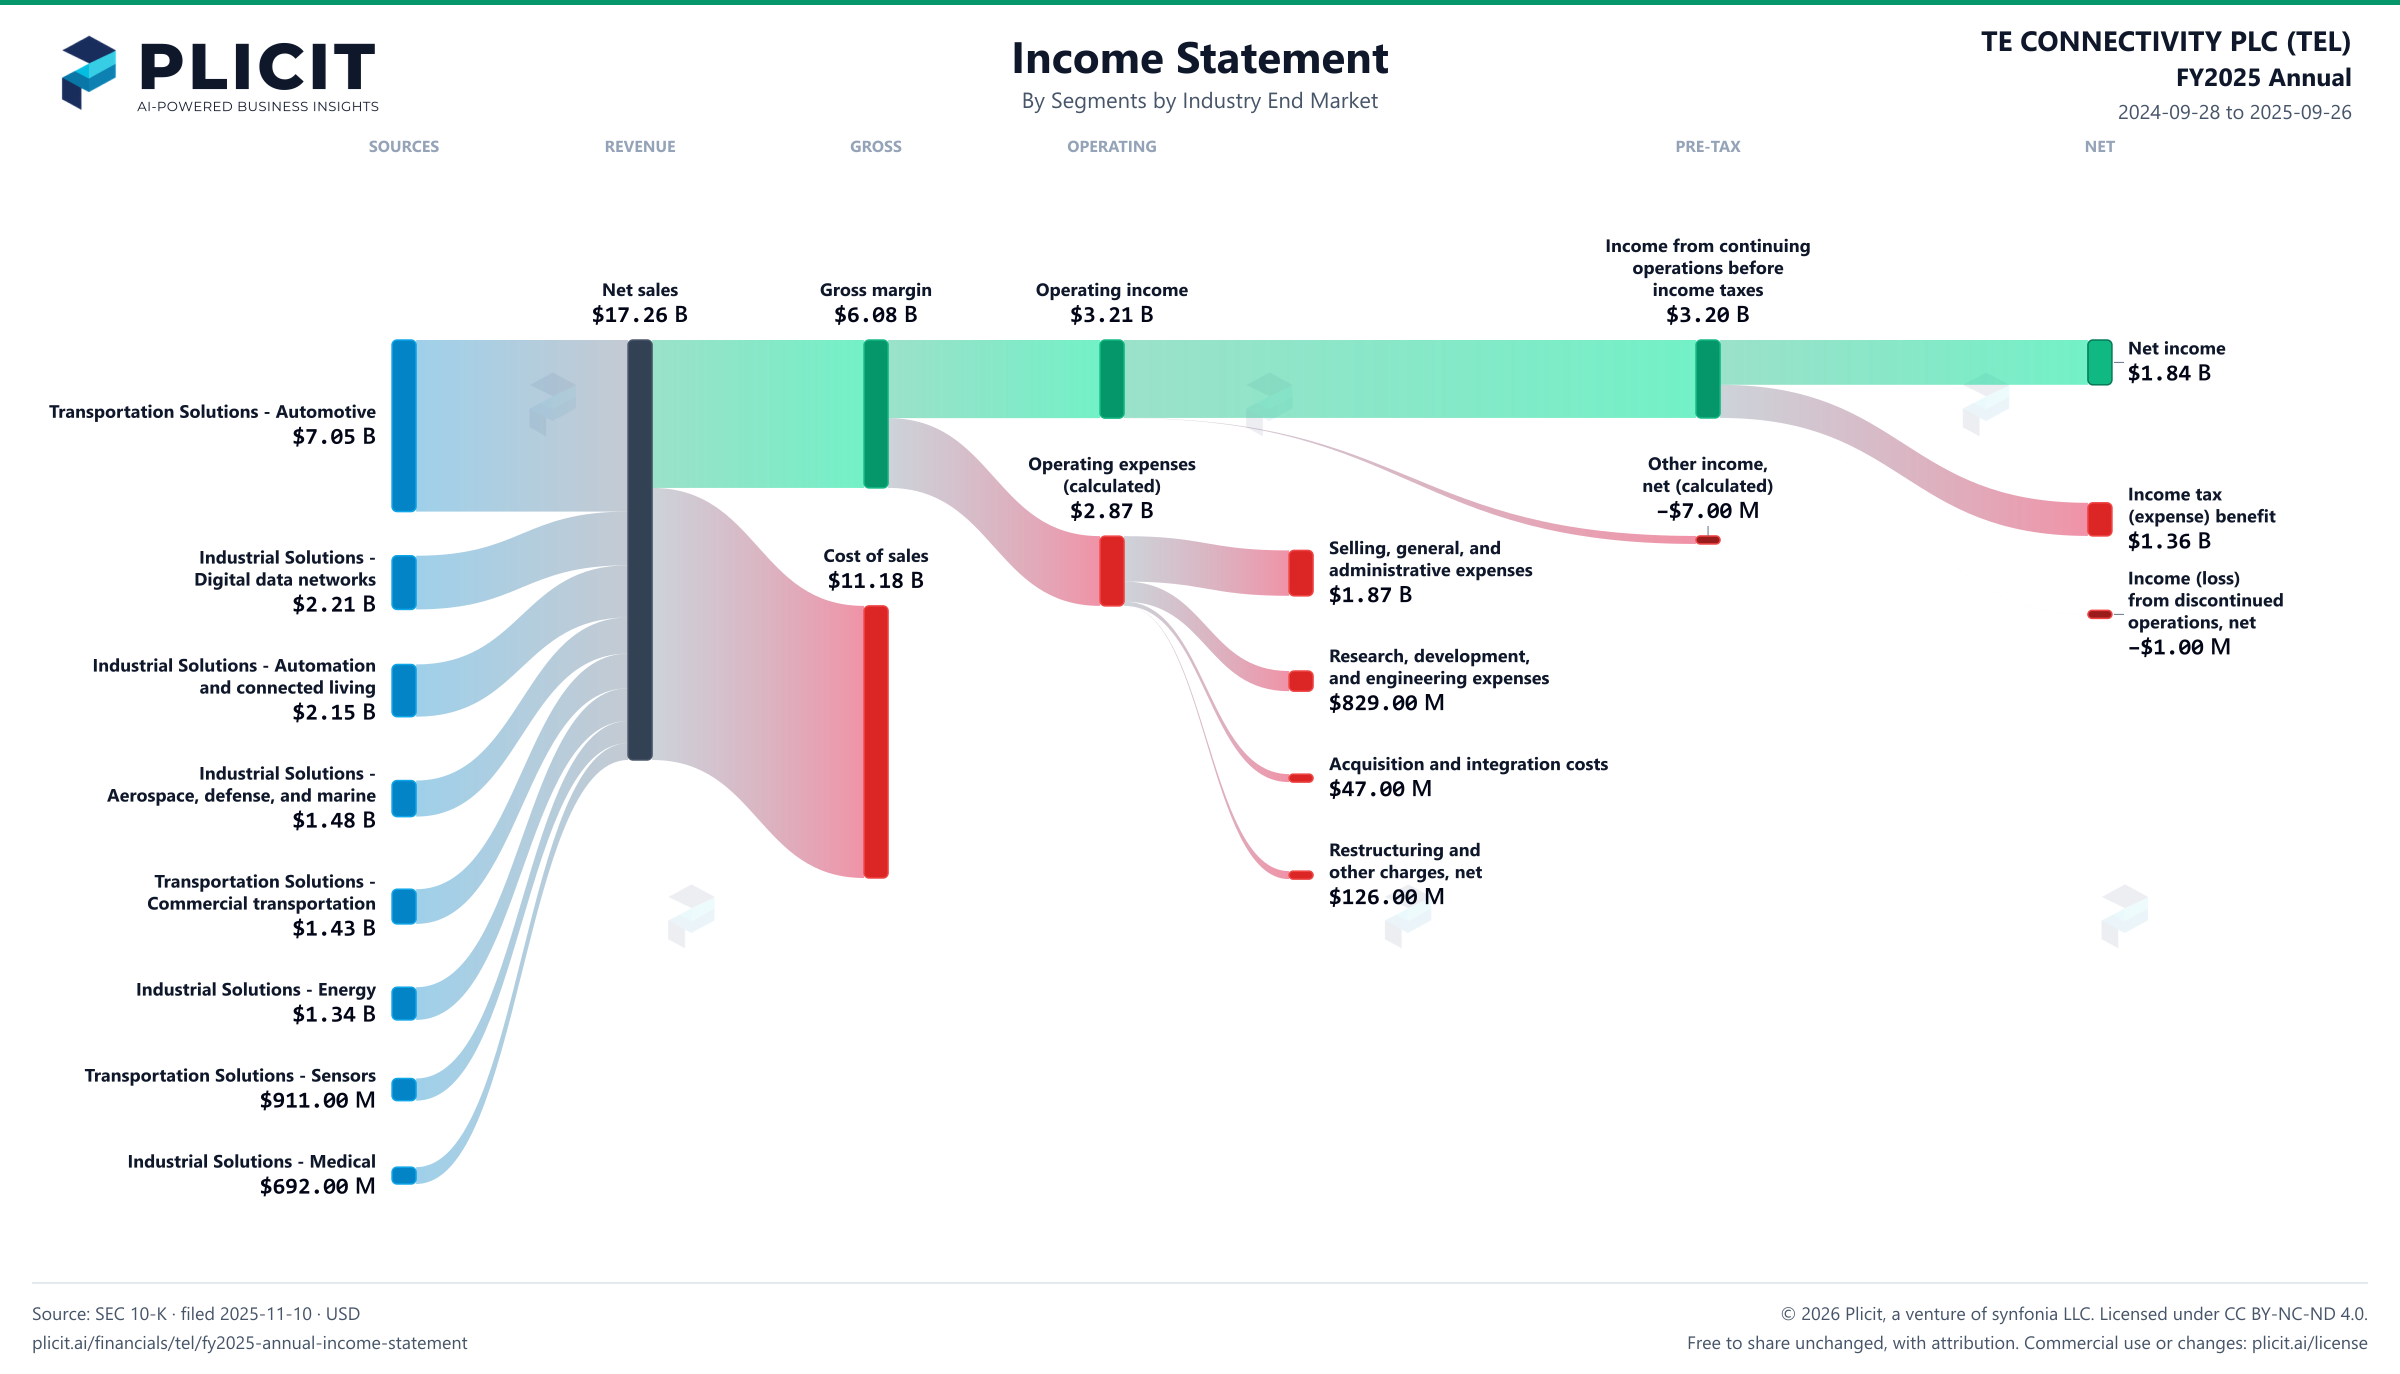
TE CONNECTIVITY PLC (TEL) FY2025 Annual P&L / Income Statement Sankey chart, Segments by Industry End Market view
Free to share unchanged, with credit to Plicit.ai · CC BY-NC-ND 4.0Download PNG

Gross margin

35.2%

Gross profit / revenue

Operating margin

18.6%

Operating profit / revenue

Cash conversion

224.7%

Operating cash / net income, same period

Newsletter

Get the teardowns by email

Subscribe if you want the public-company teardowns in your inbox when they're released.

Product waitlist

Health Check and Teardown for your own company

A health check uncovers insights of your private books, not a public ticker. Join this list to get notified as soon as we go-live!