
Tempus AI, Inc. (TEM) FY2026 Q2 Balance Sheet

Balance Sheet

As of 2026-06-30

Swipe to see the full flow
Tempus AI, Inc. (TEM) FY2026 Q2 Balance SheetBalance sheet as of 2026-06-30. The chart shows assets, liabilities and equity at that date.Current liabilities$391.49 MLiabilities$1.92 BCurrent assets$1.29 BNon-current liabilities$1.53 BAssets$2.37 BNon-current assets$1.08 BEquity$444.93 MGross equity(calculated)$2.97 BHOLDINGSASSET CLASSASSETSCLAIM CLASSCLAIM SUB-CLASSCLAIMSCash and cash equivalentsAccounts receivable(1), net of allowances of $2,794 and $2,755 at June 30, 2026 and December 31, 2025, respectivelyMarketable equity securitiesInventoryPrepaid expenses and other current assetsRelated party assetGoodwillIntangible assets, netProperty and equipment, netInvestment in joint ventureOperating lease right-of-use assetsCapitalized software, netInvestments and other assetsRelated party asset, less current portionInvestment in related partyRestricted cashAccrued expensesDeferred revenueAccounts payableDeferred other incomeOperating lease liabilitiesRelated party payableOther current liabilitiesAccrued data licensing feesConvertible senior notes, netConvertible promissory noteOperating lease liabilities, less current portionOther long-term liabilitiesDeferred revenue, less current portionInterest payableAdditional Paid-In CapitalCommon stock value issued - Common Class ACommon stock value issued - Common Class BCurrent assetsNon-current assetsAssetsCurrent liabilitiesNon-current liabilitiesLiabilitiesEquityGross equity (calculated)Accumulated deficitTreasury Stock, 183,229 shares at March 31, 2026 and December 31, 2025, respectively, at costAccumulated Other Comprehensive (Loss) IncomeAccrued expensesAccrued expenses$181.27 MDeferred revenueDeferred revenue$87.25 MAccounts payableAccounts payable$73.82 MCurrent liabilitiesCurrent liabilities$391.49 MDeferred other incomeDeferred other income$15.96 MOperating lease liabilitiesOperating lease liabilities$12.19 MRelated party payableRelated party payable$10.00 MLiabilitiesLiabilities$1.92 BCurrent assetsCurrent assets$1.29 BCash and cash equivalentsCash and cash equivalents$599.61 MOther current liabilitiesOther current liabilities$8.29 MAccounts receivable(1), net of allowances of $2,794 and $2,755 at June 30, 2026 and December 31, 2025, respectivelyAccounts receivable, net$360.92 MAccrued data licensing feesAccrued data licensing fees$2.71 MMarketable equity securitiesMarketable equity securities$216.38 MNon-current liabilitiesNon-current liabilities$1.53 BInventoryInventory$53.51 MAssetsAssets$2.37 BConvertible senior notes, netConvertible senior notes, net$1.17 BPrepaid expenses and other current assetsPrepaid expenses and other current assets$42.94 MRelated party assetRelated party asset$17.50 MConvertible promissory noteConvertible promissory note$187.93 MGoodwillGoodwill$470.17 MOperating lease liabilities, less current portionOperating lease liabilities, less current portion$71.27 MOther long-term liabilitiesOther long-term liabilities$56.27 MIntangible assets, netIntangible assets, net$312.46 MDeferred revenue, less current portionDeferred revenue, less current portion$22.08 MNon-current assetsNon-current assets$1.08 BProperty and equipment, netProperty and equipment, net$89.07 MEquityEquity$444.93 MInterest payableInterest payable$19.16 MInvestment in joint ventureInvestment in joint venture$77.81 MGross equity (calculated)Gross equity(calculated)$2.97 BOperating lease right-of-use assetsOperating lease right-of-use assets$60.55 MCapitalized software, netCapitalized software, net$19.77 MInvestments and other assetsInvestments and other assets$17.16 MRelated party asset, less current portionRelated party asset, less current portion$14.58 MAdditional Paid-In CapitalAdditional Paid-In Capital$2.97 BInvestment in related partyInvestment in related party$8.75 MRestricted cashRestricted cash$4.72 MCommon stock value issued - Common Class ACommon stock value issued - Common Class A$18.00 KCommon stock value issued - Common Class BCommon stock value issued - Common Class B$1.00 KAccumulated deficitAccumulated deficit−$2.52 BTreasury Stock, 183,229 shares at March 31, 2026 and December 31, 2025, respectively, at costTreasury Stock−$6.64 MAccumulated Other Comprehensive (Loss) IncomeAccumulated Other Comprehensive (Loss) Income−$1.94 M
Chart details

Tempus AI, Inc. (TEM) FY2026 Q2 Balance Sheet

Balance sheet as of 2026-06-30. The chart shows assets, liabilities and equity at that date.

Assets
2,365,911,000 US dollars
Current assets
1,290,865,000 US dollars
Non-current assets
1,075,046,000 US dollars
Liabilities
1,920,977,000 US dollars
Current liabilities
391,492,000 US dollars
Non-current liabilities
1,529,485,000 US dollars
Equity
444,934,000 US dollars
Cash and cash equivalents
599,614,000 US dollars
Accounts receivable(1), net of allowances of $2,794 and $2,755 at June 30, 2026 and December 31, 2025, respectively
360,924,000 US dollars
Marketable equity securities
216,377,000 US dollars
Inventory
53,512,000 US dollars
Prepaid expenses and other current assets
42,938,000 US dollars
Related party asset
17,500,000 US dollars
Goodwill
470,166,000 US dollars
Intangible assets, net
312,457,000 US dollars
Property and equipment, net
89,066,000 US dollars
Investment in joint venture
77,811,000 US dollars
Operating lease right-of-use assets
60,553,000 US dollars
Capitalized software, net
19,772,000 US dollars
Investments and other assets
17,164,000 US dollars
Related party asset, less current portion
14,583,000 US dollars
Investment in related party
8,750,000 US dollars
Restricted cash
4,724,000 US dollars
Accrued expenses
181,271,000 US dollars
Deferred revenue
87,251,000 US dollars
Accounts payable
73,818,000 US dollars
Deferred other income
15,955,000 US dollars
Operating lease liabilities
12,192,000 US dollars
Related party payable
10,000,000 US dollars
Other current liabilities
8,293,000 US dollars
Accrued data licensing fees
2,712,000 US dollars
Convertible senior notes, net
1,172,781,000 US dollars
Convertible promissory note
187,929,000 US dollars
Operating lease liabilities, less current portion
71,266,000 US dollars
Other long-term liabilities
56,270,000 US dollars
Deferred revenue, less current portion
22,084,000 US dollars
Interest payable
19,155,000 US dollars
Revolving credit facility
0 US dollars
Long-term debt, net
0 US dollars
Deferred other income, less current portion
0 US dollars
Convertible redeemable preferred stock, $0.0001 par value, 20,000,000 shares authorized at March 31, 2026 and December 31, 2025, respectively, no shares issued and outstanding at March 31, 2026 and December 31, 2025
0 US dollars
Additional Paid-In Capital
2,969,637,000 US dollars
Common stock value issued - Common Class A
18,000 US dollars
Common stock value issued - Common Class B
1,000 US dollars
Accumulated deficit
negative 2,516,139,000 US dollars
Treasury Stock, 183,229 shares at March 31, 2026 and December 31, 2025, respectively, at cost
negative 6,642,000 US dollars
Accumulated Other Comprehensive (Loss) Income
negative 1,941,000 US dollars
Gross equity (calculated)
2,969,656,000 US dollars. Net equity plus the magnitudes of its negative contributions equals gross positive equity. The negative contributions enter this reconciliation as add-backs; their filed signs stay negative.

Chart connections

  • Assets equal liabilities plus consolidated equity. Consolidated equity includes noncontrolling interests when reported.
  • Treasury shares and other negative equity contributions reduce equity.
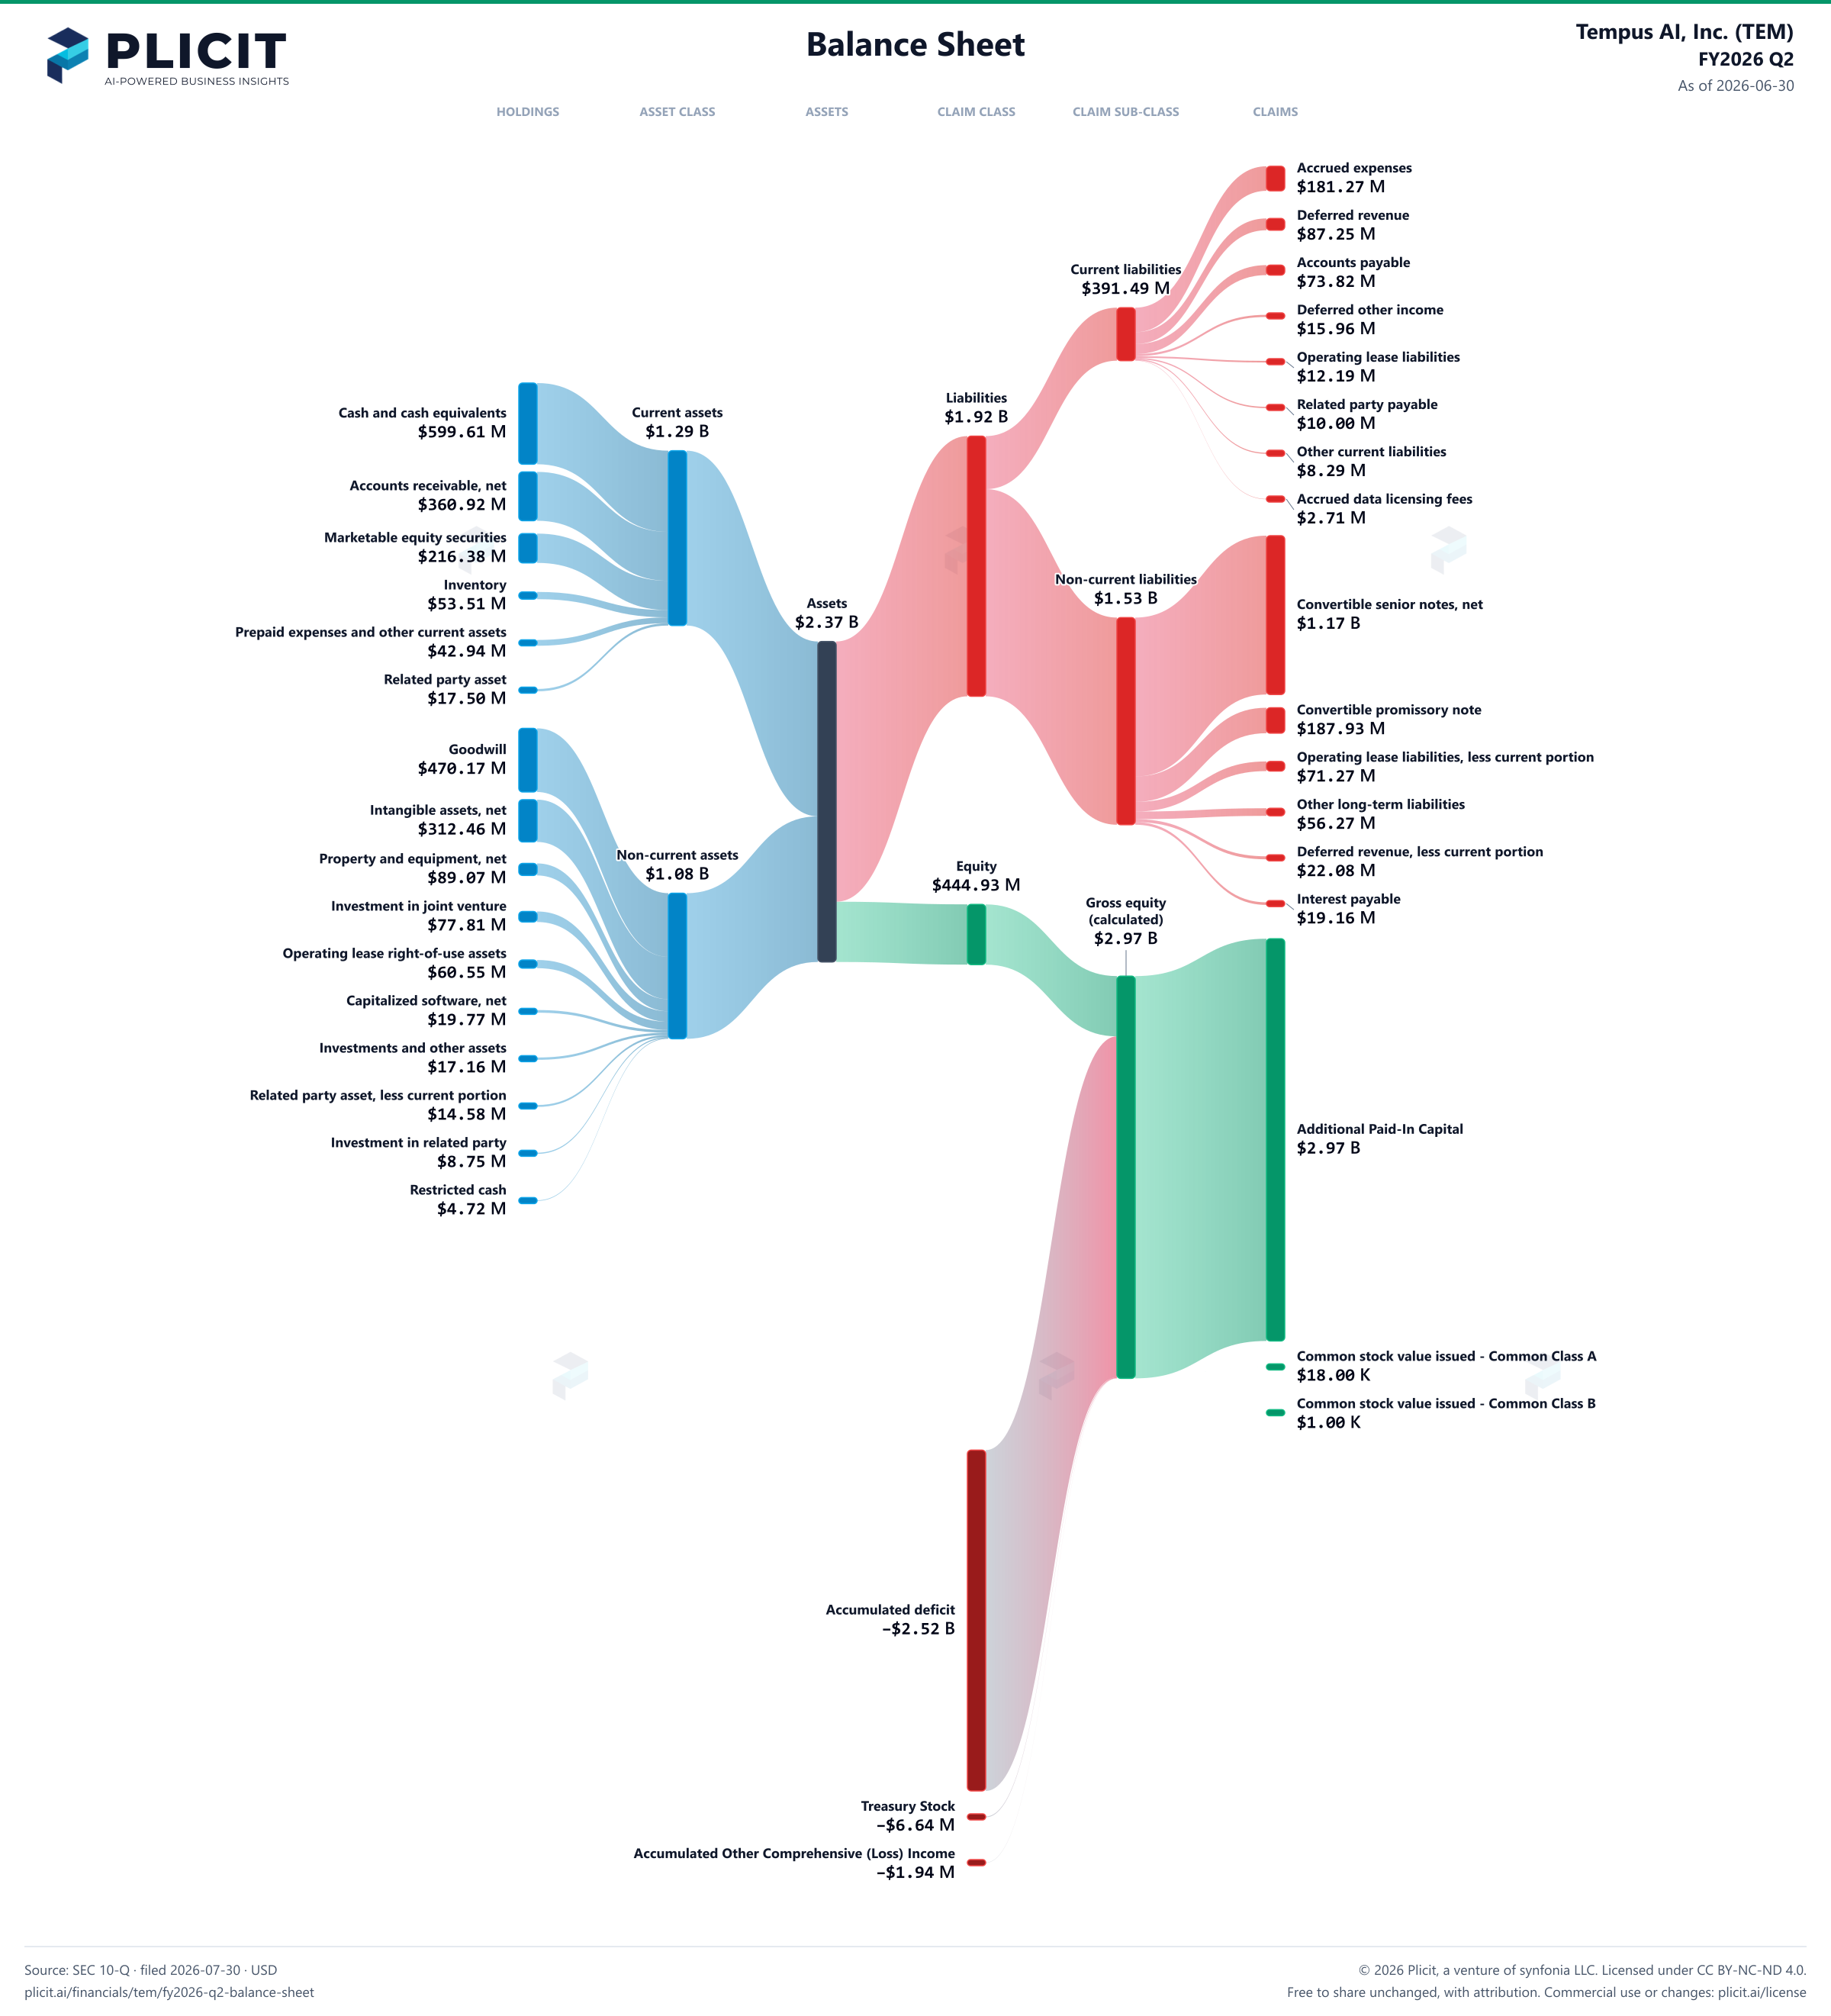
Tempus AI, Inc. (TEM) FY2026 Q2 Balance Sheet Sankey chart
Free to share unchanged, with credit to Plicit.ai · CC BY-NC-ND 4.0Download PNG

Newsletter

Get the teardowns by email

Subscribe if you want the public-company teardowns in your inbox when they're released.

Product waitlist

Health Check and Teardown for your own company

A health check uncovers insights of your private books, not a public ticker. Join this list to get notified as soon as we go-live!