
Tempus AI, Inc. (TEM) FY2026 YTD Q2 P&L / Income Statement

P&L / Income Statement

2026-01-01 to 2026-06-30

Swipe to see the full flow
Tempus AI, Inc. (TEM) FY2026 YTD Q2 P&L / Income StatementIncome statement for 2026-01-01 through 2026-06-30. View: Product and Service by Health Care Organization, Revenue Sources. Revenue uses this breakdown; costs and expenses retain the consolidated categories.SOURCESREVENUEGROSSOPERATINGPRE-TAXNETClinical Order - Third-Party PayorInsights ProductGenomics Product - Self-PayTrials ProductNext ProductUndisclosed (calculated)Total net revenueGross profit (calculated)Cost of revenue (calculated)Cost of revenuesLoss from operationsOperating expenses (calculated)Selling, general and administrativeResearch and developmentTechnology research and developmentOther income (expense), net (calculated)Income (loss) before (provision for) benefit from income taxesNet income (loss)(Provision for) benefit from income taxesLosses from equity method investmentsOther income (expense), net (calculated)Other income,net (calculated)$46.54 MIncome (loss) before (provision for) benefit from income taxesIncome (loss) before(provision for) benefitfrom income taxes−$114.08 MGross profit (calculated)Gross profit(calculated)$468.54 MTotal net revenueTotal net revenue$730.60 MLoss from operationsLoss from operations−$160.62 MNet income (loss)Net income (loss)−$120.28 MClinical Order - Third-Party PayorClinical Order - Third-Party Payor$503.70 MOperating expenses (calculated)Operating expenses(calculated)$629.16 M(Provision for) benefit from income taxes(Provision for) benefitfrom income taxes$247.00 KCost of revenue (calculated)Cost of revenue(calculated)$262.06 MSelling, general and administrativeSelling, general and administrative$438.44 MLosses from equity method investmentsLosses from equitymethod investments−$5.95 MInsights ProductInsights Product$149.00 MGenomics Product - Self-PayGenomics Product - Self-Pay$46.70 MResearch and developmentResearch and development$100.87 MTrials ProductTrials Product$18.90 MCost of revenuesCost of revenues$262.06 MTechnology research and developmentTechnology researchand development$89.85 MNext ProductNext Product$12.00 MUndisclosed (calculated)Undisclosed (calculated)$302.00 K
Chart details

Tempus AI, Inc. (TEM) FY2026 YTD Q2 P&L / Income Statement

Income statement for 2026-01-01 through 2026-06-30. View: Product and Service by Health Care Organization, Revenue Sources. Revenue uses this breakdown; costs and expenses retain the consolidated categories.

Total net revenue
730,602,000 US dollars
Cost of revenue (calculated)
262,063,000 US dollars
Gross profit (calculated)
468,539,000 US dollars
Operating expenses (calculated)
629,163,000 US dollars
Loss from operations
negative 160,624,000 US dollars
Other income (expense), net (calculated)
46,544,000 US dollars
Income (loss) before (provision for) benefit from income taxes
negative 114,080,000 US dollars
(Provision for) benefit from income taxes
247,000 US dollars
Net income (loss)
negative 120,277,000 US dollars
Insights Product
149,000,000 US dollars
Next Product
12,000,000 US dollars
Trials Product
18,900,000 US dollars
Clinical Order - Third-Party Payor
503,700,000 US dollars
Genomics Product - Self-Pay
46,700,000 US dollars
Undisclosed (calculated)
302,000 US dollars
Cost of revenues
262,063,000 US dollars
Selling, general and administrative
438,439,000 US dollars
Research and development
100,874,000 US dollars
Technology research and development
89,850,000 US dollars
Losses from equity method investments
negative 5,950,000 US dollars. Reported below-tax contribution to net income.

Chart connections

  • Revenue less cost of revenue equals gross profit; gross profit less operating expenses equals operating income.
  • Operating income plus other income or expense equals income before tax. Income before tax less income tax expense or benefit, plus the explicitly reported below-tax contributions, equals net income.
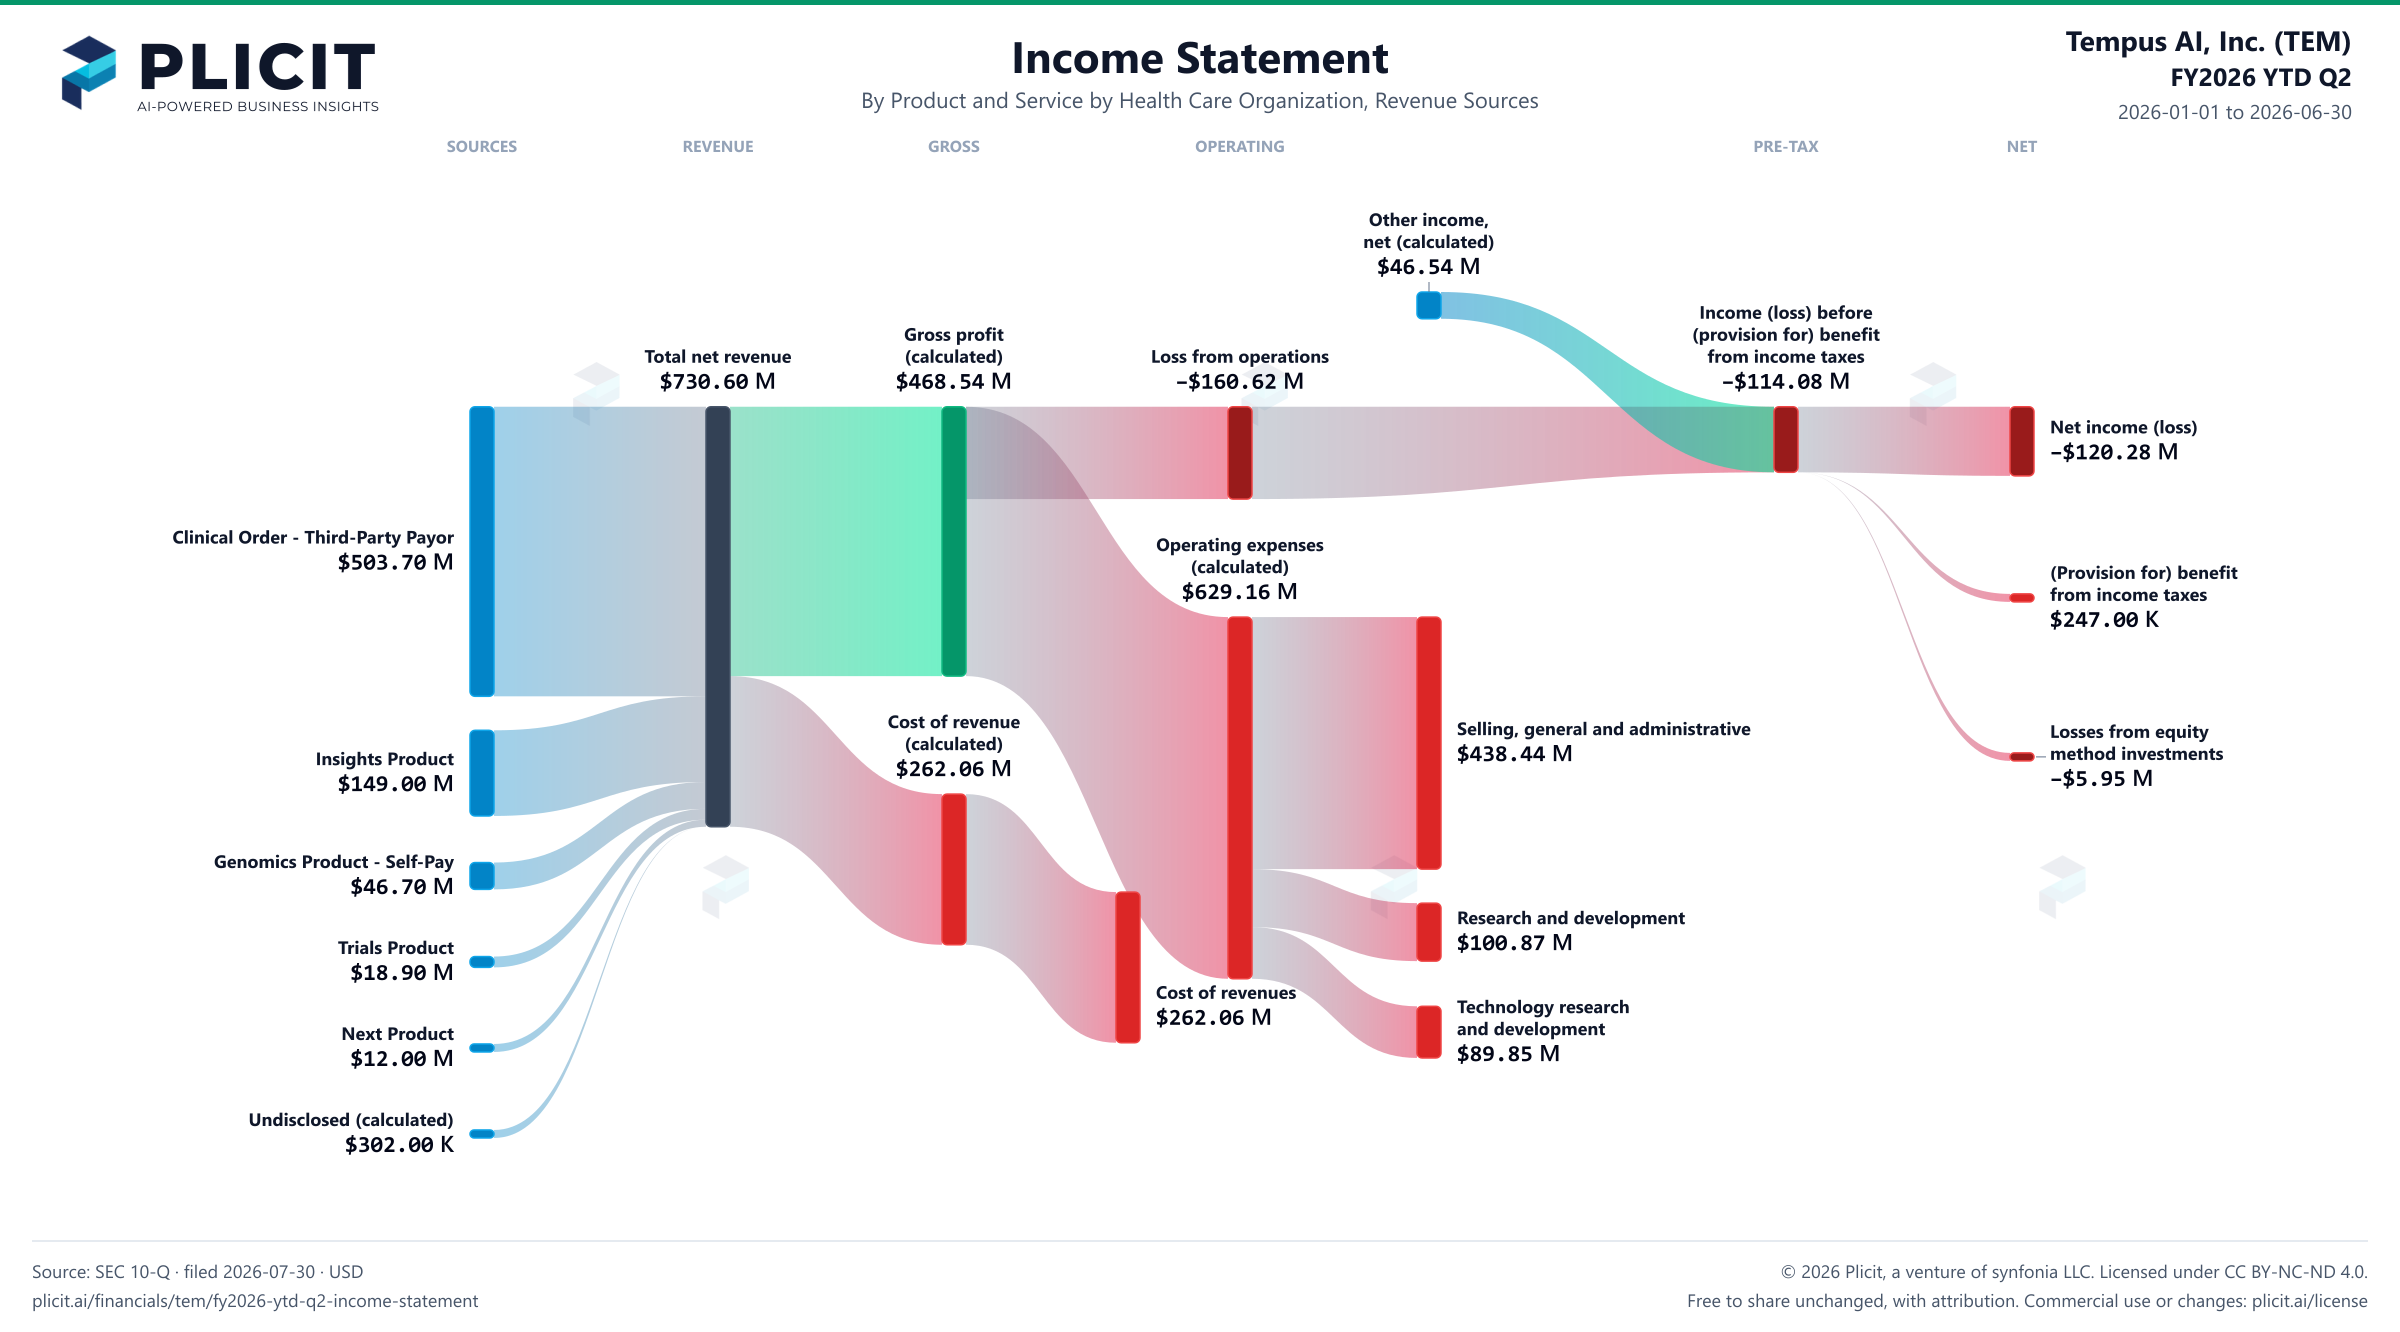
Tempus AI, Inc. (TEM) FY2026 YTD Q2 P&L / Income Statement Sankey chart, Product and service — Product and Service by Health Care Organization, Revenue Sources view
Free to share unchanged, with credit to Plicit.ai · CC BY-NC-ND 4.0Download PNG

Gross margin

64.1%

Gross profit / revenue

Operating margin

−22.0%

Operating profit / revenue

Newsletter

Get the teardowns by email

Subscribe if you want the public-company teardowns in your inbox when they're released.

Product waitlist

Health Check and Teardown for your own company

A health check uncovers insights of your private books, not a public ticker. Join this list to get notified as soon as we go-live!