
THOR INDUSTRIES, INC. (THO) FY2026 Annual Balance Sheet

Balance Sheet

As of 2026-07-31

Swipe to see the full flow
THOR INDUSTRIES, INC. (THO) FY2026 Annual Balance SheetBalance sheet as of 2026-07-31. The chart shows assets, liabilities and equity at that date.Current liabilities$1.55 BCurrent assets$2.74 BLiabilities(calculated)$2.70 BAssets$6.96 BNon-current liabilities$1.15 BEquity$4.26 BNon-current assets$4.22 BGross equity(calculated)$5.13 BHOLDINGSASSET CLASSASSETSCLAIM CLASSCLAIM SUB-CLASSCLAIMSInventories, netAccounts receivable, trade, netCash and cash equivalentsAccounts receivable, other, netPrepaid income taxes, expenses and otherGoodwillProperty, plant and equipment, netAmortizable intangible assets, netOtherEquity investmentsDeferred income tax assets, netAccounts payableProduct warrantiesPromotions and rebatesCompensation and related itemsOtherShort-term financial obligationsIncome and other taxesProduct, property and related liabilitiesCurrent portion of long-term debtLong-term debtOther liabilitiesDeferred income tax liabilities, netUnrecognized tax benefitsRetained earningsAdditional paid-in capitalAccumulated other comprehensive income, net of taxCommon stock—par value of $.10 per share; authorized 250,000,000 shares; issued 67,659,100 and 67,282,807 shares, respectivelyCurrent assetsNon-current assetsAssetsCurrent liabilitiesNon-current liabilitiesLiabilities (calculated)EquityGross equity (calculated)Non-controlling interestsLess treasury shares of 16,044,739 and 14,649,597, respectively, at costAccounts payableAccounts payable$740.55 MProduct warrantiesProduct warranties$273.72 MPromotions and rebatesPromotions and rebates$173.98 MCurrent liabilitiesCurrent liabilities$1.55 BCompensation and related itemsCompensation and related items$156.88 MOtherOther$63.06 MCurrent assetsCurrent assets$2.74 BInventories, netInventories, net$1.42 BLiabilities (calculated)Liabilities(calculated)$2.70 BShort-term financial obligationsShort-term financial obligations$60.84 MAccounts receivable, trade, netAccounts receivable, trade, net$486.75 MIncome and other taxesIncome and other taxes$58.48 MAssetsAssets$6.96 BCash and cash equivalentsCash and cash equivalents$481.99 MProduct, property and related liabilitiesProduct, property and related liabilities$19.78 MAccounts receivable, other, netAccounts receivable, other, net$214.15 MCurrent portion of long-term debtCurrent portion of long-term debt$2.81 MPrepaid income taxes, expenses and otherPrepaid income taxes, expenses and other$133.93 MLong-term debtLong-term debt$865.15 MNon-current liabilitiesNon-current liabilities$1.15 BEquityEquity$4.26 BOther liabilitiesOther liabilities$220.80 MNon-current assetsNon-current assets$4.22 BGoodwillGoodwill$1.92 BDeferred income tax liabilities, netDeferred income tax liabilities, net$49.78 MProperty, plant and equipment, netProperty, plant and equipment, net$1.31 BUnrecognized tax benefitsUnrecognized tax benefits$10.35 MGross equity (calculated)Gross equity(calculated)$5.13 BAmortizable intangible assets, netAmortizable intangible assets, net$684.49 MOtherOther$238.37 MRetained earningsRetained earnings$4.48 BEquity investmentsEquity investments$63.82 MDeferred income tax assets, netDeferred income tax assets, net$3.71 MAdditional paid-in capitalAdditional paid-in capital$635.69 MAccumulated other comprehensive income, net of taxAccumulated other comprehensive income, net of tax$15.22 MCommon stock—par value of $.10 per share; authorized 250,000,000 shares; issued 67,659,100 and 67,282,807 shares, respectivelyCommon stock—par value of $.10 per share$6.77 MNon-controlling interestsNon-controlling interests−$1.48 MLess treasury shares of 16,044,739 and 14,649,597, respectively, at costLess treasury shares of 16,044,739 and 14,649,597−$872.16 M
Chart details

THOR INDUSTRIES, INC. (THO) FY2026 Annual Balance Sheet

Balance sheet as of 2026-07-31. The chart shows assets, liabilities and equity at that date.

Assets
6,956,155,000 US dollars
Current assets
2,739,935,000 US dollars
Non-current assets
4,216,220,000 US dollars
Liabilities (calculated)
2,696,174,000 US dollars
Current liabilities
1,550,104,000 US dollars
Non-current liabilities
1,146,070,000 US dollars
Equity
4,259,981,000 US dollars
Noncontrolling interest
negative 1,477,000 US dollars. Included in consolidated equity; this amount is not added again.
Inventories, net
1,423,117,000 US dollars
Accounts receivable, trade, net
486,751,000 US dollars
Cash and cash equivalents
481,988,000 US dollars
Accounts receivable, other, net
214,145,000 US dollars
Prepaid income taxes, expenses and other
133,934,000 US dollars
Goodwill
1,916,330,000 US dollars
Property, plant and equipment, net
1,309,504,000 US dollars
Amortizable intangible assets, net
684,494,000 US dollars
Other
238,370,000 US dollars
Equity investments
63,815,000 US dollars
Deferred income tax assets, net
3,707,000 US dollars
Accounts payable
740,546,000 US dollars
Product warranties
273,724,000 US dollars
Promotions and rebates
173,977,000 US dollars
Compensation and related items
156,884,000 US dollars
Other
63,064,000 US dollars
Short-term financial obligations
60,839,000 US dollars
Income and other taxes
58,479,000 US dollars
Product, property and related liabilities
19,777,000 US dollars
Current portion of long-term debt
2,814,000 US dollars
Long-term debt
865,145,000 US dollars
Other liabilities
220,804,000 US dollars
Deferred income tax liabilities, net
49,776,000 US dollars
Unrecognized tax benefits
10,345,000 US dollars
Retained earnings
4,475,937,000 US dollars
Additional paid-in capital
635,691,000 US dollars
Accumulated other comprehensive income, net of tax
15,224,000 US dollars
Common stock—par value of $.10 per share; authorized 250,000,000 shares; issued 67,659,100 and 67,282,807 shares, respectively
6,766,000 US dollars
Preferred stock—authorized 1,000,000 shares; none outstanding
0 US dollars
Non-controlling interests
negative 1,477,000 US dollars
Less treasury shares of 16,044,739 and 14,649,597, respectively, at cost
negative 872,160,000 US dollars
Gross equity (calculated)
5,133,618,000 US dollars. Net equity plus the magnitudes of its negative contributions equals gross positive equity. The negative contributions enter this reconciliation as add-backs; their filed signs stay negative.

Chart connections

  • Assets equal liabilities plus consolidated equity. Consolidated equity includes noncontrolling interests when reported.
  • Treasury shares and other negative equity contributions reduce equity.
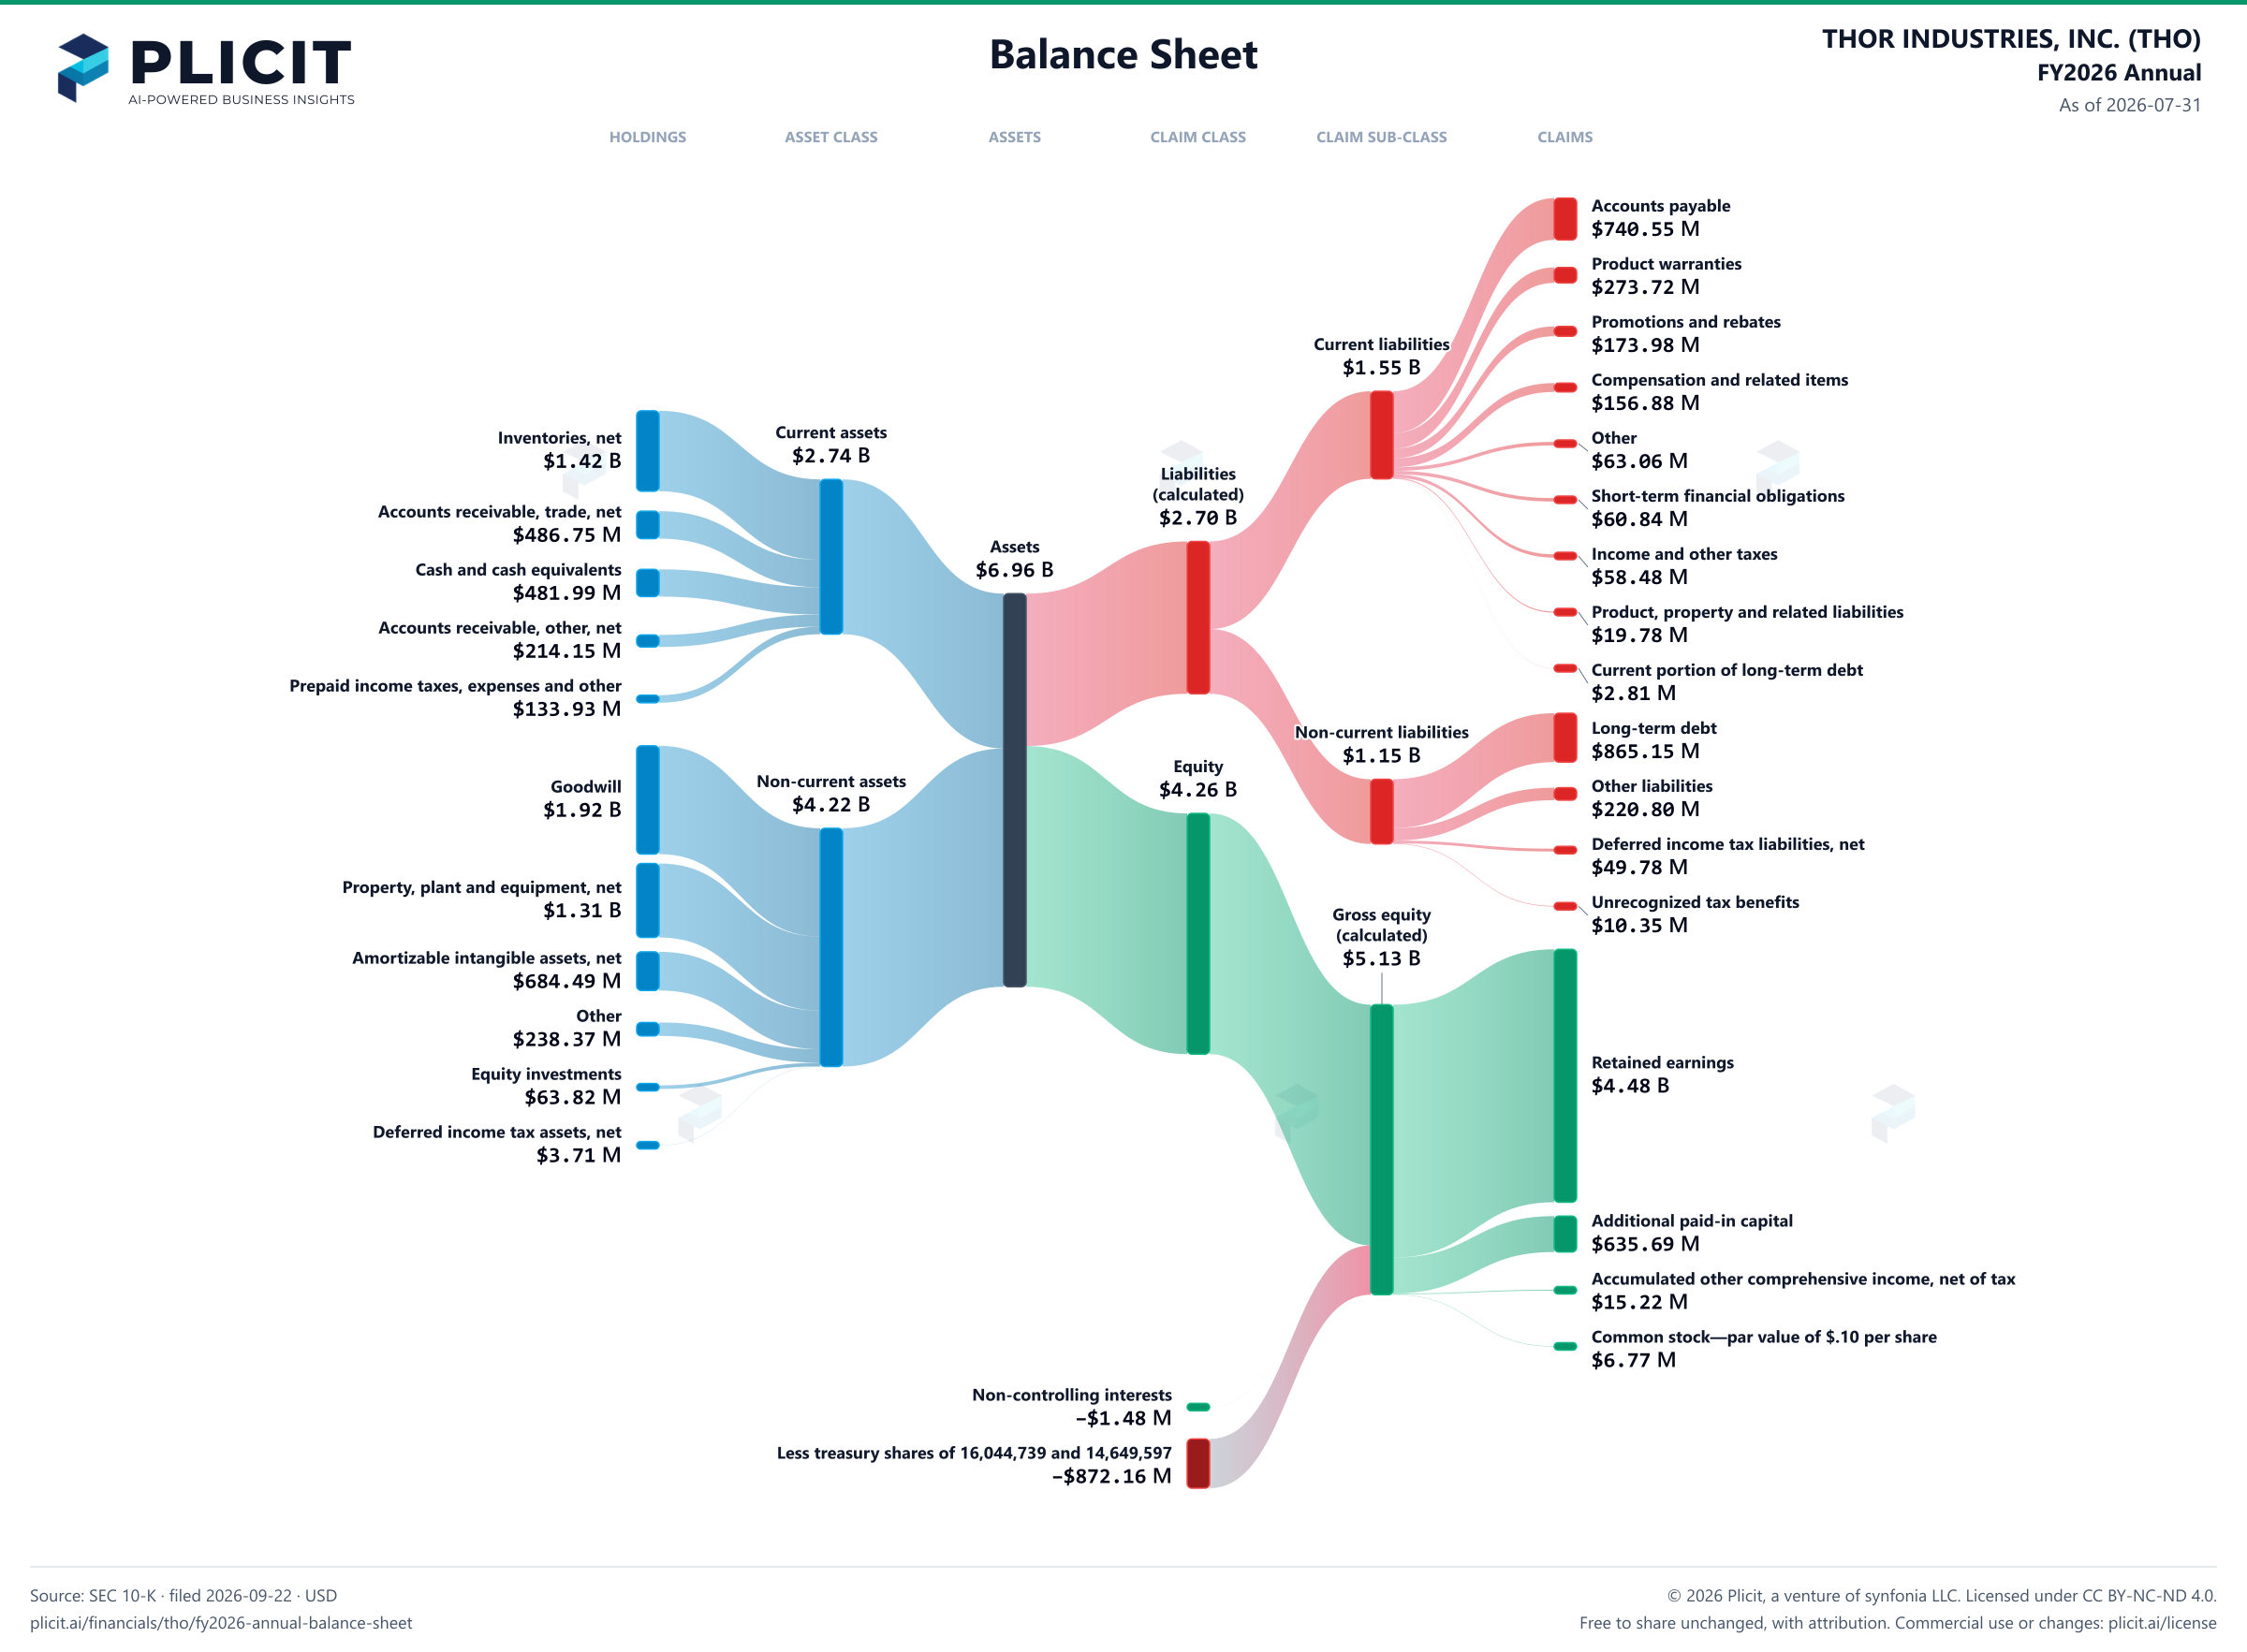
THOR INDUSTRIES, INC. (THO) FY2026 Annual Balance Sheet Sankey chart
Free to share unchanged, with credit to Plicit.ai · CC BY-NC-ND 4.0Download PNG

Newsletter

Get the teardowns by email

Subscribe if you want the public-company teardowns in your inbox when they're released.

Product waitlist

Health Check and Teardown for your own company

A health check uncovers insights of your private books, not a public ticker. Join this list to get notified as soon as we go-live!