
GENTHERM INCORPORATED (THRM) FY2026 Q2 P&L / Income Statement

Revenue by Business Segment by Product and Service

2026-04-01 to 2026-06-30

Swipe to see the full flow
GENTHERM INCORPORATED (THRM) FY2026 Q2 P&L / Income StatementIncome statement for 2026-04-01 through 2026-06-30. View: Segments by Product and Service. Revenue uses this breakdown; costs and expenses retain the consolidated categories.SOURCESREVENUEGROSSOPERATINGPRE-TAXNETAutomotive Segments - Climate Control SeatsAutomotive Segments - Lumbar and Massage Comfort SolutionsAutomotive Segments - Climate Control InteriorsAutomotive Segments - Other AutomotiveAutomotive Segments - Valve SystemsIndustrial Segments - Medical SegmentsAutomotive Segments - Climate and Comfort ElectronicsProduct revenuesGross marginCost of salesOperating incomeTotal operating expensesSelling, general and administrative expensesNet research and development expensesRestructuring expenses, netEarnings before income taxOther income (expense), net (calculated)Net incomeIncome tax expenseEarnings before income taxEarnings beforeincome tax$7.32 MProduct revenuesProduct revenues$416.17 MGross marginGross margin$96.43 MOperating incomeOperating income$10.69 MNet incomeNet income$4.42 MTotal operating expensesTotal operatingexpenses$85.74 MAutomotive Segments - Climate Control SeatsAutomotive Segments -Climate Control Seats$217.47 MIncome tax expenseIncome tax expense$2.90 MSelling, general and administrative expensesSelling, general andadministrative expenses$55.71 MOther income (expense), net (calculated)Other income,net (calculated)−$3.37 MCost of salesCost of sales$319.74 MNet research and development expensesNet research anddevelopment expenses$24.07 MAutomotive Segments - Lumbar and Massage Comfort SolutionsAutomotive Segments - Lumbarand Massage Comfort Solutions$72.59 MRestructuring expenses, netRestructuring expenses, net$5.96 MAutomotive Segments - Climate Control InteriorsAutomotive Segments -Climate Control Interiors$52.54 MAutomotive Segments - Other AutomotiveAutomotive Segments- Other Automotive$28.38 MAutomotive Segments - Valve SystemsAutomotive Segments - Valve Systems$25.10 MIndustrial Segments - Medical SegmentsIndustrial Segments- Medical Segments$11.35 MAutomotive Segments - Climate and Comfort ElectronicsAutomotive Segments - Climateand Comfort Electronics$8.75 M
Chart details

GENTHERM INCORPORATED (THRM) FY2026 Q2 P&L / Income Statement

Income statement for 2026-04-01 through 2026-06-30. View: Segments by Product and Service. Revenue uses this breakdown; costs and expenses retain the consolidated categories.

Product revenues
416,166,000 US dollars
Cost of sales
319,739,000 US dollars
Gross margin
96,427,000 US dollars
Total operating expenses
85,738,000 US dollars
Operating income
10,689,000 US dollars
Other income (expense), net (calculated)
negative 3,365,000 US dollars
Earnings before income tax
7,324,000 US dollars
Income tax expense
2,904,000 US dollars
Net income
4,420,000 US dollars
Automotive Segments - Climate and Comfort Electronics
8,746,000 US dollars
Automotive Segments - Climate Control Interiors
52,538,000 US dollars
Automotive Segments - Climate Control Seats
217,465,000 US dollars
Automotive Segments - Lumbar and Massage Comfort Solutions
72,588,000 US dollars
Automotive Segments - Other Automotive
28,376,000 US dollars
Automotive Segments - Valve Systems
25,102,000 US dollars
Industrial Segments - Medical Segments
11,351,000 US dollars
Net research and development expenses
24,069,000 US dollars
Selling, general and administrative expenses
55,705,000 US dollars
Restructuring expenses, net
5,964,000 US dollars

Chart connections

  • Revenue less cost of revenue equals gross profit; gross profit less operating expenses equals operating income.
  • Operating income plus other income or expense equals income before tax. Income before tax less income tax expense or benefit equals net income.
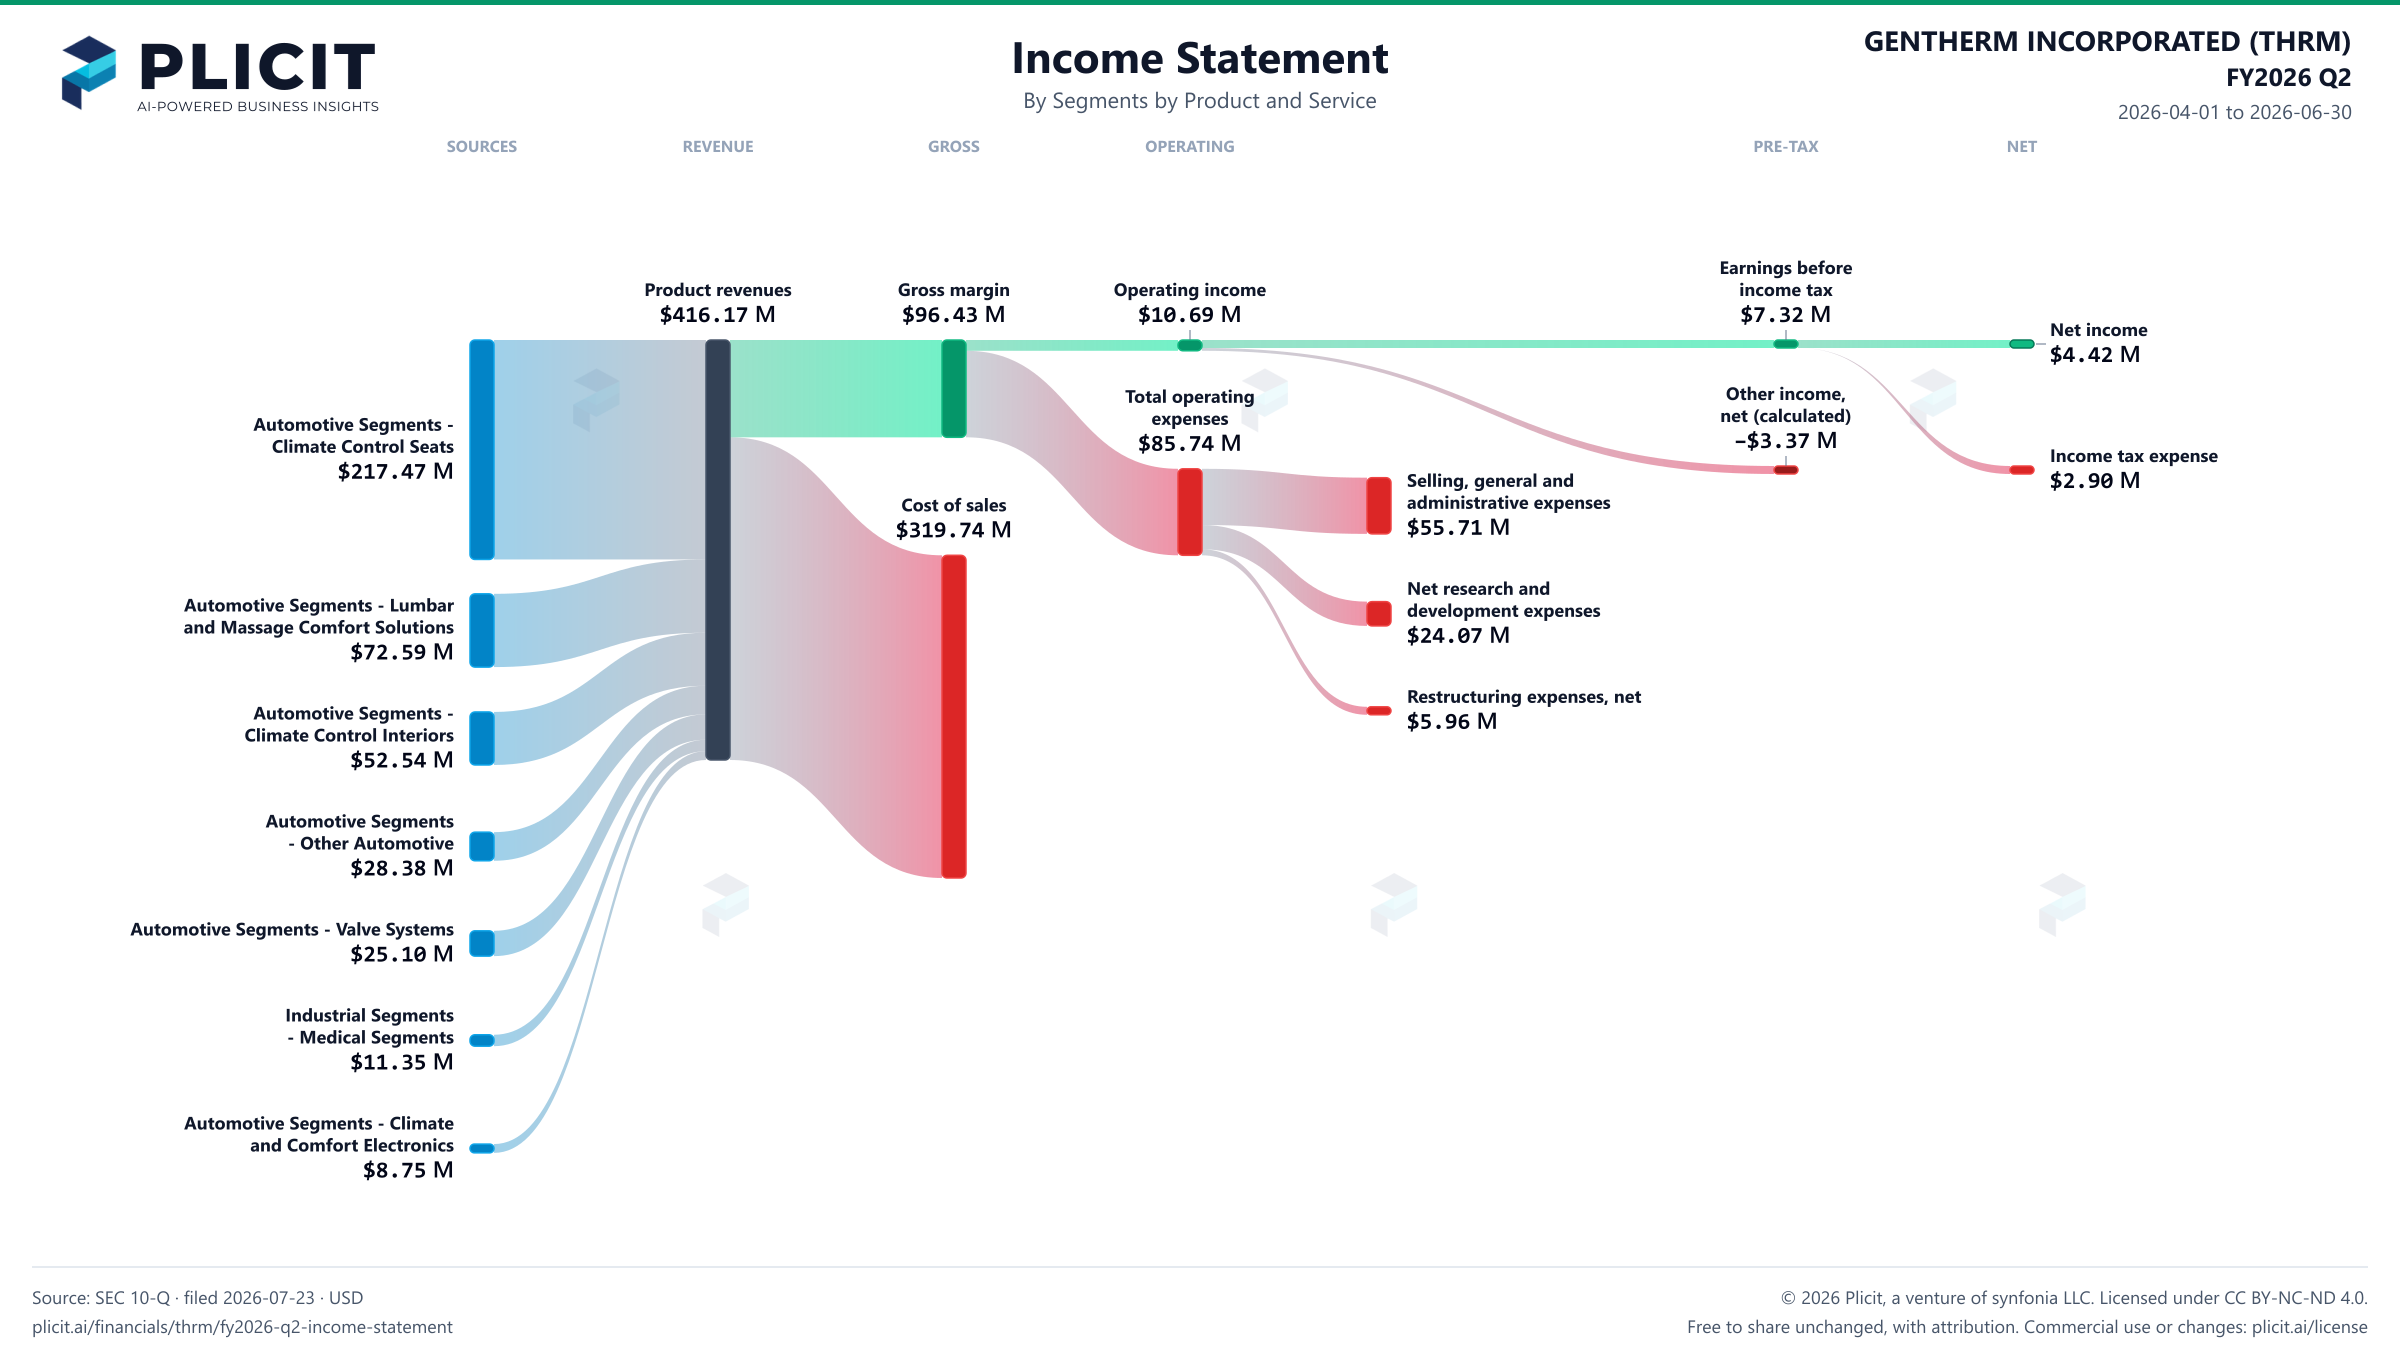
GENTHERM INCORPORATED (THRM) FY2026 Q2 P&L / Income Statement Sankey chart, Segments by Product and Service view
Free to share unchanged, with credit to Plicit.ai · CC BY-NC-ND 4.0Download PNG

Gross margin

23.2%

Gross profit / revenue

Operating margin

2.6%

Operating profit / revenue

Cash conversion

165.5%

Operating cash / net income, same period

Newsletter

Get the teardowns by email

Subscribe if you want the public-company teardowns in your inbox when they're released.

Product waitlist

Health Check and Teardown for your own company

A health check uncovers insights of your private books, not a public ticker. Join this list to get notified as soon as we go-live!