
Texas Pacific Land Corporation (TPL) FY2026 Q2 Balance Sheet

Balance Sheet

As of 2026-06-30

Swipe to see the full flow
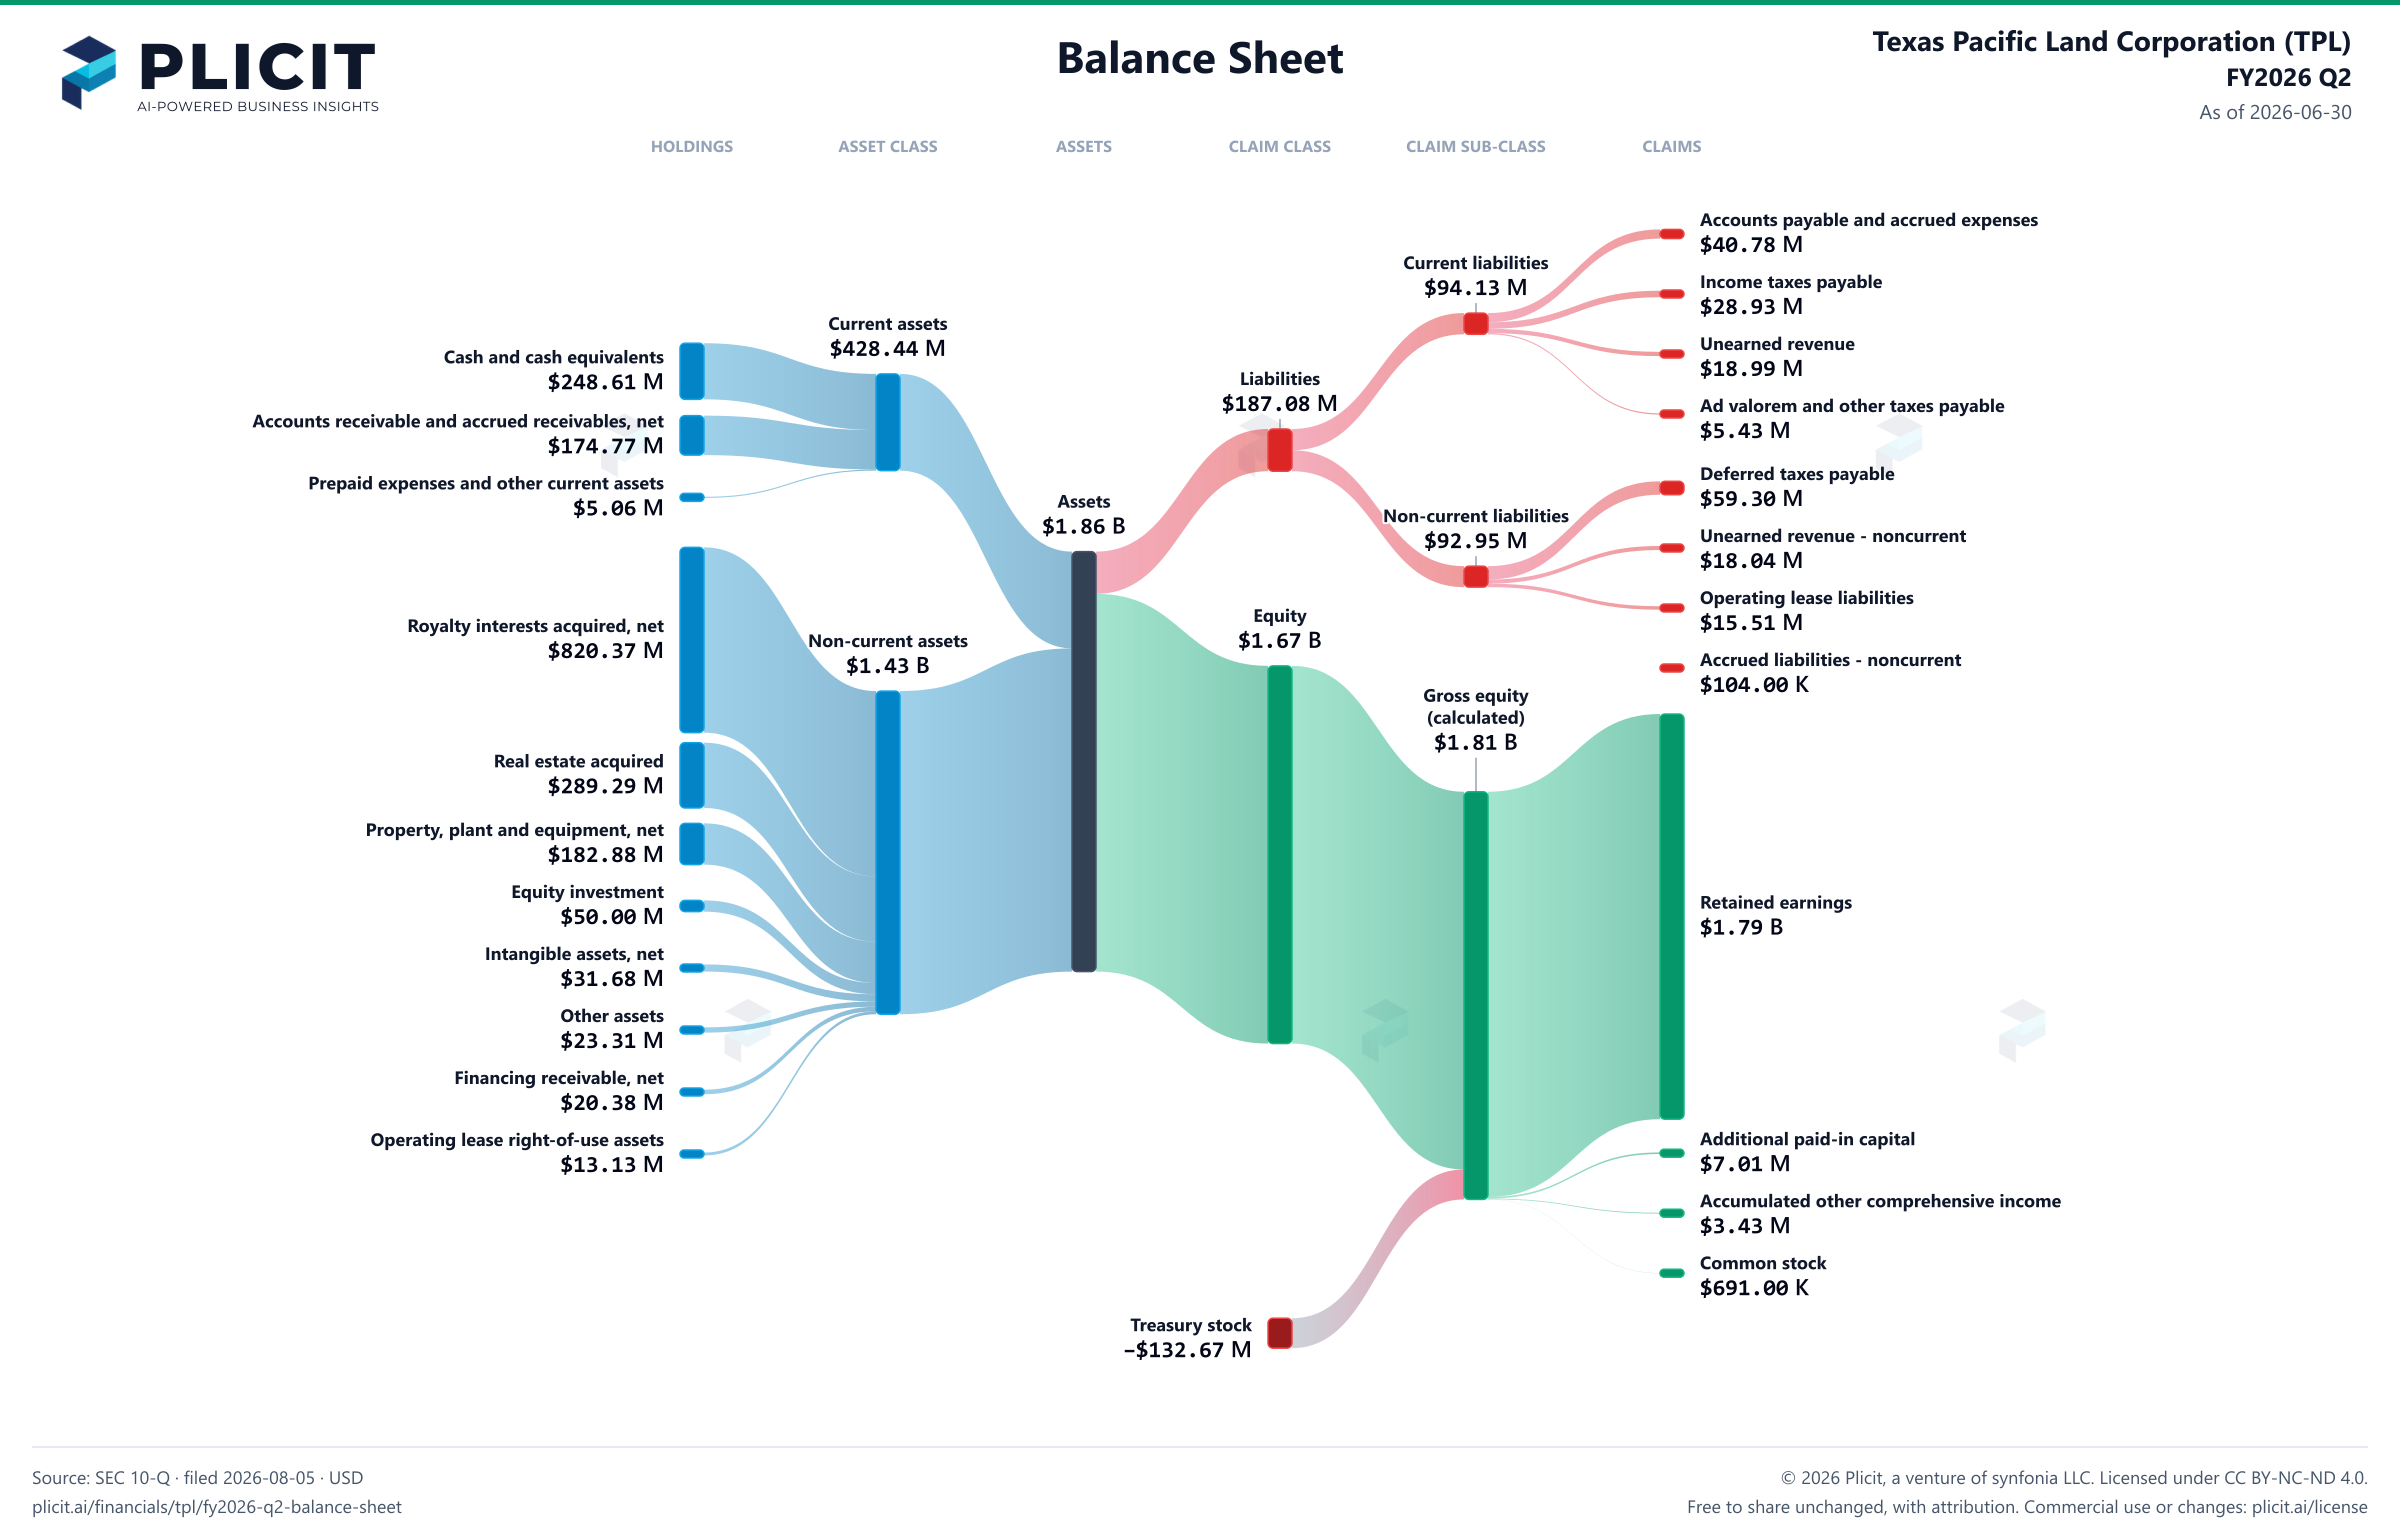
Texas Pacific Land Corporation (TPL) FY2026 Q2 Balance SheetBalance sheet as of 2026-06-30. The chart shows assets, liabilities and equity at that date.Current liabilities$94.13 MCurrent assets$428.44 MLiabilities$187.08 MAssets$1.86 BNon-current liabilities$92.95 MEquity$1.67 BNon-current assets$1.43 BGross equity(calculated)$1.81 BHOLDINGSASSET CLASSASSETSCLAIM CLASSCLAIM SUB-CLASSCLAIMSCash and cash equivalentsAccounts receivable and accrued receivables, netPrepaid expenses and other current assetsRoyalty interests acquired, netReal estate acquiredProperty, plant and equipment, netEquity investmentIntangible assets, netOther assetsFinancing receivable, netOperating lease right-of-use assetsAccounts payable and accrued expensesIncome taxes payableUnearned revenueAd valorem and other taxes payableDeferred taxes payableUnearned revenue - noncurrentOperating lease liabilitiesAccrued liabilities - noncurrentRetained earningsAdditional paid-in capitalAccumulated other comprehensive incomeCommon stock, $0.01 par value; 139,610,808 shares authorized as of June 30, 2026 and December 31, 2025, 68,974,683 and 68,938,230 outstanding as of June 30, 2026 and December 31, 2025, respectivelyCurrent assetsNon-current assetsAssetsCurrent liabilitiesNon-current liabilitiesLiabilitiesEquityGross equity (calculated)Treasury stock, at cost; 283,545 and 319,998 shares as of June 30, 2026 and December 31, 2025, respectivelyAccounts payable and accrued expensesAccounts payable and accrued expenses$40.78 MCurrent liabilitiesCurrent liabilities$94.13 MIncome taxes payableIncome taxes payable$28.93 MCurrent assetsCurrent assets$428.44 MUnearned revenueUnearned revenue$18.99 MCash and cash equivalentsCash and cash equivalents$248.61 MLiabilitiesLiabilities$187.08 MAd valorem and other taxes payableAd valorem and other taxes payable$5.43 MAccounts receivable and accrued receivables, netAccounts receivable and accrued receivables, net$174.77 MDeferred taxes payableDeferred taxes payable$59.30 MPrepaid expenses and other current assetsPrepaid expenses and other current assets$5.06 MAssetsAssets$1.86 BNon-current liabilitiesNon-current liabilities$92.95 MUnearned revenue - noncurrentUnearned revenue - noncurrent$18.04 MOperating lease liabilitiesOperating lease liabilities$15.51 MEquityEquity$1.67 BRoyalty interests acquired, netRoyalty interests acquired, net$820.37 MNon-current assetsNon-current assets$1.43 BAccrued liabilities - noncurrentAccrued liabilities - noncurrent$104.00 KGross equity (calculated)Gross equity(calculated)$1.81 BReal estate acquiredReal estate acquired$289.29 MProperty, plant and equipment, netProperty, plant and equipment, net$182.88 MEquity investmentEquity investment$50.00 MRetained earningsRetained earnings$1.79 BIntangible assets, netIntangible assets, net$31.68 MOther assetsOther assets$23.31 MFinancing receivable, netFinancing receivable, net$20.38 MAdditional paid-in capitalAdditional paid-in capital$7.01 MOperating lease right-of-use assetsOperating lease right-of-use assets$13.13 MAccumulated other comprehensive incomeAccumulated other comprehensive income$3.43 MCommon stock, $0.01 par value; 139,610,808 shares authorized as of June 30, 2026 and December 31, 2025, 68,974,683 and 68,938,230 outstanding as of June 30, 2026 and December 31, 2025, respectivelyCommon stock$691.00 KTreasury stock, at cost; 283,545 and 319,998 shares as of June 30, 2026 and December 31, 2025, respectivelyTreasury stock−$132.67 M
Chart details

Texas Pacific Land Corporation (TPL) FY2026 Q2 Balance Sheet

Balance sheet as of 2026-06-30. The chart shows assets, liabilities and equity at that date.

Assets
1,859,474,000 US dollars
Current assets
428,444,000 US dollars
Non-current assets
1,431,030,000 US dollars
Liabilities
187,076,000 US dollars
Current liabilities
94,125,000 US dollars
Non-current liabilities
92,951,000 US dollars
Equity
1,672,398,000 US dollars
Cash and cash equivalents
248,612,000 US dollars
Accounts receivable and accrued receivables, net
174,770,000 US dollars
Prepaid expenses and other current assets
5,062,000 US dollars
Tax like-kind exchange escrow
0 US dollars
Prepaid income taxes
0 US dollars
Royalty interests acquired, net
820,373,000 US dollars
Real estate acquired
289,291,000 US dollars
Property, plant and equipment, net
182,877,000 US dollars
Equity investment
50,000,000 US dollars
Intangible assets, net
31,675,000 US dollars
Other assets
23,308,000 US dollars
Financing receivable, net
20,376,000 US dollars
Operating lease right-of-use assets
13,130,000 US dollars
1/16th and 1/128th nonparticipating perpetual royalty interests - 1/16th and 1/128th nonparticipating perpetual royalty interests
0 US dollars
Land (surface rights) - Land (surface rights)
0 US dollars
Accounts payable and accrued expenses
40,775,000 US dollars
Income taxes payable
28,933,000 US dollars
Unearned revenue
18,986,000 US dollars
Ad valorem and other taxes payable
5,431,000 US dollars
Credit facility
0 US dollars
Deferred taxes payable
59,298,000 US dollars
Unearned revenue - noncurrent
18,036,000 US dollars
Operating lease liabilities
15,513,000 US dollars
Accrued liabilities - noncurrent
104,000 US dollars
Commitments and contingencies (Note 12)
0 US dollars
Retained earnings
1,793,936,000 US dollars
Additional paid-in capital
7,011,000 US dollars
Accumulated other comprehensive income
3,433,000 US dollars
Common stock, $0.01 par value; 139,610,808 shares authorized as of June 30, 2026 and December 31, 2025, 68,974,683 and 68,938,230 outstanding as of June 30, 2026 and December 31, 2025, respectively
691,000 US dollars
Preferred stock, $0.01 par value; 1,000,000 shares authorized, none outstanding as of June 30, 2026 and December 31, 2025
0 US dollars
Treasury stock, at cost; 283,545 and 319,998 shares as of June 30, 2026 and December 31, 2025, respectively
negative 132,673,000 US dollars
Gross equity (calculated)
1,805,071,000 US dollars. Net equity plus the magnitudes of its negative contributions equals gross positive equity. The negative contributions enter this reconciliation as add-backs; their filed signs stay negative.

Chart connections

  • Assets equal liabilities plus consolidated equity. Consolidated equity includes noncontrolling interests when reported.
  • Treasury shares and other negative equity contributions reduce equity.
Texas Pacific Land Corporation (TPL) FY2026 Q2 Balance Sheet Sankey chart
Free to share unchanged, with credit to Plicit.ai · CC BY-NC-ND 4.0Download PNG

Newsletter

Get the teardowns by email

Subscribe if you want the public-company teardowns in your inbox when they're released.

Product waitlist

Health Check and Teardown for your own company

A health check uncovers insights of your private books, not a public ticker. Join this list to get notified as soon as we go-live!