
TransUnion (TRU) FY2026 Q2 Balance Sheet
As of 2026-06-30
Balance Sheet
As of 2026-06-30
Swipe to see the full flow
Chart details
TransUnion (TRU) FY2026 Q2 Balance Sheet
Balance sheet as of 2026-06-30. The chart shows assets, liabilities and equity at that date.
- Assets
- 12,189,900,000 US dollars
- Current assets
- 2,178,000,000 US dollars
- Non-current assets
- 10,011,900,000 US dollars
- Liabilities
- 7,191,300,000 US dollars
- Current liabilities
- 1,146,100,000 US dollars
- Non-current liabilities
- 6,045,200,000 US dollars
- Equity
- 4,998,600,000 US dollars
- Noncontrolling interest
- 155,700,000 US dollars. Included in consolidated equity; this amount is not added again.
- Trade accounts receivable, net of allowance of $26.6 and $27.7
- 1,047,500,000 US dollars
- Cash and cash equivalents
- 839,100,000 US dollars
- Other current assets
- 291,400,000 US dollars
- Goodwill
- 5,811,800,000 US dollars
- Other intangibles, net of accumulated amortization of $2,898.8 and $2,716.3
- 3,520,400,000 US dollars
- Other assets
- 408,800,000 US dollars
- Property, plant and equipment, net of accumulated depreciation and amortization of $546.4 and $545.0
- 270,900,000 US dollars
- Other current liabilities
- 528,100,000 US dollars
- Trade accounts payable
- 404,900,000 US dollars
- Current portion of long-term debt
- 213,100,000 US dollars
- Long-term debt
- 5,372,200,000 US dollars
- Deferred taxes
- 539,200,000 US dollars
- Other liabilities
- 133,800,000 US dollars
- Retained earnings
- 3,214,900,000 US dollars
- Additional paid-in capital
- 2,390,900,000 US dollars
- Common stock, $0.01 par value; 1.0 billion shares authorized at June 30, 2026 and December 31, 2025, 199.0 million and 199.4 million shares issued at June 30, 2026 and December 31, 2025, respectively, and 191.6 million and 192.4 million shares outstanding as of June 30, 2026 and December 31, 2025, respectively
- 1,900,000 US dollars
- Preferred stock, $0.01 par value; 100.0 million shares authorized; none issued or outstanding as of June 30, 2026 and December 31, 2025, respectively
- 0 US dollars
- Noncontrolling interests
- 155,700,000 US dollars
- Treasury stock at cost; 7.4 million and 7.0 million shares at June 30, 2026 and December 31, 2025, respectively
- negative 402,500,000 US dollars
- Accumulated other comprehensive loss
- negative 362,300,000 US dollars
- Gross equity (calculated)
- 5,763,400,000 US dollars. Net equity plus the magnitudes of its negative contributions equals gross positive equity. The negative contributions enter this reconciliation as add-backs; their filed signs stay negative.
Chart connections
- Assets equal liabilities plus consolidated equity. Consolidated equity includes noncontrolling interests when reported.
- Treasury shares and other negative equity contributions reduce equity.
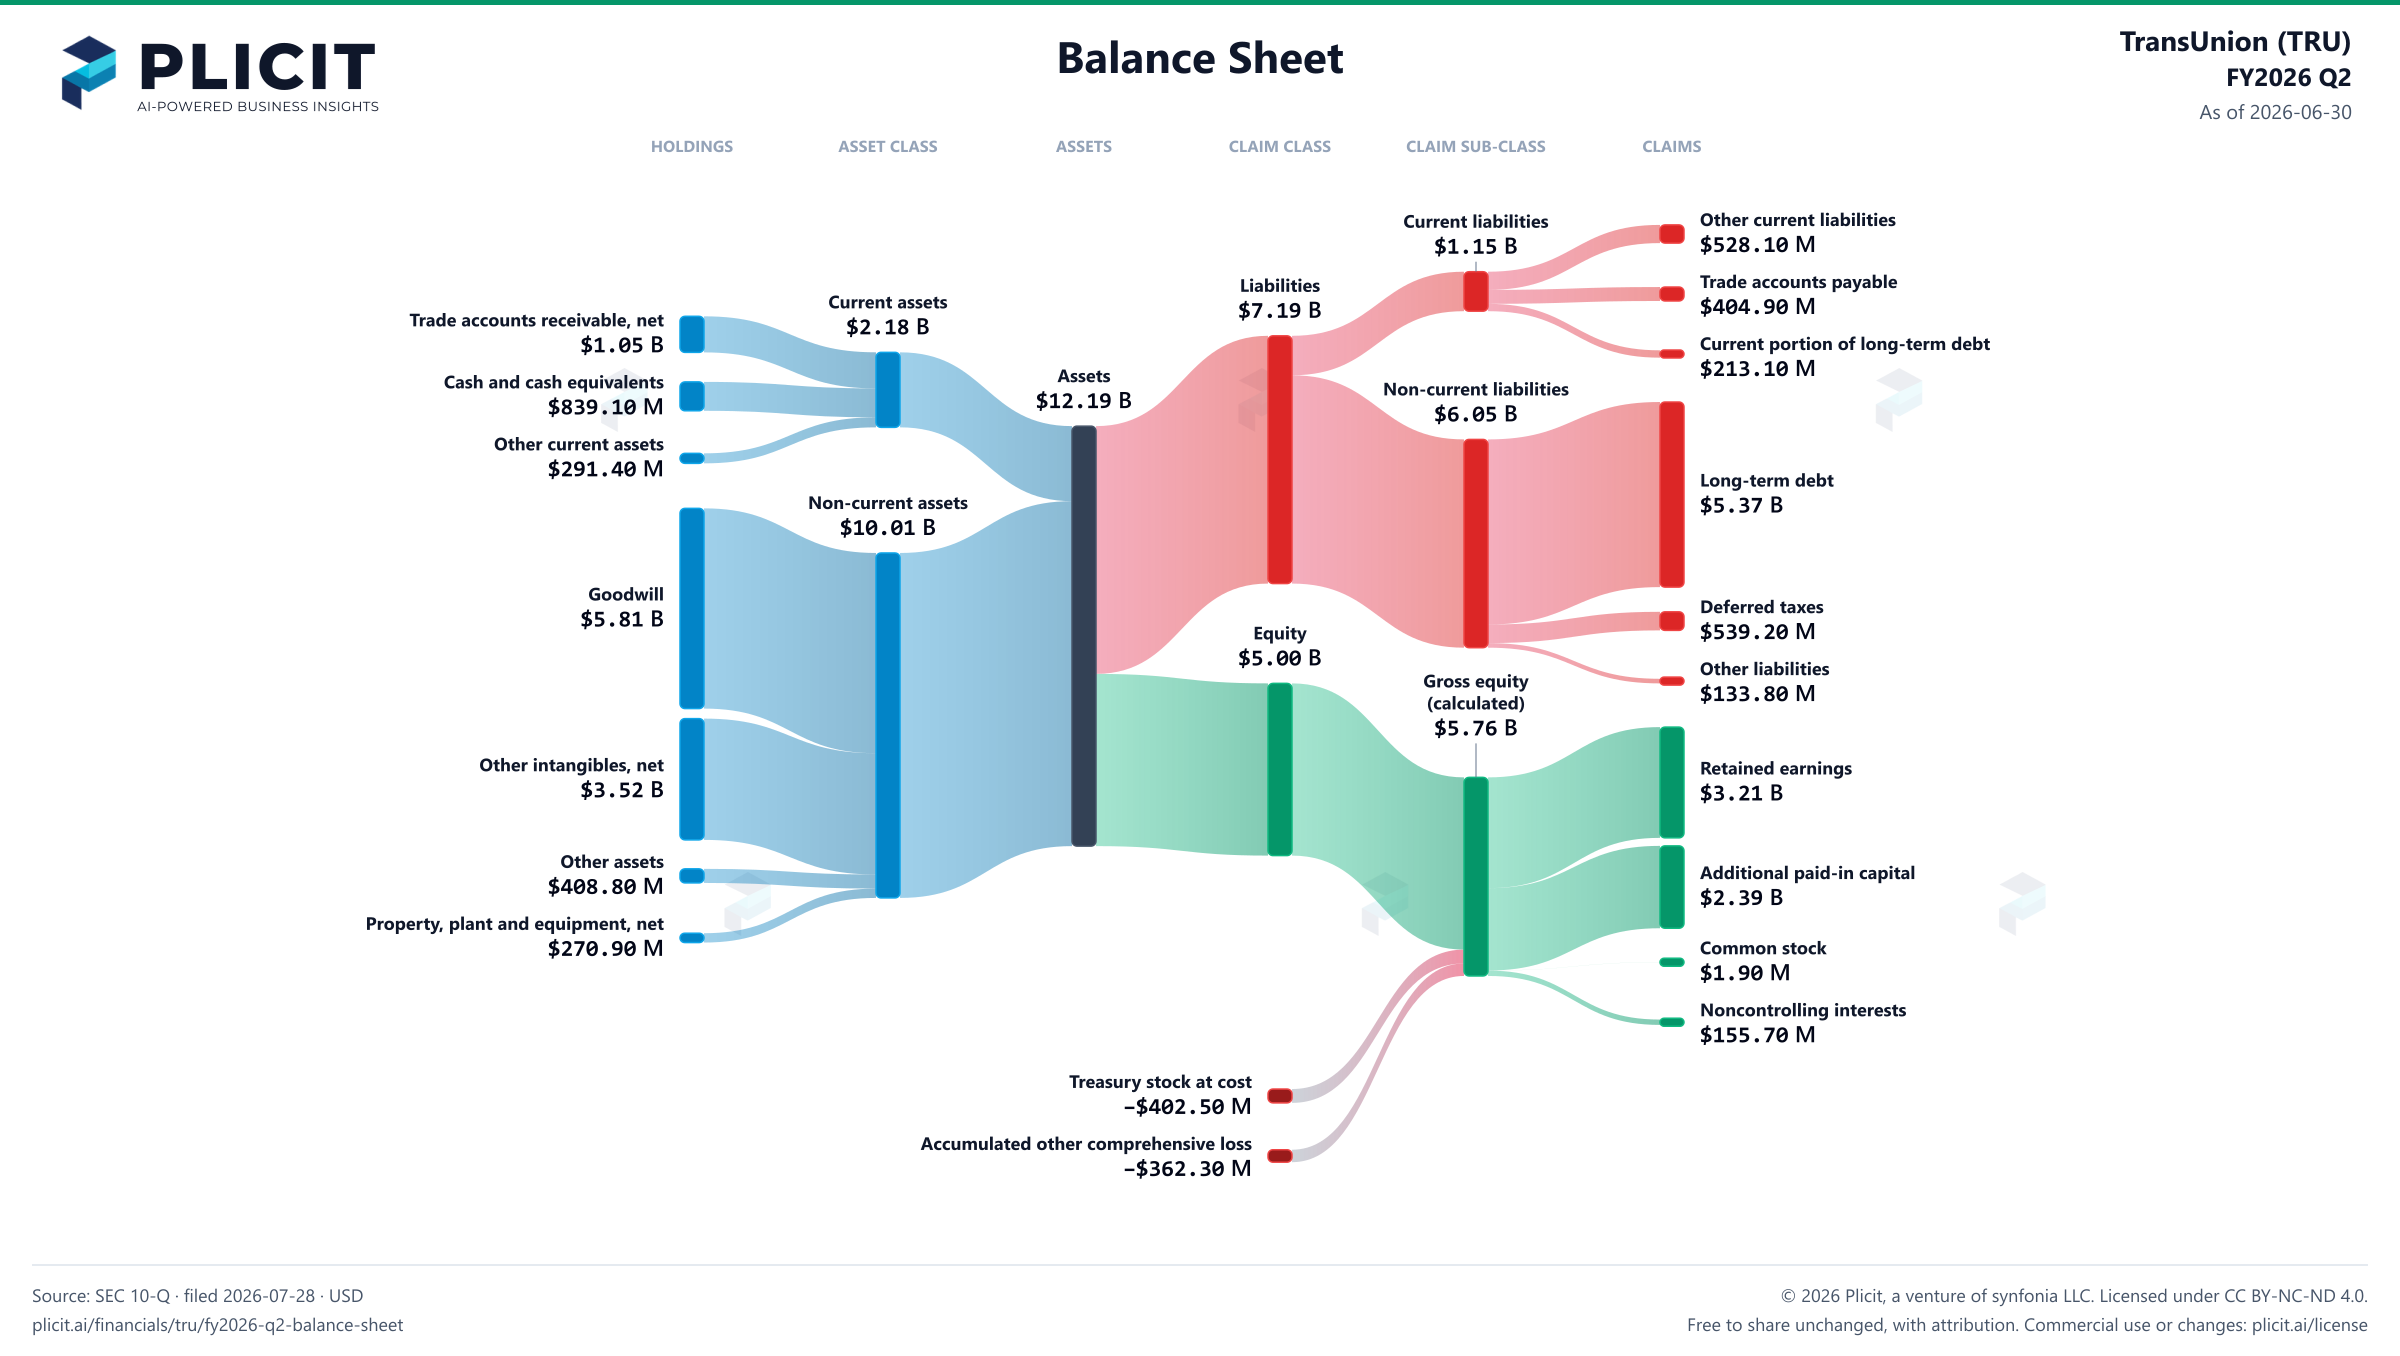
Free to share unchanged, with credit to Plicit.ai · CC BY-NC-ND 4.0Download PNG
Product waitlist
Health Check and Teardown for your own company
A health check uncovers insights of your private books, not a public ticker. Join this list to get notified as soon as we go-live!