
TYLER TECHNOLOGIES, INC. (TYL) FY2026 Q2 Balance Sheet
As of 2026-06-30
Balance Sheet
As of 2026-06-30
Swipe to see the full flow
Chart details
TYLER TECHNOLOGIES, INC. (TYL) FY2026 Q2 Balance Sheet
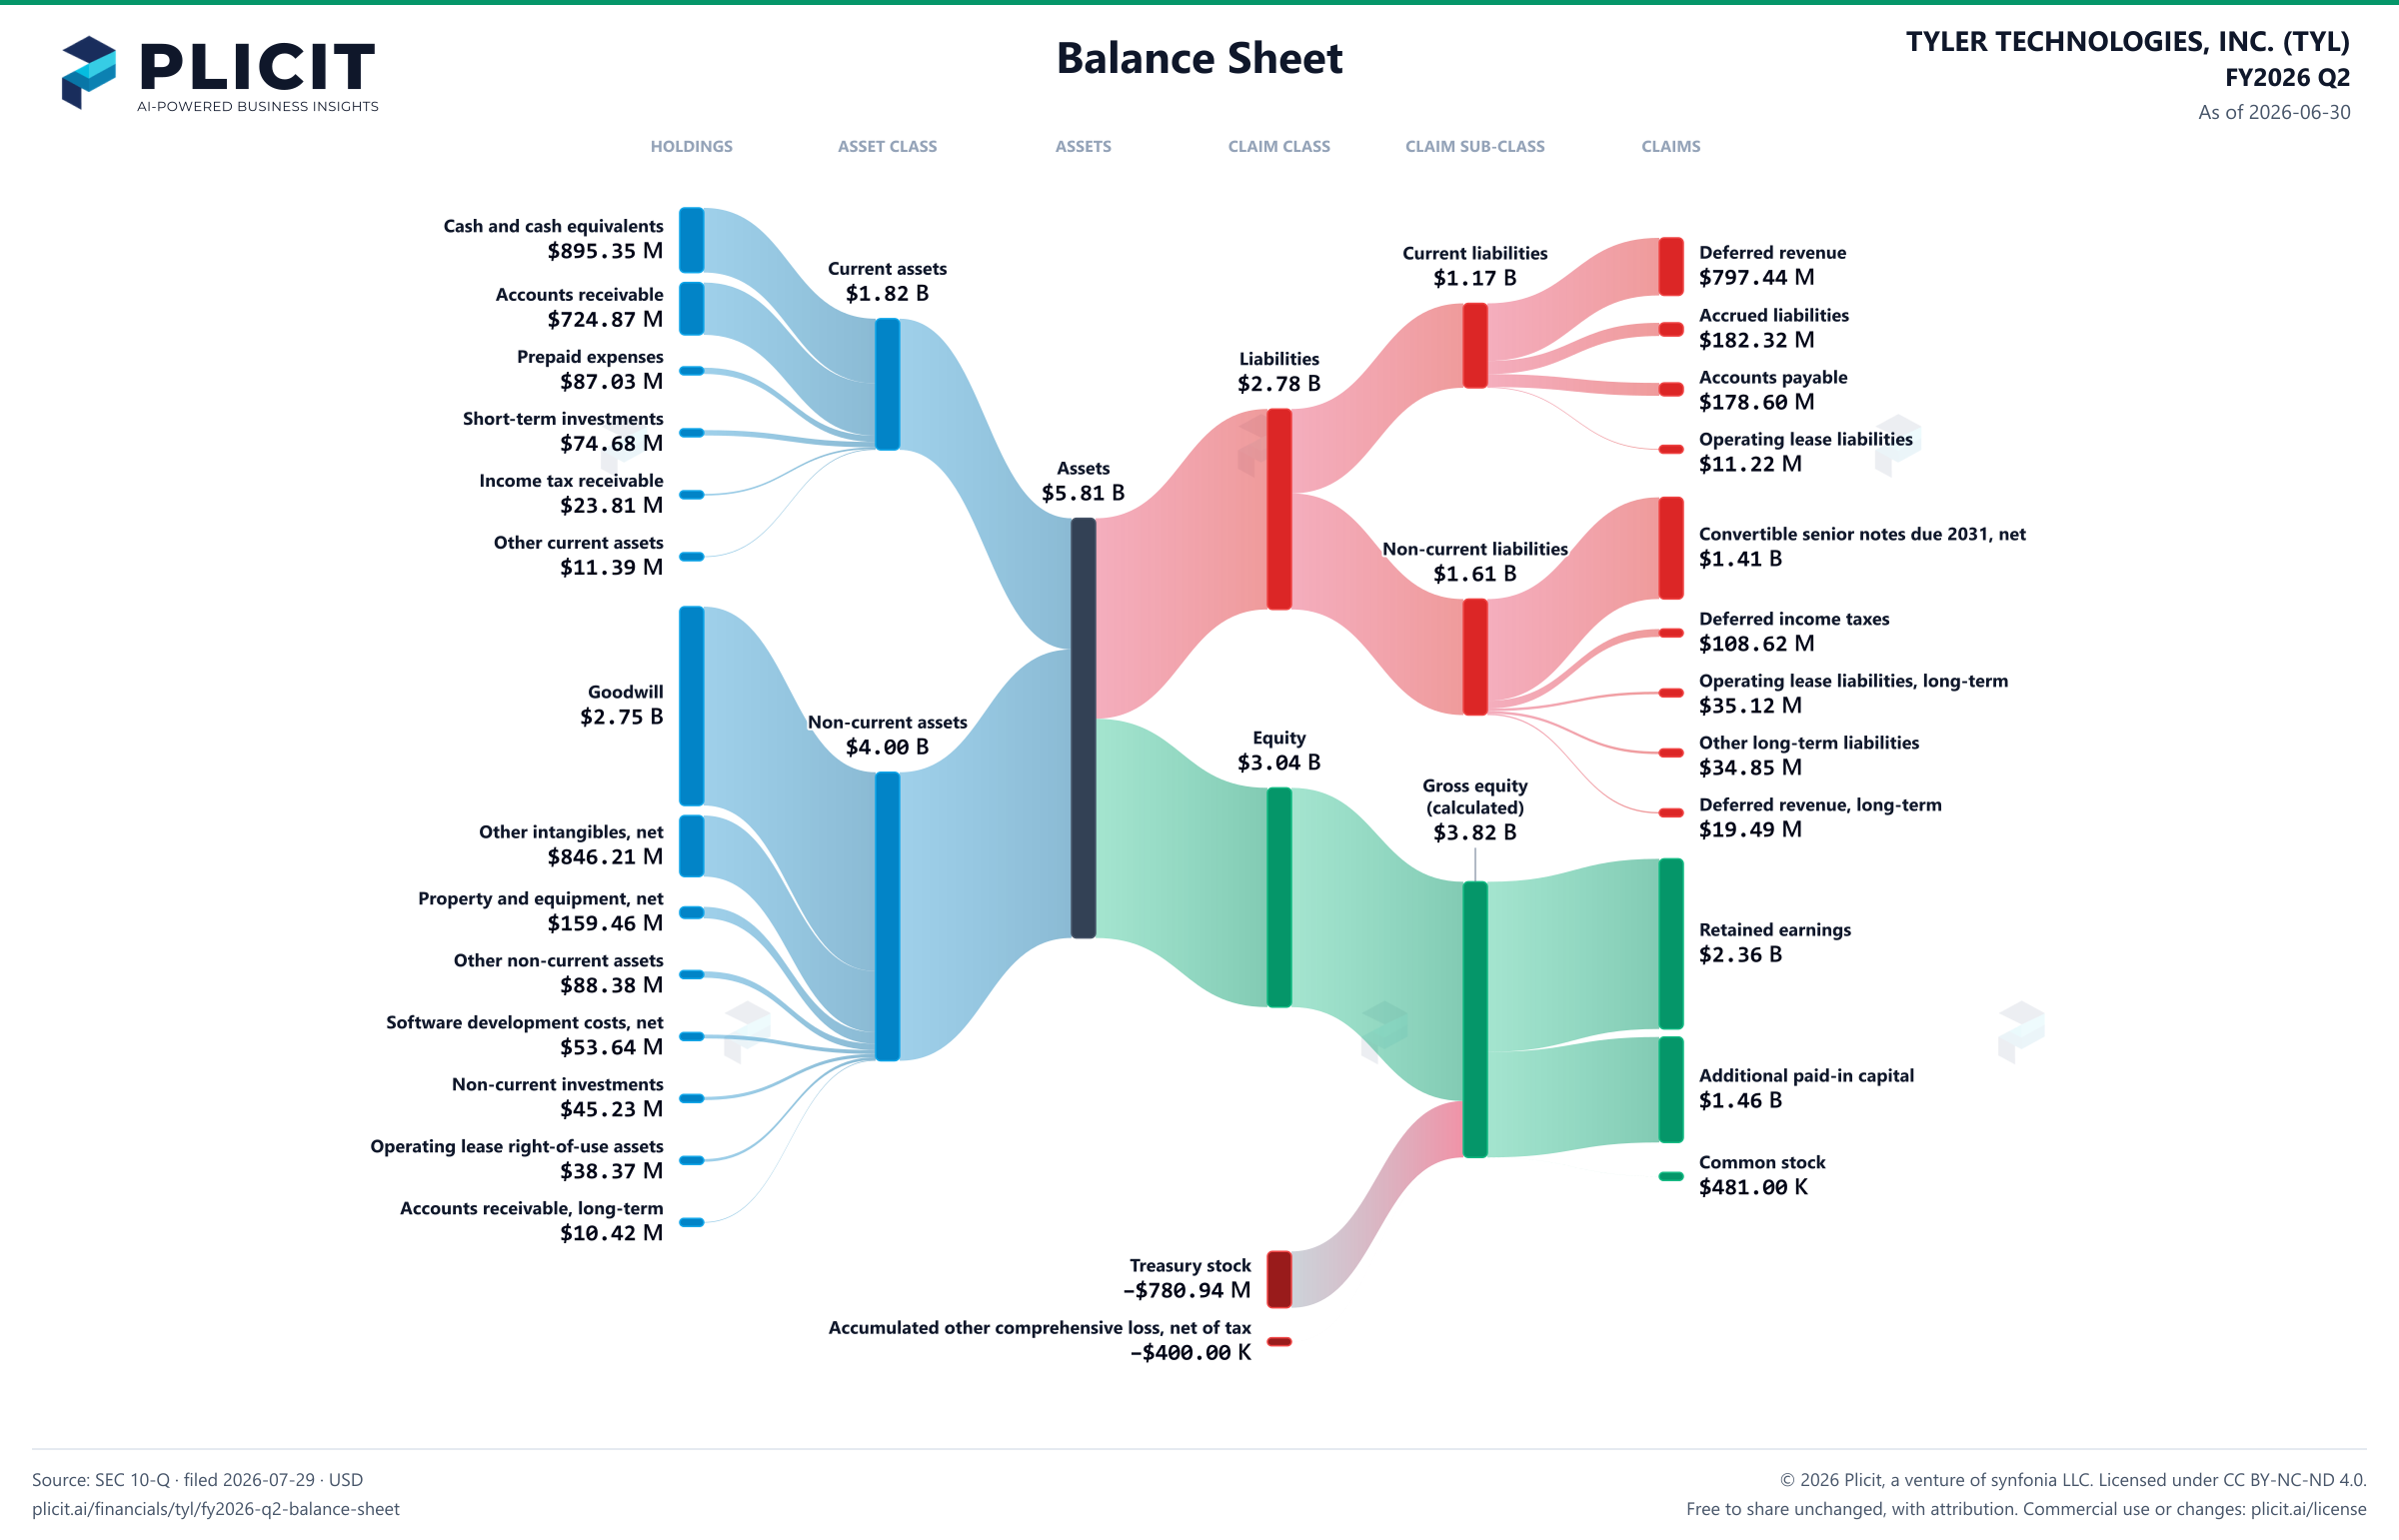
Balance sheet as of 2026-06-30. The chart shows assets, liabilities and equity at that date.
- Assets
- 5,813,576,000 US dollars
- Current assets
- 1,817,122,000 US dollars
- Non-current assets
- 3,996,454,000 US dollars
- Liabilities
- 2,776,345,000 US dollars
- Current liabilities
- 1,169,576,000 US dollars
- Non-current liabilities
- 1,606,769,000 US dollars
- Equity
- 3,037,231,000 US dollars
- Cash and cash equivalents
- 895,353,000 US dollars
- Accounts receivable (less allowance for losses and sales adjustments of $25,757 at 2026 and $31,972 at 2025)
- 724,866,000 US dollars
- Prepaid expenses
- 87,031,000 US dollars
- Short-term investments
- 74,682,000 US dollars
- Income tax receivable
- 23,805,000 US dollars
- Other current assets
- 11,385,000 US dollars
- Goodwill
- 2,754,742,000 US dollars
- Other intangibles, net
- 846,206,000 US dollars
- Property and equipment, net
- 159,462,000 US dollars
- Other non-current assets
- 88,376,000 US dollars
- Software development costs, net
- 53,642,000 US dollars
- Non-current investments
- 45,232,000 US dollars
- Operating lease right-of-use assets
- 38,374,000 US dollars
- Accounts receivable, long-term
- 10,420,000 US dollars
- Deferred revenue
- 797,435,000 US dollars
- Accrued liabilities
- 182,320,000 US dollars
- Accounts payable
- 178,600,000 US dollars
- Operating lease liabilities
- 11,221,000 US dollars
- Current portion of convertible senior notes due 2026, net
- 0 US dollars
- Convertible senior notes due 2031, net
- 1,408,691,000 US dollars
- Deferred income taxes
- 108,624,000 US dollars
- Operating lease liabilities, long-term
- 35,118,000 US dollars
- Other long-term liabilities
- 34,850,000 US dollars
- Deferred revenue, long-term
- 19,486,000 US dollars
- Commitments and contingencies
- 0 US dollars
- Retained earnings
- 2,357,094,000 US dollars
- Additional paid-in capital
- 1,460,994,000 US dollars
- Common stock, $0.01 par value; 100,000,000 shares authorized; 48,147,969 shares issued and outstanding as of June 30, 2026 and December 31, 2025
- 481,000 US dollars
- Preferred stock, $10.00 par value; 1,000,000 shares authorized; none issued
- 0 US dollars
- Treasury stock, at cost; 7,217,405 and 5,027,037 shares in 2026 and 2025, respectively
- negative 780,938,000 US dollars
- Accumulated other comprehensive loss, net of tax
- negative 400,000 US dollars
- Gross equity (calculated)
- 3,818,569,000 US dollars. Net equity plus the magnitudes of its negative contributions equals gross positive equity. The negative contributions enter this reconciliation as add-backs; their filed signs stay negative.
Chart connections
- Assets equal liabilities plus consolidated equity. Consolidated equity includes noncontrolling interests when reported.
- Treasury shares and other negative equity contributions reduce equity.
Free to share unchanged, with credit to Plicit.ai · CC BY-NC-ND 4.0Download PNG
Product waitlist
Health Check and Teardown for your own company
A health check uncovers insights of your private books, not a public ticker. Join this list to get notified as soon as we go-live!