
UFP INDUSTRIES, INC. (UFPI) FY2026 Q2 Balance Sheet

Balance Sheet

As of 2026-06-27

Swipe to see the full flow
UFP INDUSTRIES, INC. (UFPI) FY2026 Q2 Balance SheetBalance sheet as of 2026-06-27. The chart shows assets, liabilities and equity at that date.Current assets$2.22 BCurrent liabilities$557.48 MLiabilities$1.04 BAssets$4.10 BNon-current liabilities$487.46 MEquity$3.06 BGross equity(calculated)$3.06 BNon-current assets$1.89 BRedeemable noncontrolling interest$485.00 KHOLDINGSASSET CLASSASSETSCLAIM CLASSCLAIM SUB-CLASSCLAIMSAccounts receivable, netCash and cash equivalentsRaw materialsFinished goodsOther current assetsInvestmentsIncome taxes receivableAssets held for saleRestricted cashProperty, plant and equipment, netGoodwillRight of use assetsOther intangible assets, netOther assetsRestricted investmentsDeferred income taxesIndefinite-lived intangible assetsAccounts payableAccrued compensation and benefitsOther accrued liabilitiesCurrent portion of lease liabilityCurrent portion of long-term debtLong-term debt and finance lease obligationsLease liabilityDeferred income taxesOther liabilitiesRetained earningsAdditional paid-in capitalCommon stock, $1 par value; shares authorized 240,000,000; issued and outstanding, 55,161,491, 56,591,900 and 58,566,148Noncontrolling interestCurrent assetsNon-current assetsAssetsCurrent liabilitiesNon-current liabilitiesLiabilitiesEquityGross equity (calculated)Accumulated other comprehensive income (loss)Redeemable noncontrolling interestAccounts receivable, netAccounts receivable, net$731.09 MAccounts payableAccounts payable$292.98 MCash and cash equivalentsCash and cash equivalents$597.26 MCurrent assetsCurrent assets$2.22 BCurrent liabilitiesCurrent liabilities$557.48 MAccrued compensation and benefitsAccrued compensation and benefits$143.90 MRaw materialsRaw materials$397.51 MOther accrued liabilitiesOther accrued liabilities$87.14 MFinished goodsFinished goods$350.99 MLiabilitiesLiabilities$1.04 BCurrent portion of lease liabilityCurrent portion of lease liability$27.96 MOther current assetsOther current assets$84.04 MAssetsAssets$4.10 BCurrent portion of long-term debtCurrent portion of long-term debt$5.49 MInvestmentsInvestments$46.33 MLong-term debt and finance lease obligationsLong-term debt and finance lease obligations$228.76 MNon-current liabilitiesNon-current liabilities$487.46 MIncome taxes receivableIncome taxes receivable$7.75 MLease liabilityLease liability$146.19 MAssets held for saleAssets held for sale$2.56 MEquityEquity$3.06 BDeferred income taxesDeferred income taxes$83.17 MRestricted cashRestricted cash$1.60 MOther liabilitiesOther liabilities$29.35 MGross equity (calculated)Gross equity(calculated)$3.06 BProperty, plant and equipment, netProperty, plant and equipment, net$1.08 BNon-current assetsNon-current assets$1.89 BGoodwillGoodwill$345.39 MRetained earningsRetained earnings$2.51 BRight of use assetsRight of use assets$163.89 MRedeemable noncontrolling interestRedeemable noncontrolling interest$485.00 KOther intangible assets, netOther intangible assets, net$128.82 MAdditional paid-in capitalAdditional paid-in capital$468.53 MOther assetsOther assets$98.14 MCommon stock, $1 par value; shares authorized 240,000,000; issued and outstanding, 55,161,491, 56,591,900 and 58,566,148Common stock$55.16 MRestricted investmentsRestricted investments$50.99 MNoncontrolling interestNoncontrolling interest$21.93 MDeferred income taxesDeferred income taxes$10.36 MAccumulated other comprehensive income (loss)Accumulated other comprehensive income (loss)−$49.00 KIndefinite-lived intangible assetsIndefinite-lived intangible assets$7.35 M
Chart details

UFP INDUSTRIES, INC. (UFPI) FY2026 Q2 Balance Sheet

Balance sheet as of 2026-06-27. The chart shows assets, liabilities and equity at that date.

Assets
4,104,864,000 US dollars
Current assets
2,219,142,000 US dollars
Non-current assets
1,885,722,000 US dollars
Liabilities
1,044,936,000 US dollars
Current liabilities
557,476,000 US dollars
Non-current liabilities
487,460,000 US dollars
Equity
3,059,443,000 US dollars
Redeemable noncontrolling interest
485,000 US dollars
Noncontrolling interest
21,927,000 US dollars. Included in consolidated equity; this amount is not added again.
Less accumulated depreciation and amortization
negative 994,569,000 US dollars. Part of Property, plant and equipment, net, drawn as one net amount.
Property, plant and equipment
2,075,346,000 US dollars. Part of Property, plant and equipment, net, drawn as one net amount.
Accounts receivable, net
731,092,000 US dollars
Cash and cash equivalents
597,263,000 US dollars
Raw materials
397,510,000 US dollars
Finished goods
350,994,000 US dollars
Other current assets
84,043,000 US dollars
Investments
46,330,000 US dollars
Income taxes receivable
7,748,000 US dollars
Assets held for sale
2,558,000 US dollars
Restricted cash
1,604,000 US dollars
Property, plant and equipment, net
1,080,777,000 US dollars
Goodwill
345,393,000 US dollars
Right of use assets
163,894,000 US dollars
Other intangible assets, net
128,819,000 US dollars
Other assets
98,136,000 US dollars
Restricted investments
50,991,000 US dollars
Deferred income taxes
10,361,000 US dollars
Indefinite-lived intangible assets
7,351,000 US dollars
Accounts payable
292,979,000 US dollars
Accrued compensation and benefits
143,902,000 US dollars
Other accrued liabilities
87,144,000 US dollars
Current portion of lease liability
27,958,000 US dollars
Current portion of long-term debt
5,493,000 US dollars
Long-term debt and finance lease obligations
228,758,000 US dollars
Lease liability
146,187,000 US dollars
Deferred income taxes
83,166,000 US dollars
Other liabilities
29,349,000 US dollars
Retained earnings
2,513,870,000 US dollars
Additional paid-in capital
468,534,000 US dollars
Common stock, $1 par value; shares authorized 240,000,000; issued and outstanding, 55,161,491, 56,591,900 and 58,566,148
55,161,000 US dollars
Noncontrolling interest
21,927,000 US dollars
Accumulated other comprehensive income (loss)
negative 49,000 US dollars
Gross equity (calculated)
3,059,492,000 US dollars. Net equity plus the magnitudes of its negative contributions equals gross positive equity. The negative contributions enter this reconciliation as add-backs; their filed signs stay negative.

Chart connections

  • Assets equal liabilities plus temporary equity plus consolidated equity. Consolidated equity includes noncontrolling interests when reported.
  • Treasury shares and other negative equity contributions reduce equity.
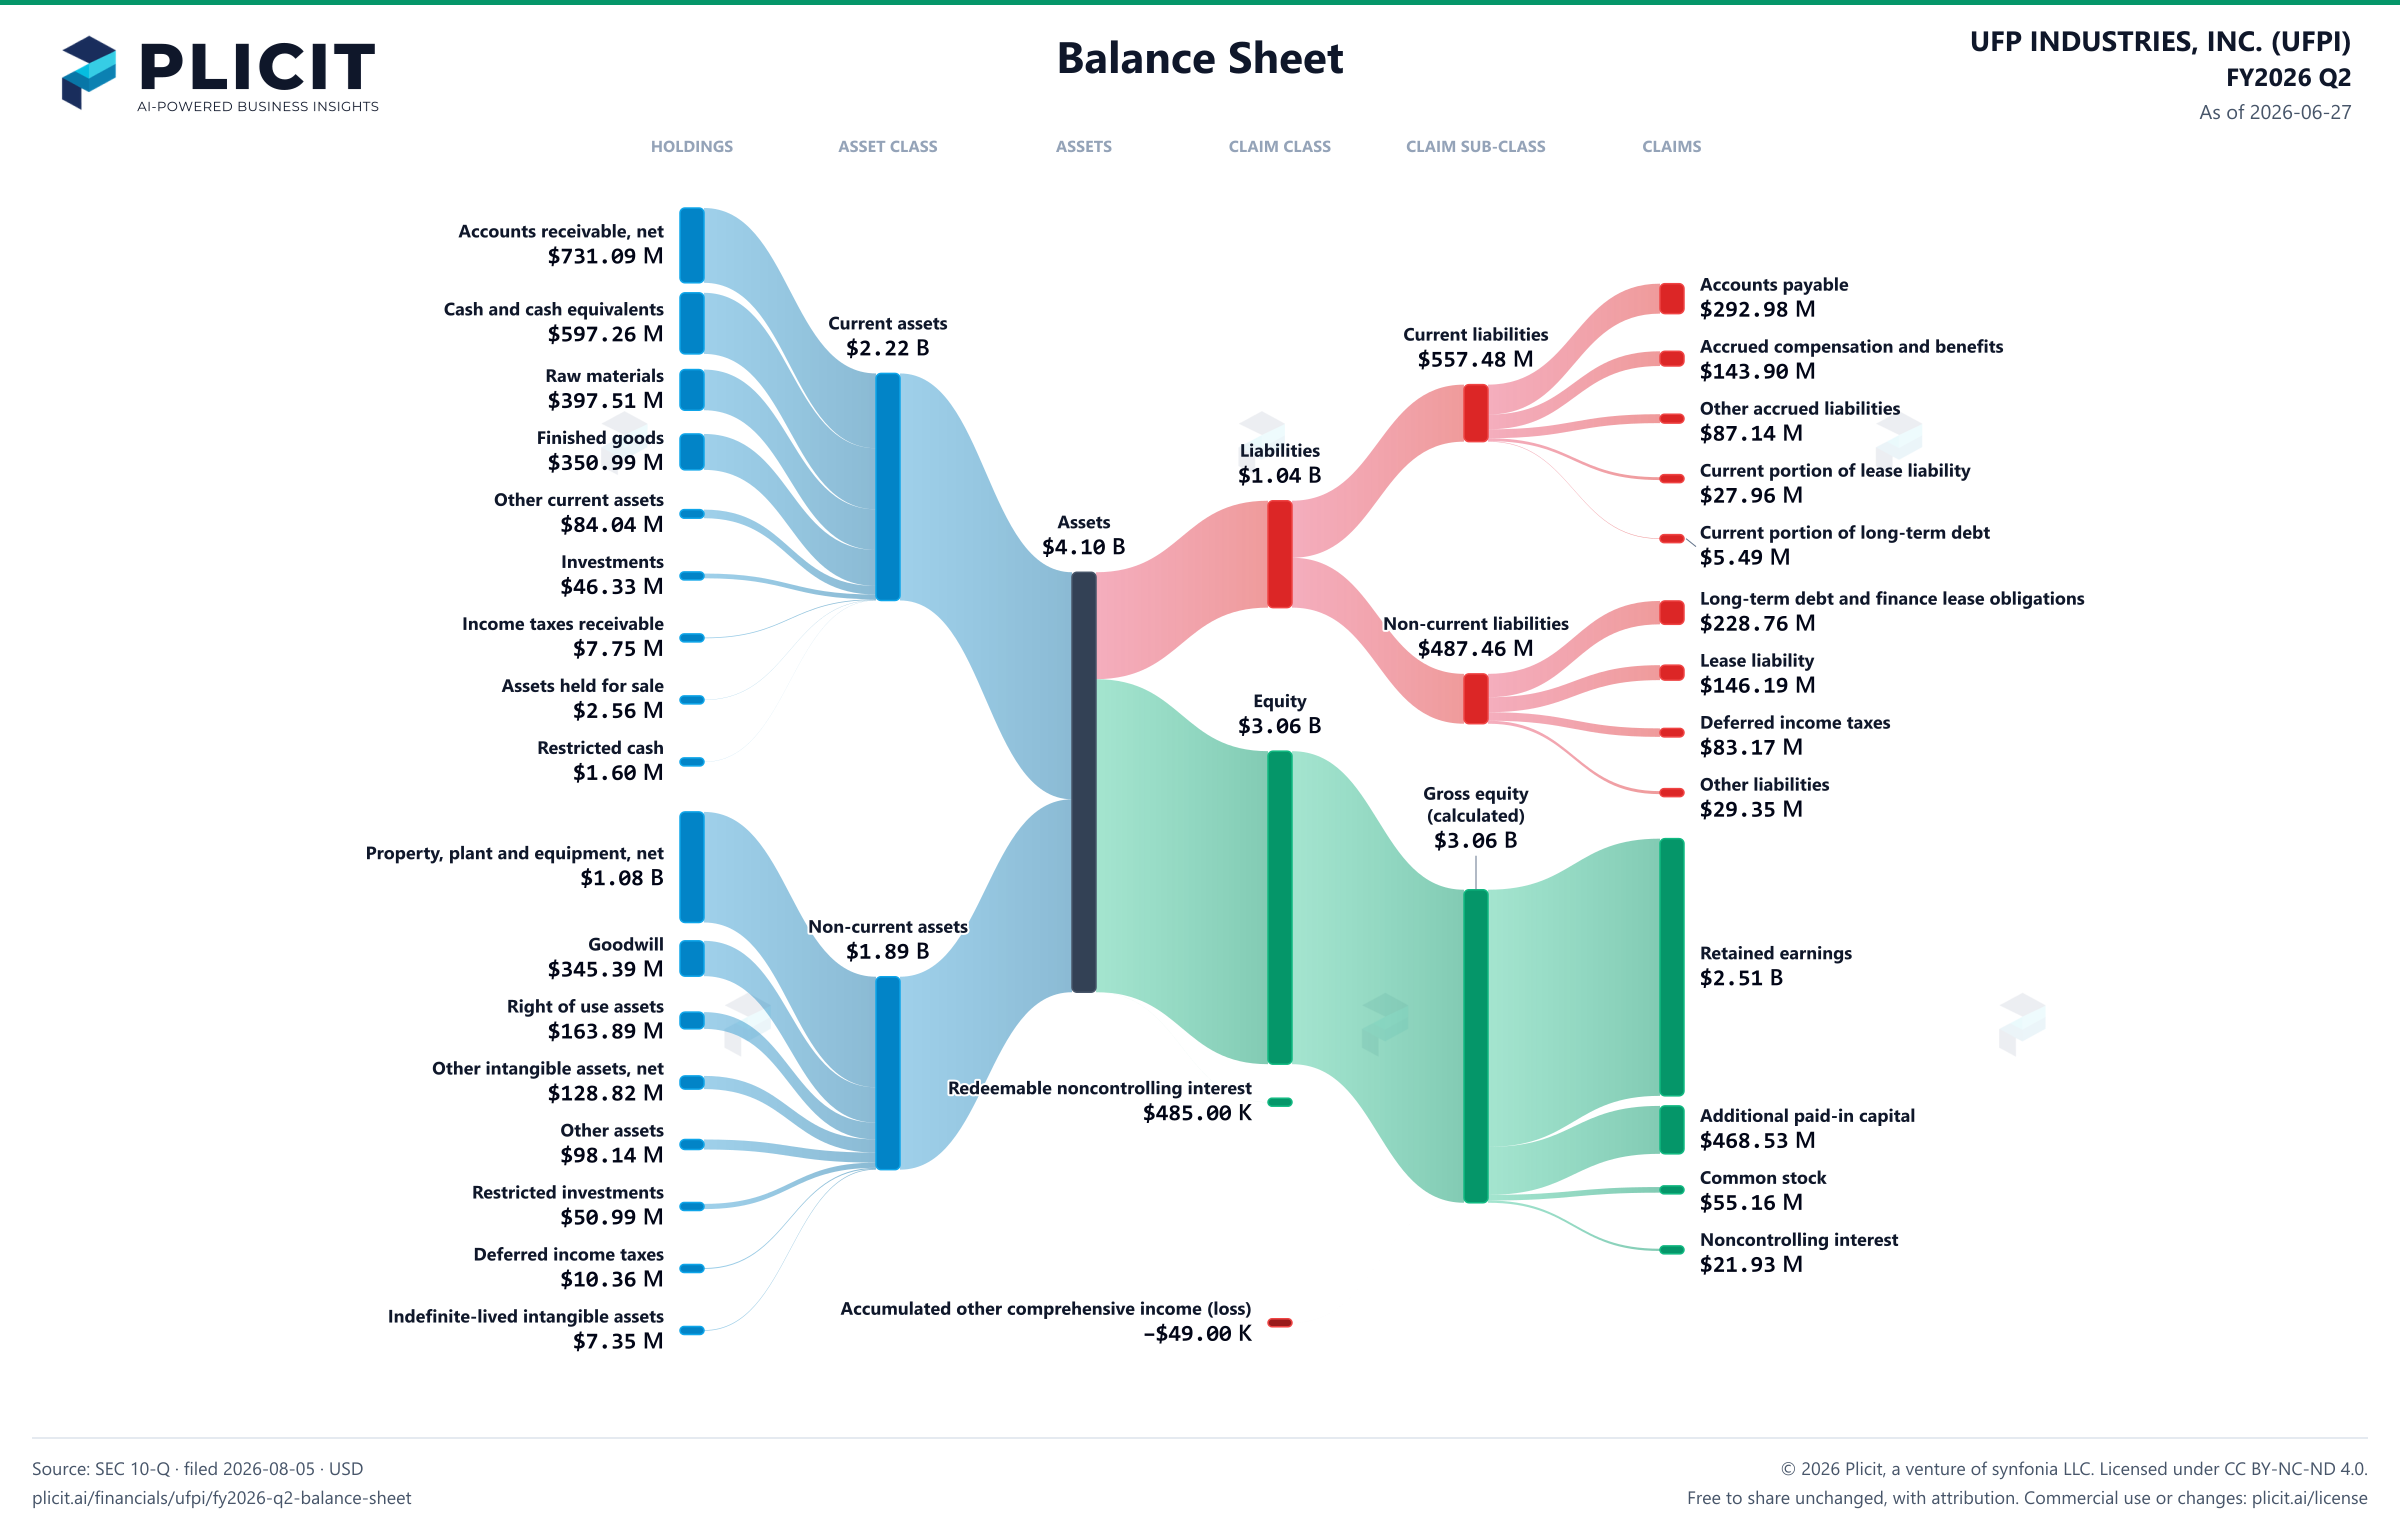
UFP INDUSTRIES, INC. (UFPI) FY2026 Q2 Balance Sheet Sankey chart
Free to share unchanged, with credit to Plicit.ai · CC BY-NC-ND 4.0Download PNG

Newsletter

Get the teardowns by email

Subscribe if you want the public-company teardowns in your inbox when they're released.

Product waitlist

Health Check and Teardown for your own company

A health check uncovers insights of your private books, not a public ticker. Join this list to get notified as soon as we go-live!