
VALERO ENERGY CORP/TX (VLO) FY2025 Annual Balance Sheet
As of 2025-12-31
Balance Sheet
As of 2025-12-31
Swipe to see the full flow
Chart details
VALERO ENERGY CORP/TX (VLO) FY2025 Annual Balance Sheet
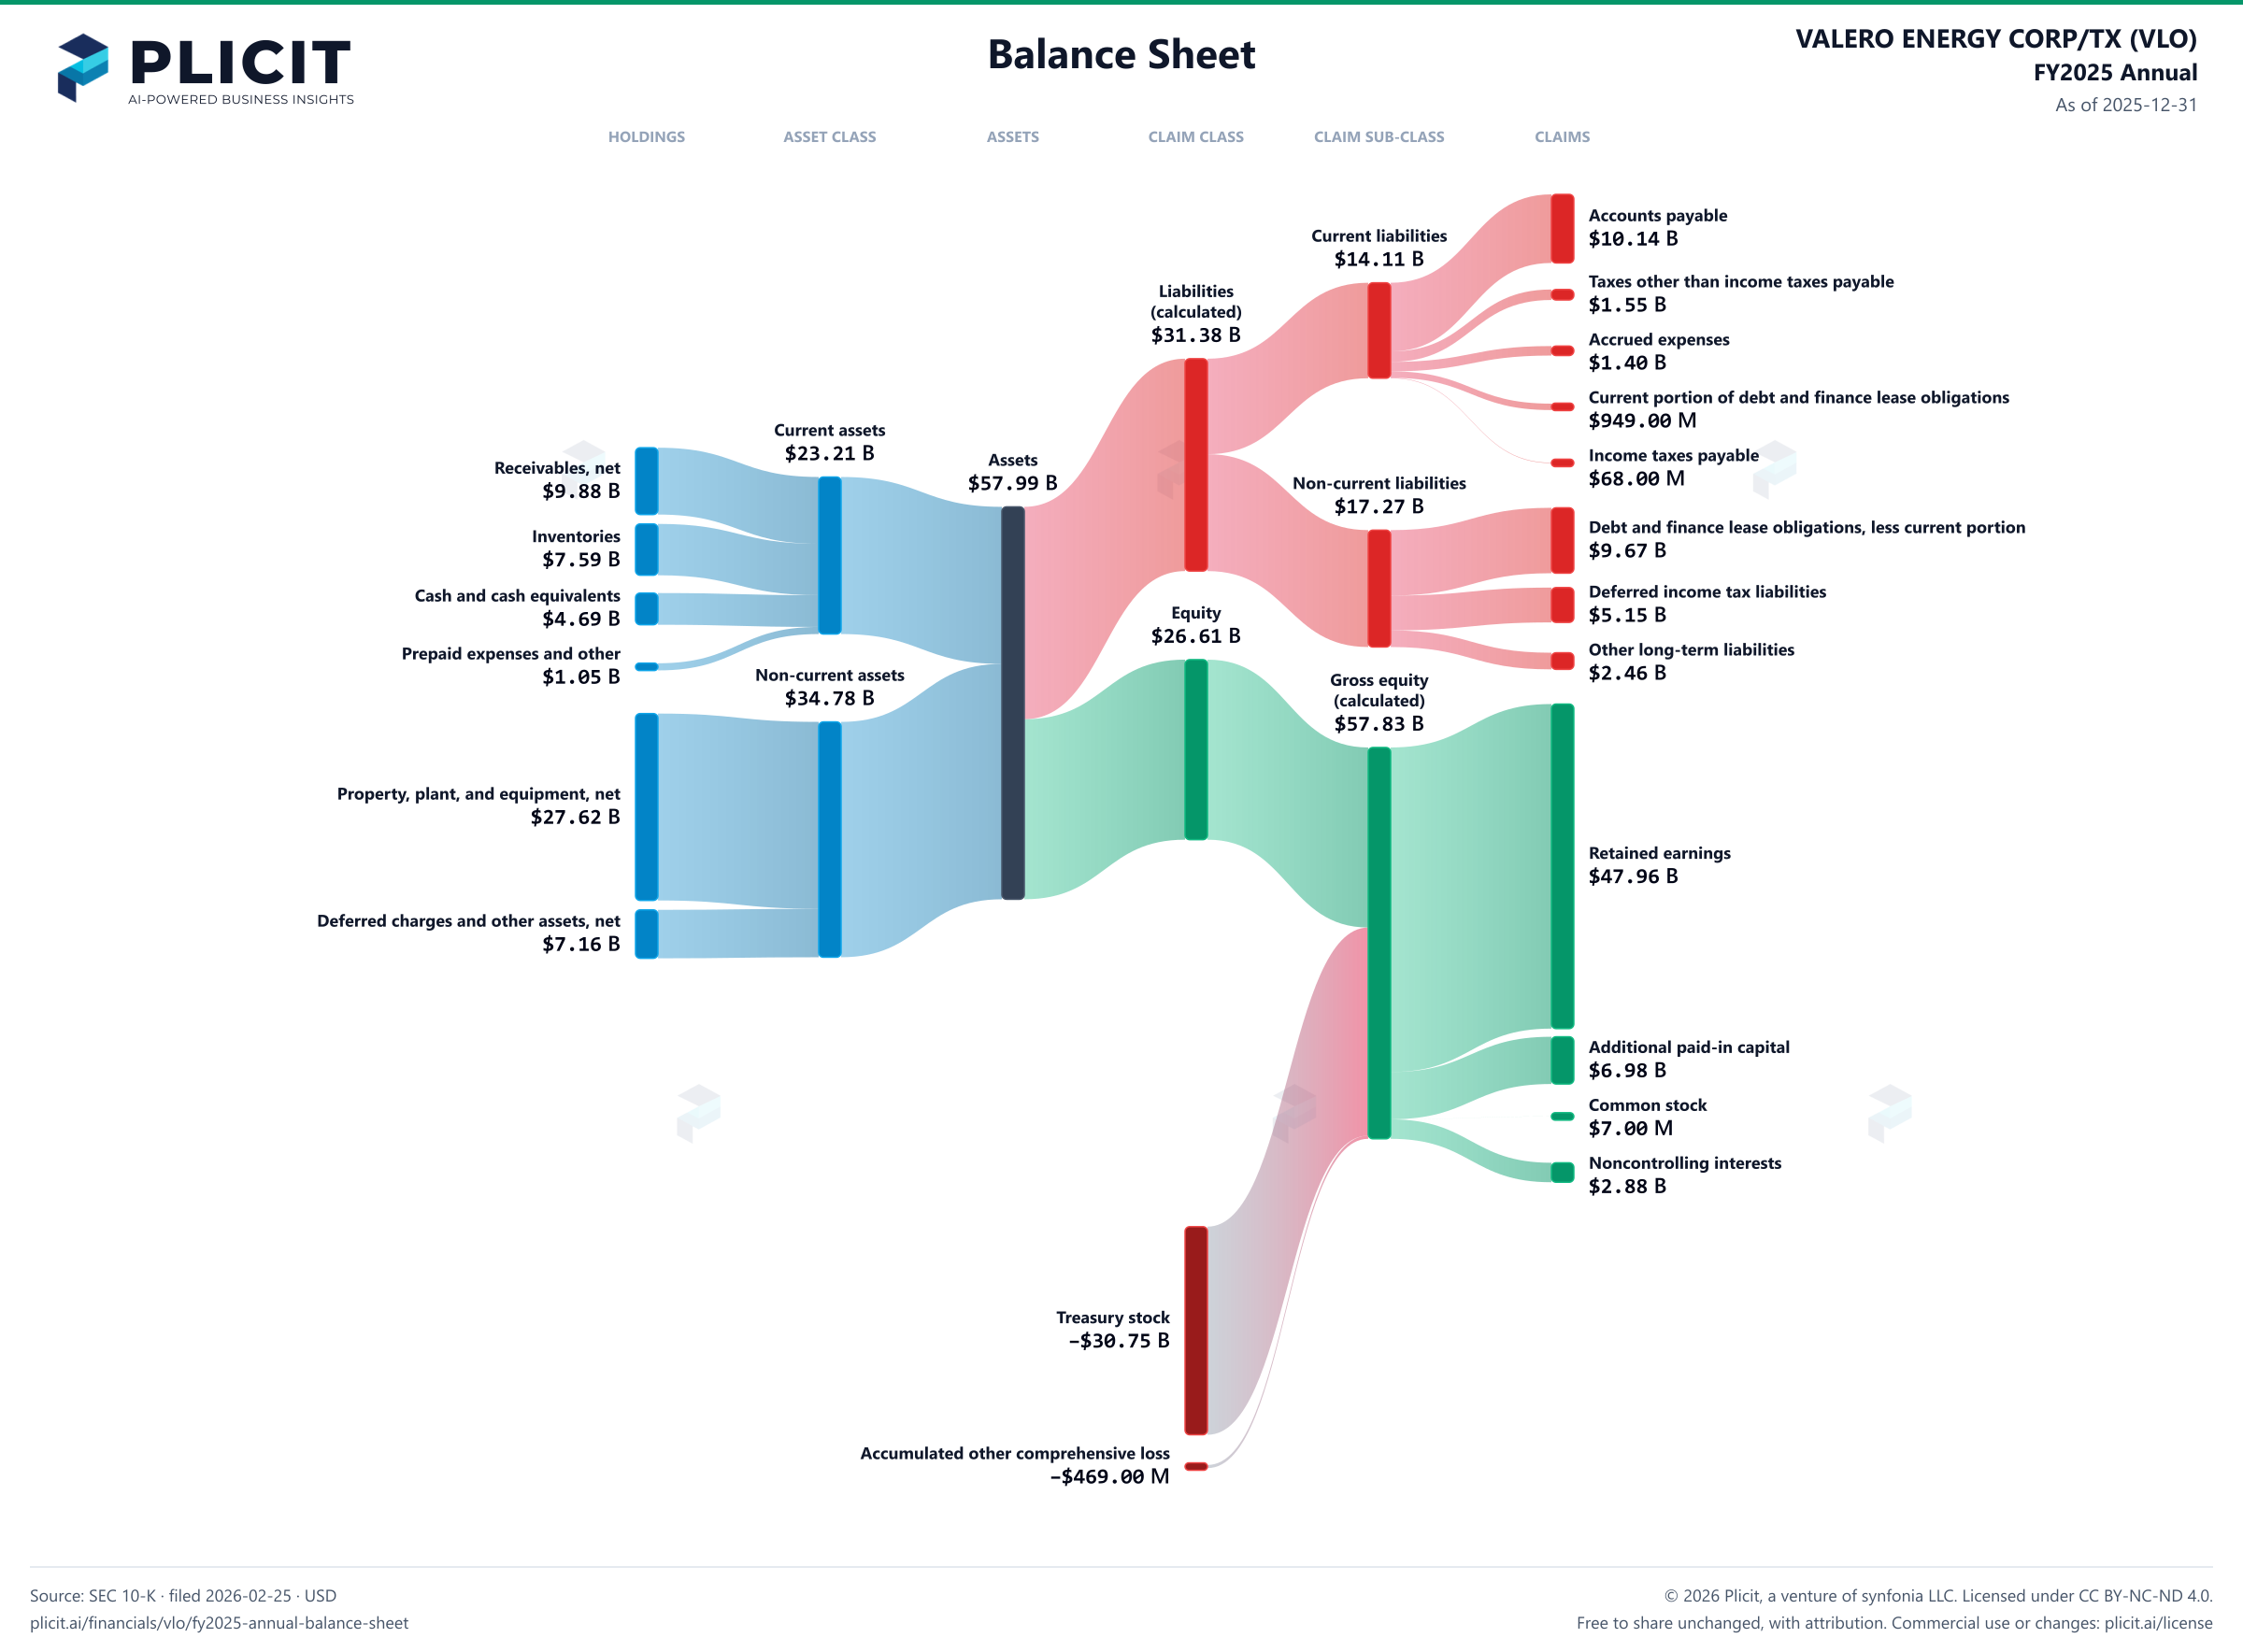
Balance sheet as of 2025-12-31. The chart shows assets, liabilities and equity at that date.
- Assets
- 57,988,000,000 US dollars
- Current assets
- 23,210,000,000 US dollars
- Non-current assets
- 34,778,000,000 US dollars
- Liabilities (calculated)
- 31,383,000,000 US dollars
- Current liabilities
- 14,109,000,000 US dollars
- Non-current liabilities
- 17,274,000,000 US dollars
- Equity
- 26,605,000,000 US dollars
- Noncontrolling interest
- 2,880,000,000 US dollars. Included in consolidated equity; this amount is not added again.
- Property, plant, and equipment, at cost
- 50,091,000,000 US dollars. Part of Property, plant, and equipment, net, drawn as one net amount.
- Accumulated depreciation
- negative 22,474,000,000 US dollars. Part of Property, plant, and equipment, net, drawn as one net amount.
- Receivables, net
- 9,877,000,000 US dollars
- Inventories
- 7,591,000,000 US dollars
- Cash and cash equivalents
- 4,688,000,000 US dollars
- Prepaid expenses and other
- 1,054,000,000 US dollars
- Property, plant, and equipment, net
- 27,617,000,000 US dollars
- Deferred charges and other assets, net
- 7,161,000,000 US dollars
- Accounts payable
- 10,139,000,000 US dollars
- Taxes other than income taxes payable
- 1,550,000,000 US dollars
- Accrued expenses
- 1,403,000,000 US dollars
- Current portion of debt and finance lease obligations
- 949,000,000 US dollars
- Income taxes payable
- 68,000,000 US dollars
- Debt and finance lease obligations, less current portion
- 9,670,000,000 US dollars
- Deferred income tax liabilities
- 5,146,000,000 US dollars
- Other long-term liabilities
- 2,458,000,000 US dollars
- Retained earnings
- 47,959,000,000 US dollars
- Additional paid-in capital
- 6,981,000,000 US dollars
- Common stock, $0.01 par value; 1,200,000,000 shares authorized; 673,501,593 and 673,501,593 shares issued
- 7,000,000 US dollars
- Noncontrolling interests
- 2,880,000,000 US dollars
- Treasury stock, at cost; 374,561,457 and 358,637,890 common shares
- negative 30,753,000,000 US dollars
- Accumulated other comprehensive loss
- negative 469,000,000 US dollars
- Gross equity (calculated)
- 57,827,000,000 US dollars. Net equity plus the magnitudes of its negative contributions equals gross positive equity. The negative contributions enter this reconciliation as add-backs; their filed signs stay negative.
Chart connections
- Assets equal liabilities plus consolidated equity. Consolidated equity includes noncontrolling interests when reported.
- Treasury shares and other negative equity contributions reduce equity.
Free to share unchanged, with credit to Plicit.ai · CC BY-NC-ND 4.0Download PNG
Product waitlist
Health Check and Teardown for your own company
A health check uncovers insights of your private books, not a public ticker. Join this list to get notified as soon as we go-live!