
Verisk Analytics, Inc. (VRSK) FY2026 Q2 Balance Sheet

Balance Sheet

As of 2026-06-30

Swipe to see the full flow
Verisk Analytics, Inc. (VRSK) FY2026 Q2 Balance SheetBalance sheet as of 2026-06-30. The chart shows assets, liabilities and equity at that date.Current liabilities$1.12 BLiabilities$5.68 BNon-current liabilities$4.57 BCurrent assets$1.12 BAssets$4.50 BNon-current assets$3.37 BEquity−$1.19 BHOLDINGSASSET CLASSASSETSCLAIM CLASSCLAIM SUB-CLASSCLAIMSCash and cash equivalentsAccounts receivable, net of allowance for doubtful accounts of $35.9 and $33.2, respectivelyPrepaid expensesIncome taxes receivableOther current assetsGoodwillFixed assets, netOther noncurrent assetsIntangible assets, netOperating lease right-of-use assets, netDeferred income tax assetsDeferred revenuesShort-term debt and current portion of long-term debtAccounts payable and accrued liabilitiesOperating lease liabilitiesIncome taxes payableLong-term debtDeferred income tax liabilitiesOperating lease liabilitiesOther noncurrent liabilitiesRetained earningsAdditional paid-in capitalAccumulated other comprehensive incomeCommon stock, $.001 par value; 2,000,000,000 shares authorized; 544,003,038 shares issued; 130,136,216 and 138,397,709 shares outstanding, respectivelyTreasury stock, at cost, 413,866,822 and 405,605,329 shares, respectivelyCurrent assetsNon-current assetsAssetsCurrent liabilitiesNon-current liabilitiesLiabilitiesEquityDeferred revenuesDeferred revenues$573.90 MCurrent liabilitiesCurrent liabilities$1.12 BShort-term debt and current portion of long-term debtShort-term debt and current portion of long-term debt$257.70 MAccounts payable and accrued liabilitiesAccounts payable and accrued liabilities$254.30 MLiabilitiesLiabilities$5.68 BOperating lease liabilitiesOperating lease liabilities$25.10 MIncome taxes payableIncome taxes payable$5.30 MNon-current liabilitiesNon-current liabilities$4.57 BLong-term debtLong-term debt$4.22 BDeferred income tax liabilitiesDeferred income tax liabilities$202.00 MOperating lease liabilitiesOperating lease liabilities$118.50 MOther noncurrent liabilitiesOther noncurrent liabilities$32.30 MCash and cash equivalentsCash and cash equivalents$551.40 MCurrent assetsCurrent assets$1.12 BAccounts receivable, net of allowance for doubtful accounts of $35.9 and $33.2, respectivelyAccounts receivable, net$400.00 MRetained earningsRetained earnings$8.14 BPrepaid expensesPrepaid expenses$90.90 MAssetsAssets$4.50 BIncome taxes receivableIncome taxes receivable$56.30 MOther current assetsOther current assets$23.80 MNon-current assetsNon-current assets$3.37 BGoodwillGoodwill$1.86 BFixed assets, netFixed assets, net$580.60 MOther noncurrent assetsOther noncurrent assets$455.60 MAdditional paid-in capitalAdditional paid-in capital$2.89 BIntangible assets, netIntangible assets, net$313.50 MOperating lease right-of-use assets, netOperating lease right-of-use assets, net$128.40 MEquityEquity−$1.19 BDeferred income tax assetsDeferred income tax assets$36.20 MAccumulated other comprehensive incomeAccumulated other comprehensive income$82.10 MCommon stock, $.001 par value; 2,000,000,000 shares authorized; 544,003,038 shares issued; 130,136,216 and 138,397,709 shares outstanding, respectivelyCommon stock$100.00 KTreasury stock, at cost, 413,866,822 and 405,605,329 shares, respectivelyTreasury stock−$12.30 B
Chart details

Verisk Analytics, Inc. (VRSK) FY2026 Q2 Balance Sheet

Balance sheet as of 2026-06-30. The chart shows assets, liabilities and equity at that date.

Assets
4,495,900,000 US dollars
Current assets
1,122,400,000 US dollars
Non-current assets
3,373,500,000 US dollars
Liabilities
5,684,900,000 US dollars
Current liabilities
1,116,300,000 US dollars
Non-current liabilities
4,568,600,000 US dollars
Equity
negative 1,189,000,000 US dollars
Noncontrolling interest
0 US dollars. Included in consolidated equity; this amount is not added again.
Cash and cash equivalents
551,400,000 US dollars
Accounts receivable, net of allowance for doubtful accounts of $35.9 and $33.2, respectively
400,000,000 US dollars
Prepaid expenses
90,900,000 US dollars
Income taxes receivable
56,300,000 US dollars
Other current assets
23,800,000 US dollars
Goodwill
1,859,200,000 US dollars
Fixed assets, net
580,600,000 US dollars
Other noncurrent assets
455,600,000 US dollars
Intangible assets, net
313,500,000 US dollars
Operating lease right-of-use assets, net
128,400,000 US dollars
Deferred income tax assets
36,200,000 US dollars
Deferred revenues
573,900,000 US dollars
Short-term debt and current portion of long-term debt
257,700,000 US dollars
Accounts payable and accrued liabilities
254,300,000 US dollars
Operating lease liabilities
25,100,000 US dollars
Income taxes payable
5,300,000 US dollars
Long-term debt
4,215,800,000 US dollars
Deferred income tax liabilities
202,000,000 US dollars
Operating lease liabilities
118,500,000 US dollars
Other noncurrent liabilities
32,300,000 US dollars
Retained earnings
8,142,700,000 US dollars
Additional paid-in capital
2,887,800,000 US dollars
Accumulated other comprehensive income
82,100,000 US dollars
Common stock, $.001 par value; 2,000,000,000 shares authorized; 544,003,038 shares issued; 130,136,216 and 138,397,709 shares outstanding, respectively
100,000 US dollars
Noncontrolling interests
0 US dollars
Treasury stock, at cost, 413,866,822 and 405,605,329 shares, respectively
negative 12,301,700,000 US dollars

Chart connections

  • Assets equal liabilities plus consolidated equity. Consolidated equity includes noncontrolling interests when reported.
  • Treasury shares and other negative equity contributions reduce equity.
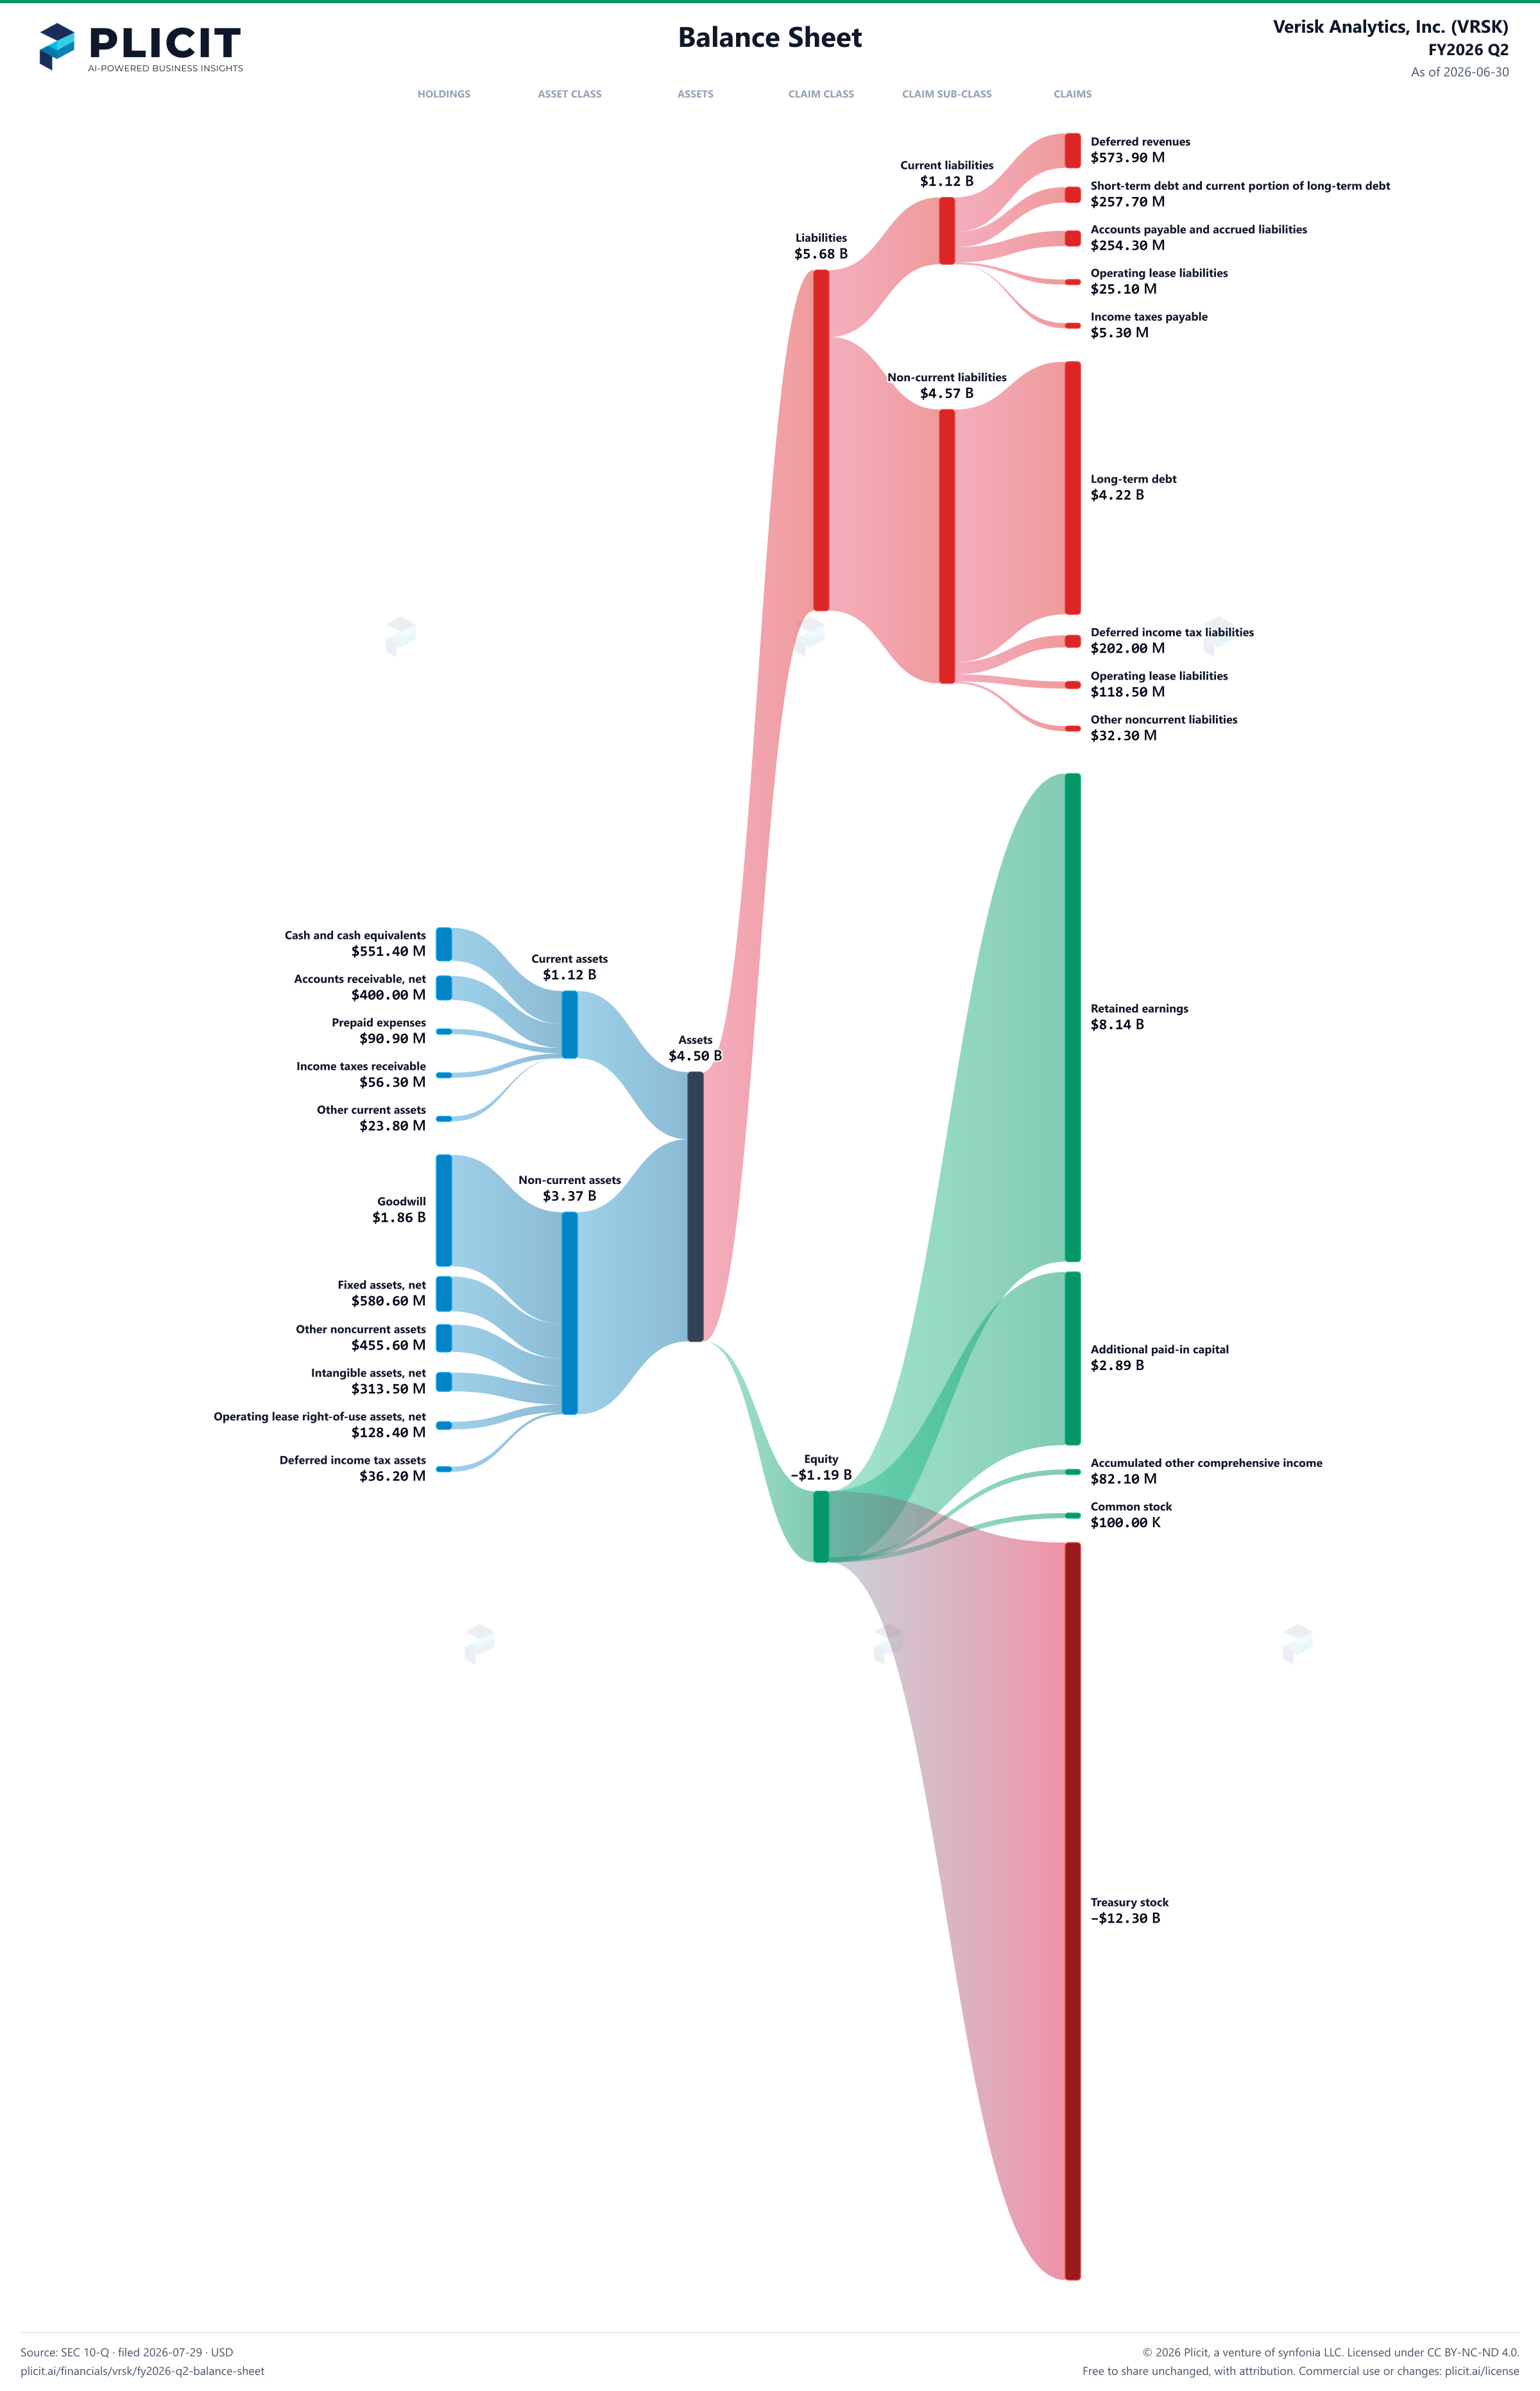
Verisk Analytics, Inc. (VRSK) FY2026 Q2 Balance Sheet Sankey chart
Free to share unchanged, with credit to Plicit.ai · CC BY-NC-ND 4.0Download PNG

Newsletter

Get the teardowns by email

Subscribe if you want the public-company teardowns in your inbox when they're released.

Product waitlist

Health Check and Teardown for your own company

A health check uncovers insights of your private books, not a public ticker. Join this list to get notified as soon as we go-live!