
Vertiv Holdings Co (VRT) FY2025 Q2 P&L / Income Statement

2025-04-01 to 2025-06-30

Swipe to see the full flow
Vertiv Holdings Co (VRT) FY2025 Q2 P&L / Income StatementIncome statement for 2025-04-01 through 2025-06-30. View: Segments by Timing of Transfer of Good or Service. Revenue uses this breakdown; costs and expenses retain the consolidated categories.SOURCESREVENUEGROSSOPERATINGPRE-TAXNETAmericas - Products and services transferred at a point in timeAsia Pacific - Products and services transferred at a point in timeEurope, Middle East, & Africa - Products and services transferred at a point in timeAmericas - Products and services transferred over timeAsia Pacific - Products and services transferred over timeEurope, Middle East, & Africa - Products and services transferred over timeNet salesGross profit (calculated)Cost of salesOperating profit (loss)Operating costs, including other operating expenses (calculated)Selling, general and administrative expensesAmortization of intangiblesForeign currency (gain) loss, netRestructuring costsOther operating expense (income)Income (loss) before income taxesOther income (expense), net (calculated)Net income (loss)Income tax expense (benefit)Gross profit (calculated)Gross profit(calculated)$896.60 MIncome (loss) before income taxesIncome (loss)before income taxes$421.10 MNet salesNet sales$2.64 BOperating profit (loss)Operating profit (loss)$442.40 MNet income (loss)Net income (loss)$324.20 MAmericas - Products and services transferred at a point in timeAmericas - Products and servicestransferred at a point in time$1.36 BOperating costs, including other operating expenses (calculated)Operating costs(calculated)$454.20 MIncome tax expense (benefit)Income taxexpense (benefit)$96.90 MSelling, general and administrative expensesSelling, general andadministrative expenses$395.60 MCost of salesCost of sales$1.74 BOther income (expense), net (calculated)Other income,net (calculated)−$21.30 MAsia Pacific - Products and services transferred at a point in timeAsia Pacific - Products and servicestransferred at a point in time$425.20 MAmortization of intangiblesAmortization of intangibles$46.90 MEurope, Middle East, & Africa - Products and services transferred at a point in timeEurope, Middle East, & Africa- Products and servicestransferred at a point in time$346.20 MForeign currency (gain) loss, netForeign currency (gain) loss, net$2.30 MRestructuring costsRestructuring costs$1.90 MAmericas - Products and services transferred over timeAmericas - Products andservices transferred over time$245.90 MOther operating expense (income)Other operating expense (income)$7.50 MAsia Pacific - Products and services transferred over timeAsia Pacific - Products andservices transferred over time$135.00 MEurope, Middle East, & Africa - Products and services transferred over timeEurope, Middle East, & Africa- Products and servicestransferred over time$129.40 M
Chart details

Vertiv Holdings Co (VRT) FY2025 Q2 P&L / Income Statement

Income statement for 2025-04-01 through 2025-06-30. View: Segments by Timing of Transfer of Good or Service. Revenue uses this breakdown; costs and expenses retain the consolidated categories.

Net sales
2,638,100,000 US dollars
Cost of sales
1,741,500,000 US dollars
Gross profit (calculated)
896,600,000 US dollars
Operating costs, including other operating expenses (calculated)
454,200,000 US dollars
Operating profit (loss)
442,400,000 US dollars
Other income (expense), net (calculated)
negative 21,300,000 US dollars
Income (loss) before income taxes
421,100,000 US dollars
Income tax expense (benefit)
96,900,000 US dollars
Net income (loss)
324,200,000 US dollars
Americas - Products and services transferred at a point in time
1,356,400,000 US dollars
Americas - Products and services transferred over time
245,900,000 US dollars
Asia Pacific - Products and services transferred at a point in time
425,200,000 US dollars
Asia Pacific - Products and services transferred over time
135,000,000 US dollars
Europe, Middle East, & Africa - Products and services transferred at a point in time
346,200,000 US dollars
Europe, Middle East, & Africa - Products and services transferred over time
129,400,000 US dollars
Restructuring costs
1,900,000 US dollars
Amortization of intangibles
46,900,000 US dollars
Selling, general and administrative expenses
395,600,000 US dollars
Foreign currency (gain) loss, net
2,300,000 US dollars
Other operating expense (income)
7,500,000 US dollars

Chart connections

  • Revenue less cost of revenue equals gross profit; gross profit less operating expenses equals operating income.
  • Operating income plus other income or expense equals income before tax. Income before tax less income tax expense or benefit equals net income.
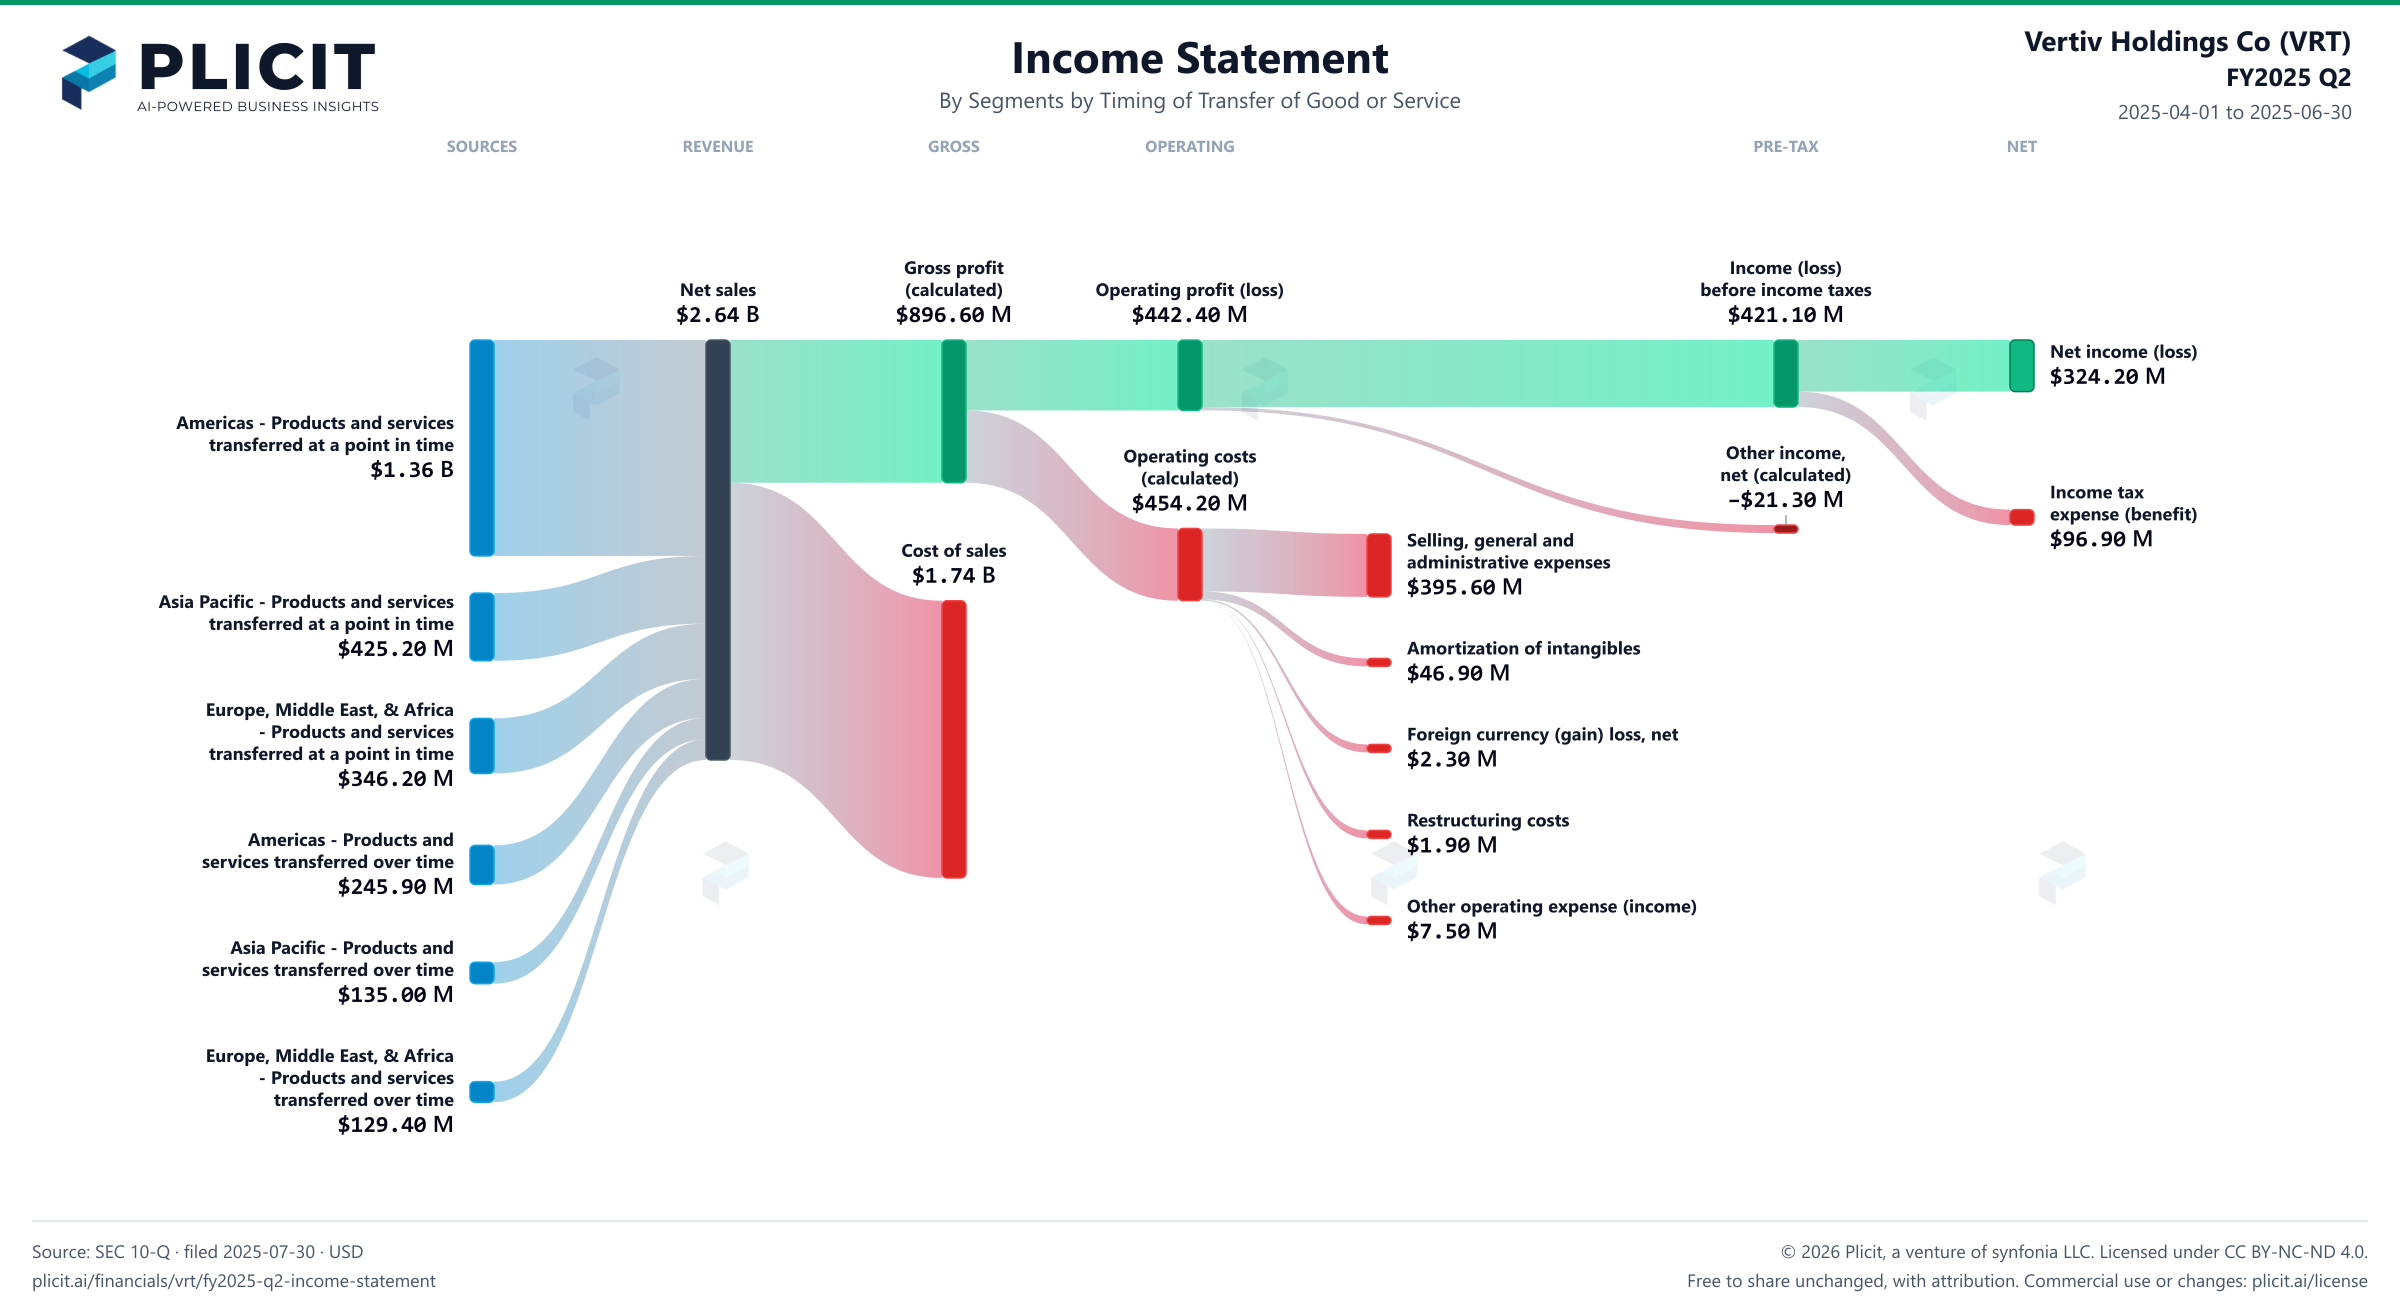
Vertiv Holdings Co (VRT) FY2025 Q2 Revenue by Business Segment by Timing of Transfer Sankey chart
Free to share unchanged, with credit to Plicit.ai · CC BY-NC-ND 4.0Download PNG

Gross margin

34.0%

Gross profit / revenue

Operating margin

16.8%

Operating profit / revenue

Cash conversion

99.6%

Operating cash / net income, same period

Newsletter

Get the teardowns by email

Subscribe if you want the public-company teardowns in your inbox when they're released.

Product waitlist

Health Check and Teardown for your own company

A health check uncovers insights of your private books, not a public ticker. Join this list to get notified as soon as we go-live!