
Verizon Communications Inc. (VZ) FY2023 Annual Balance Sheet
As of 2023-12-31
Balance Sheet
As of 2023-12-31
Swipe to see the full flow
Chart details
Verizon Communications Inc. (VZ) FY2023 Annual Balance Sheet
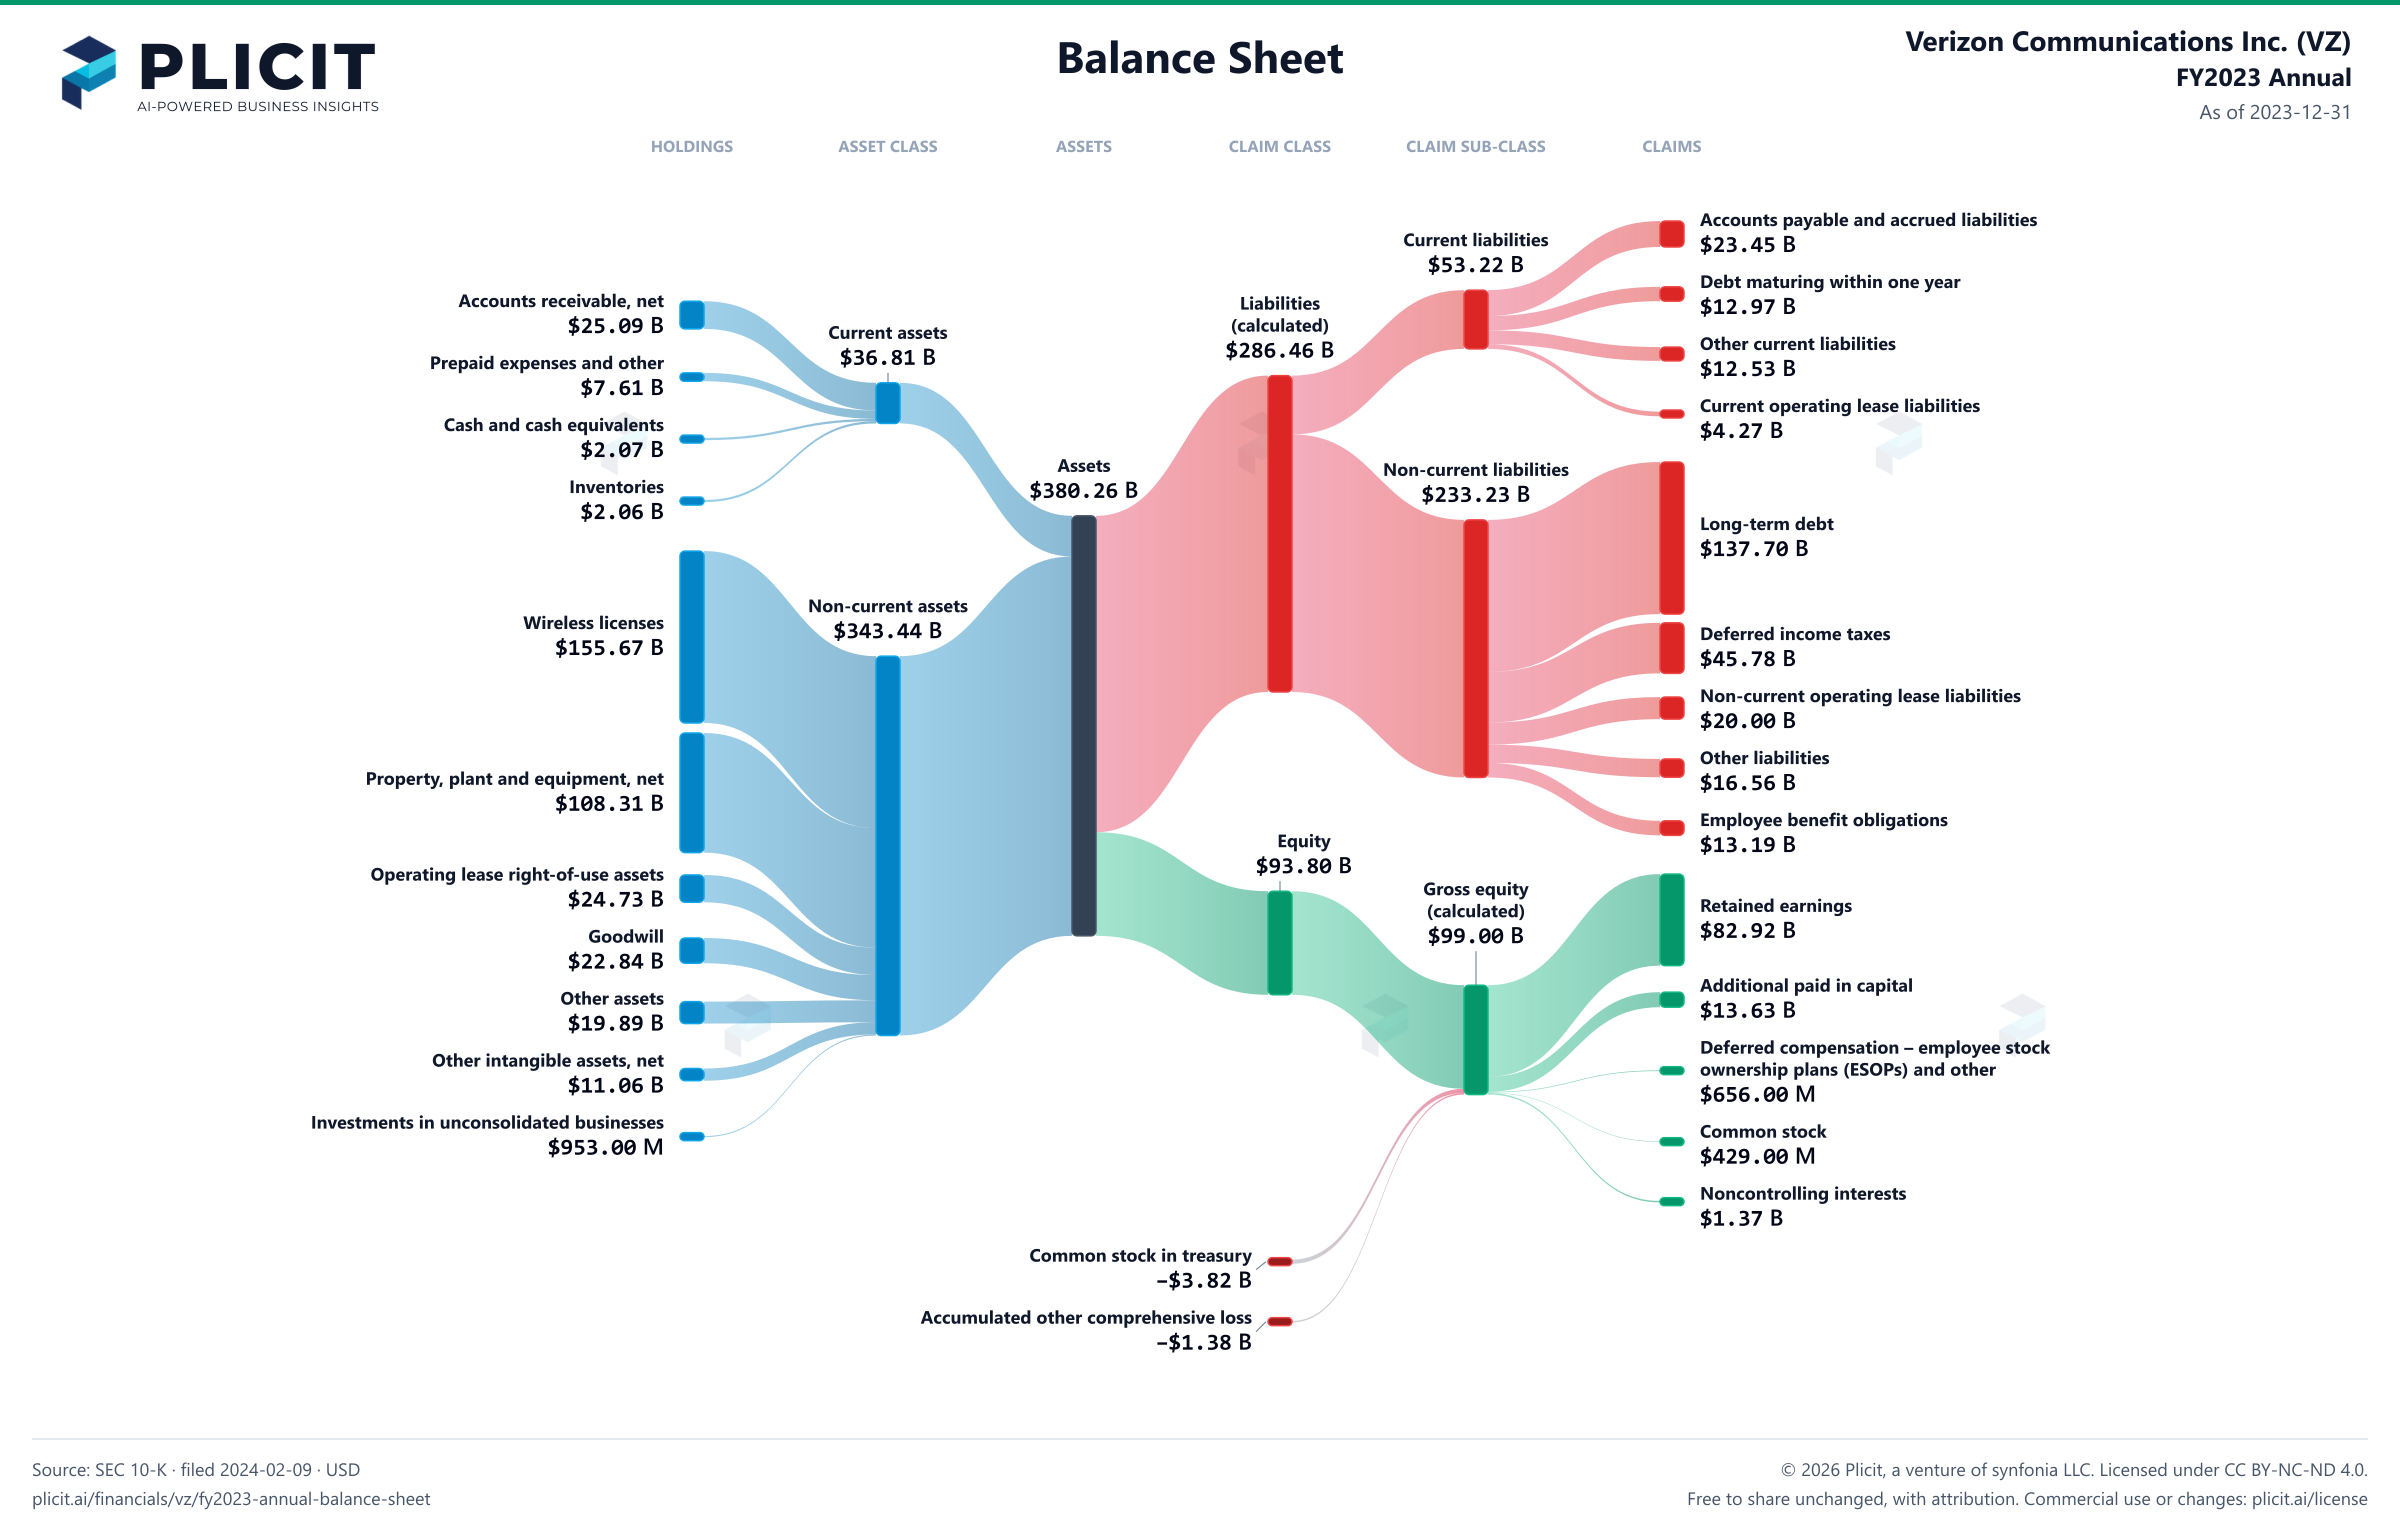
Balance sheet as of 2023-12-31. The chart shows assets, liabilities and equity at that date.
- Assets
- 380,255,000,000 US dollars
- Current assets
- 36,814,000,000 US dollars
- Non-current assets
- 343,441,000,000 US dollars
- Liabilities (calculated)
- 286,456,000,000 US dollars
- Current liabilities
- 53,223,000,000 US dollars
- Non-current liabilities
- 233,233,000,000 US dollars
- Equity
- 93,799,000,000 US dollars
- Noncontrolling interest
- 1,369,000,000 US dollars. Included in consolidated equity; this amount is not added again.
- Accounts receivable
- 26,102,000,000 US dollars. Part of Accounts receivable, net, drawn as one net amount.
- Less Allowance for credit losses
- negative 1,017,000,000 US dollars. Part of Accounts receivable, net, drawn as one net amount.
- Property, plant and equipment
- 320,108,000,000 US dollars. Part of Property, plant and equipment, net, drawn as one net amount.
- Less Accumulated depreciation
- negative 211,798,000,000 US dollars. Part of Property, plant and equipment, net, drawn as one net amount.
- Accounts receivable, net
- 25,085,000,000 US dollars
- Prepaid expenses and other
- 7,607,000,000 US dollars
- Cash and cash equivalents
- 2,065,000,000 US dollars
- Inventories
- 2,057,000,000 US dollars
- Wireless licenses
- 155,667,000,000 US dollars
- Property, plant and equipment, net
- 108,310,000,000 US dollars
- Operating lease right-of-use assets
- 24,726,000,000 US dollars
- Goodwill
- 22,843,000,000 US dollars
- Other assets
- 19,885,000,000 US dollars
- Other intangible assets, net
- 11,057,000,000 US dollars
- Investments in unconsolidated businesses
- 953,000,000 US dollars
- Accounts payable and accrued liabilities
- 23,453,000,000 US dollars
- Debt maturing within one year
- 12,973,000,000 US dollars
- Other current liabilities
- 12,531,000,000 US dollars
- Current operating lease liabilities
- 4,266,000,000 US dollars
- Long-term debt
- 137,701,000,000 US dollars
- Deferred income taxes
- 45,781,000,000 US dollars
- Non-current operating lease liabilities
- 20,002,000,000 US dollars
- Other liabilities
- 16,560,000,000 US dollars
- Employee benefit obligations
- 13,189,000,000 US dollars
- Retained earnings
- 82,915,000,000 US dollars
- Additional paid in capital
- 13,631,000,000 US dollars
- Deferred compensation – employee stock ownership plans (ESOPs) and other
- 656,000,000 US dollars
- Common stock ($0.10 par value; 6,250,000,000 shares authorized in each period; 4,291,433,646 shares issued in each period)
- 429,000,000 US dollars
- Series preferred stock ($0.10 par value; 250,000,000 shares authorized; none issued)
- 0 US dollars
- Noncontrolling interests
- 1,369,000,000 US dollars
- Common stock in treasury, at cost (87,172,997 and 91,572,258 shares outstanding)
- negative 3,821,000,000 US dollars
- Accumulated other comprehensive loss
- negative 1,380,000,000 US dollars
- Gross equity (calculated)
- 99,000,000,000 US dollars. Net equity plus the magnitudes of its negative contributions equals gross positive equity. The negative contributions enter this reconciliation as add-backs; their filed signs stay negative.
Chart connections
- Assets equal liabilities plus consolidated equity. Consolidated equity includes noncontrolling interests when reported.
- Treasury shares and other negative equity contributions reduce equity.
Free to share unchanged, with credit to Plicit.ai · CC BY-NC-ND 4.0Download PNG
Product waitlist
Health Check and Teardown for your own company
A health check uncovers insights of your private books, not a public ticker. Join this list to get notified as soon as we go-live!