
THE WENDY’S COMPANY (WEN) FY2026 Q2 Balance Sheet

Balance Sheet

As of 2026-06-28

Swipe to see the full flow
THE WENDY’S COMPANY (WEN) FY2026 Q2 Balance SheetBalance sheet as of 2026-06-28. The chart shows assets, liabilities and equity at that date.Current liabilities$357.47 MLiabilities$4.76 BCurrent assets$678.10 MNon-current liabilities$4.41 BAssets$4.88 BNon-current assets$4.21 BEquity$120.47 MGross equity(calculated)$3.47 BHOLDINGSASSET CLASSASSETSCLAIM CLASSCLAIM SUB-CLASSCLAIMSCash and cash equivalentsAccounts and notes receivable, netAdvertising funds restricted assetsPrepaid expenses and other current assetsRestricted cashInventoriesOther intangible assetsPropertiesGoodwillOperating lease assetsFinance lease assetsNet investment in sales-type and direct financing leasesOther assetsInvestmentsAccrued expenses and other current liabilitiesAdvertising funds restricted liabilitiesCurrent portion of operating lease liabilitiesCurrent portion of long-term debtCurrent portion of finance lease liabilitiesAccounts payableLong-term debtLong-term finance lease liabilitiesLong-term operating lease liabilitiesDeferred income taxesDeferred franchise feesOther liabilitiesAdditional paid-in capitalRetained earningsCommon stock, $0.10 par value; 1,500,000 shares authorized; 470,424 shares issued; 190,639 and 190,324 shares outstanding, respectivelyCurrent assetsNon-current assetsAssetsCurrent liabilitiesNon-current liabilitiesLiabilitiesEquityGross equity (calculated)Common stock held in treasury, at cost; 279,785 and 280,100 shares, respectivelyAccumulated other comprehensive lossAccrued expenses and other current liabilitiesAccrued expenses and other current liabilities$124.71 MAdvertising funds restricted liabilitiesAdvertising funds restricted liabilities$102.08 MCurrent liabilitiesCurrent liabilities$357.47 MCurrent portion of operating lease liabilitiesCurrent portion of operating lease liabilities$51.95 MCurrent portion of long-term debtCurrent portion of long-term debt$29.75 MCash and cash equivalentsCash and cash equivalents$341.21 MLiabilitiesLiabilities$4.76 BCurrent portion of finance lease liabilitiesCurrent portion of finance lease liabilities$27.54 MAccounts and notes receivable, netAccounts and notes receivable, net$109.25 MCurrent assetsCurrent assets$678.10 MAccounts payableAccounts payable$21.44 MAdvertising funds restricted assetsAdvertising funds restricted assets$102.90 MPrepaid expenses and other current assetsPrepaid expenses and other current assets$78.92 MNon-current liabilitiesNon-current liabilities$4.41 BAssetsAssets$4.88 BRestricted cashRestricted cash$38.79 MLong-term debtLong-term debt$2.72 BInventoriesInventories$7.04 MOther intangible assetsOther intangible assets$1.15 BNon-current assetsNon-current assets$4.21 BLong-term finance lease liabilitiesLong-term finance lease liabilities$647.64 MLong-term operating lease liabilitiesLong-term operating lease liabilities$596.41 MPropertiesProperties$895.60 MDeferred income taxesDeferred income taxes$289.27 MGoodwillGoodwill$773.12 MDeferred franchise feesDeferred franchise fees$81.67 MEquityEquity$120.47 MOperating lease assetsOperating lease assets$582.63 MOther liabilitiesOther liabilities$72.05 MGross equity (calculated)Gross equity(calculated)$3.47 BFinance lease assetsFinance lease assets$319.81 MNet investment in sales-type and direct financing leasesNet investment in sales-type and direct financing leases$276.85 MOther assetsOther assets$187.89 MAdditional paid-in capitalAdditional paid-in capital$2.99 BInvestmentsInvestments$22.99 MRetained earningsRetained earnings$437.10 MCommon stock, $0.10 par value; 1,500,000 shares authorized; 470,424 shares issued; 190,639 and 190,324 shares outstanding, respectivelyCommon stock$47.04 MCommon stock held in treasury, at cost; 279,785 and 280,100 shares, respectivelyCommon stock held in treasury−$3.28 BAccumulated other comprehensive lossAccumulated other comprehensive loss−$70.75 M
Chart details

THE WENDY’S COMPANY (WEN) FY2026 Q2 Balance Sheet

Balance sheet as of 2026-06-28. The chart shows assets, liabilities and equity at that date.

Assets
4,884,216,000 US dollars
Current assets
678,099,000 US dollars
Non-current assets
4,206,117,000 US dollars
Liabilities
4,763,749,000 US dollars
Current liabilities
357,472,000 US dollars
Non-current liabilities
4,406,277,000 US dollars
Equity
120,467,000 US dollars
Cash and cash equivalents
341,211,000 US dollars
Accounts and notes receivable, net
109,247,000 US dollars
Advertising funds restricted assets
102,897,000 US dollars
Prepaid expenses and other current assets
78,922,000 US dollars
Restricted cash
38,786,000 US dollars
Inventories
7,036,000 US dollars
Other intangible assets
1,147,228,000 US dollars
Properties
895,598,000 US dollars
Goodwill
773,119,000 US dollars
Operating lease assets
582,630,000 US dollars
Finance lease assets
319,808,000 US dollars
Net investment in sales-type and direct financing leases
276,853,000 US dollars
Other assets
187,893,000 US dollars
Investments
22,988,000 US dollars
Accrued expenses and other current liabilities
124,713,000 US dollars
Advertising funds restricted liabilities
102,078,000 US dollars
Current portion of operating lease liabilities
51,953,000 US dollars
Current portion of long-term debt
29,750,000 US dollars
Current portion of finance lease liabilities
27,538,000 US dollars
Accounts payable
21,440,000 US dollars
Long-term debt
2,719,239,000 US dollars
Long-term finance lease liabilities
647,637,000 US dollars
Long-term operating lease liabilities
596,408,000 US dollars
Deferred income taxes
289,268,000 US dollars
Deferred franchise fees
81,671,000 US dollars
Other liabilities
72,054,000 US dollars
Additional paid-in capital
2,990,095,000 US dollars
Retained earnings
437,099,000 US dollars
Common stock, $0.10 par value; 1,500,000 shares authorized; 470,424 shares issued; 190,639 and 190,324 shares outstanding, respectively
47,042,000 US dollars
Common stock held in treasury, at cost; 279,785 and 280,100 shares, respectively
negative 3,283,017,000 US dollars
Accumulated other comprehensive loss
negative 70,752,000 US dollars
Gross equity (calculated)
3,474,236,000 US dollars. Net equity plus the magnitudes of its negative contributions equals gross positive equity. The negative contributions enter this reconciliation as add-backs; their filed signs stay negative.

Chart connections

  • Assets equal liabilities plus consolidated equity. Consolidated equity includes noncontrolling interests when reported.
  • Treasury shares and other negative equity contributions reduce equity.
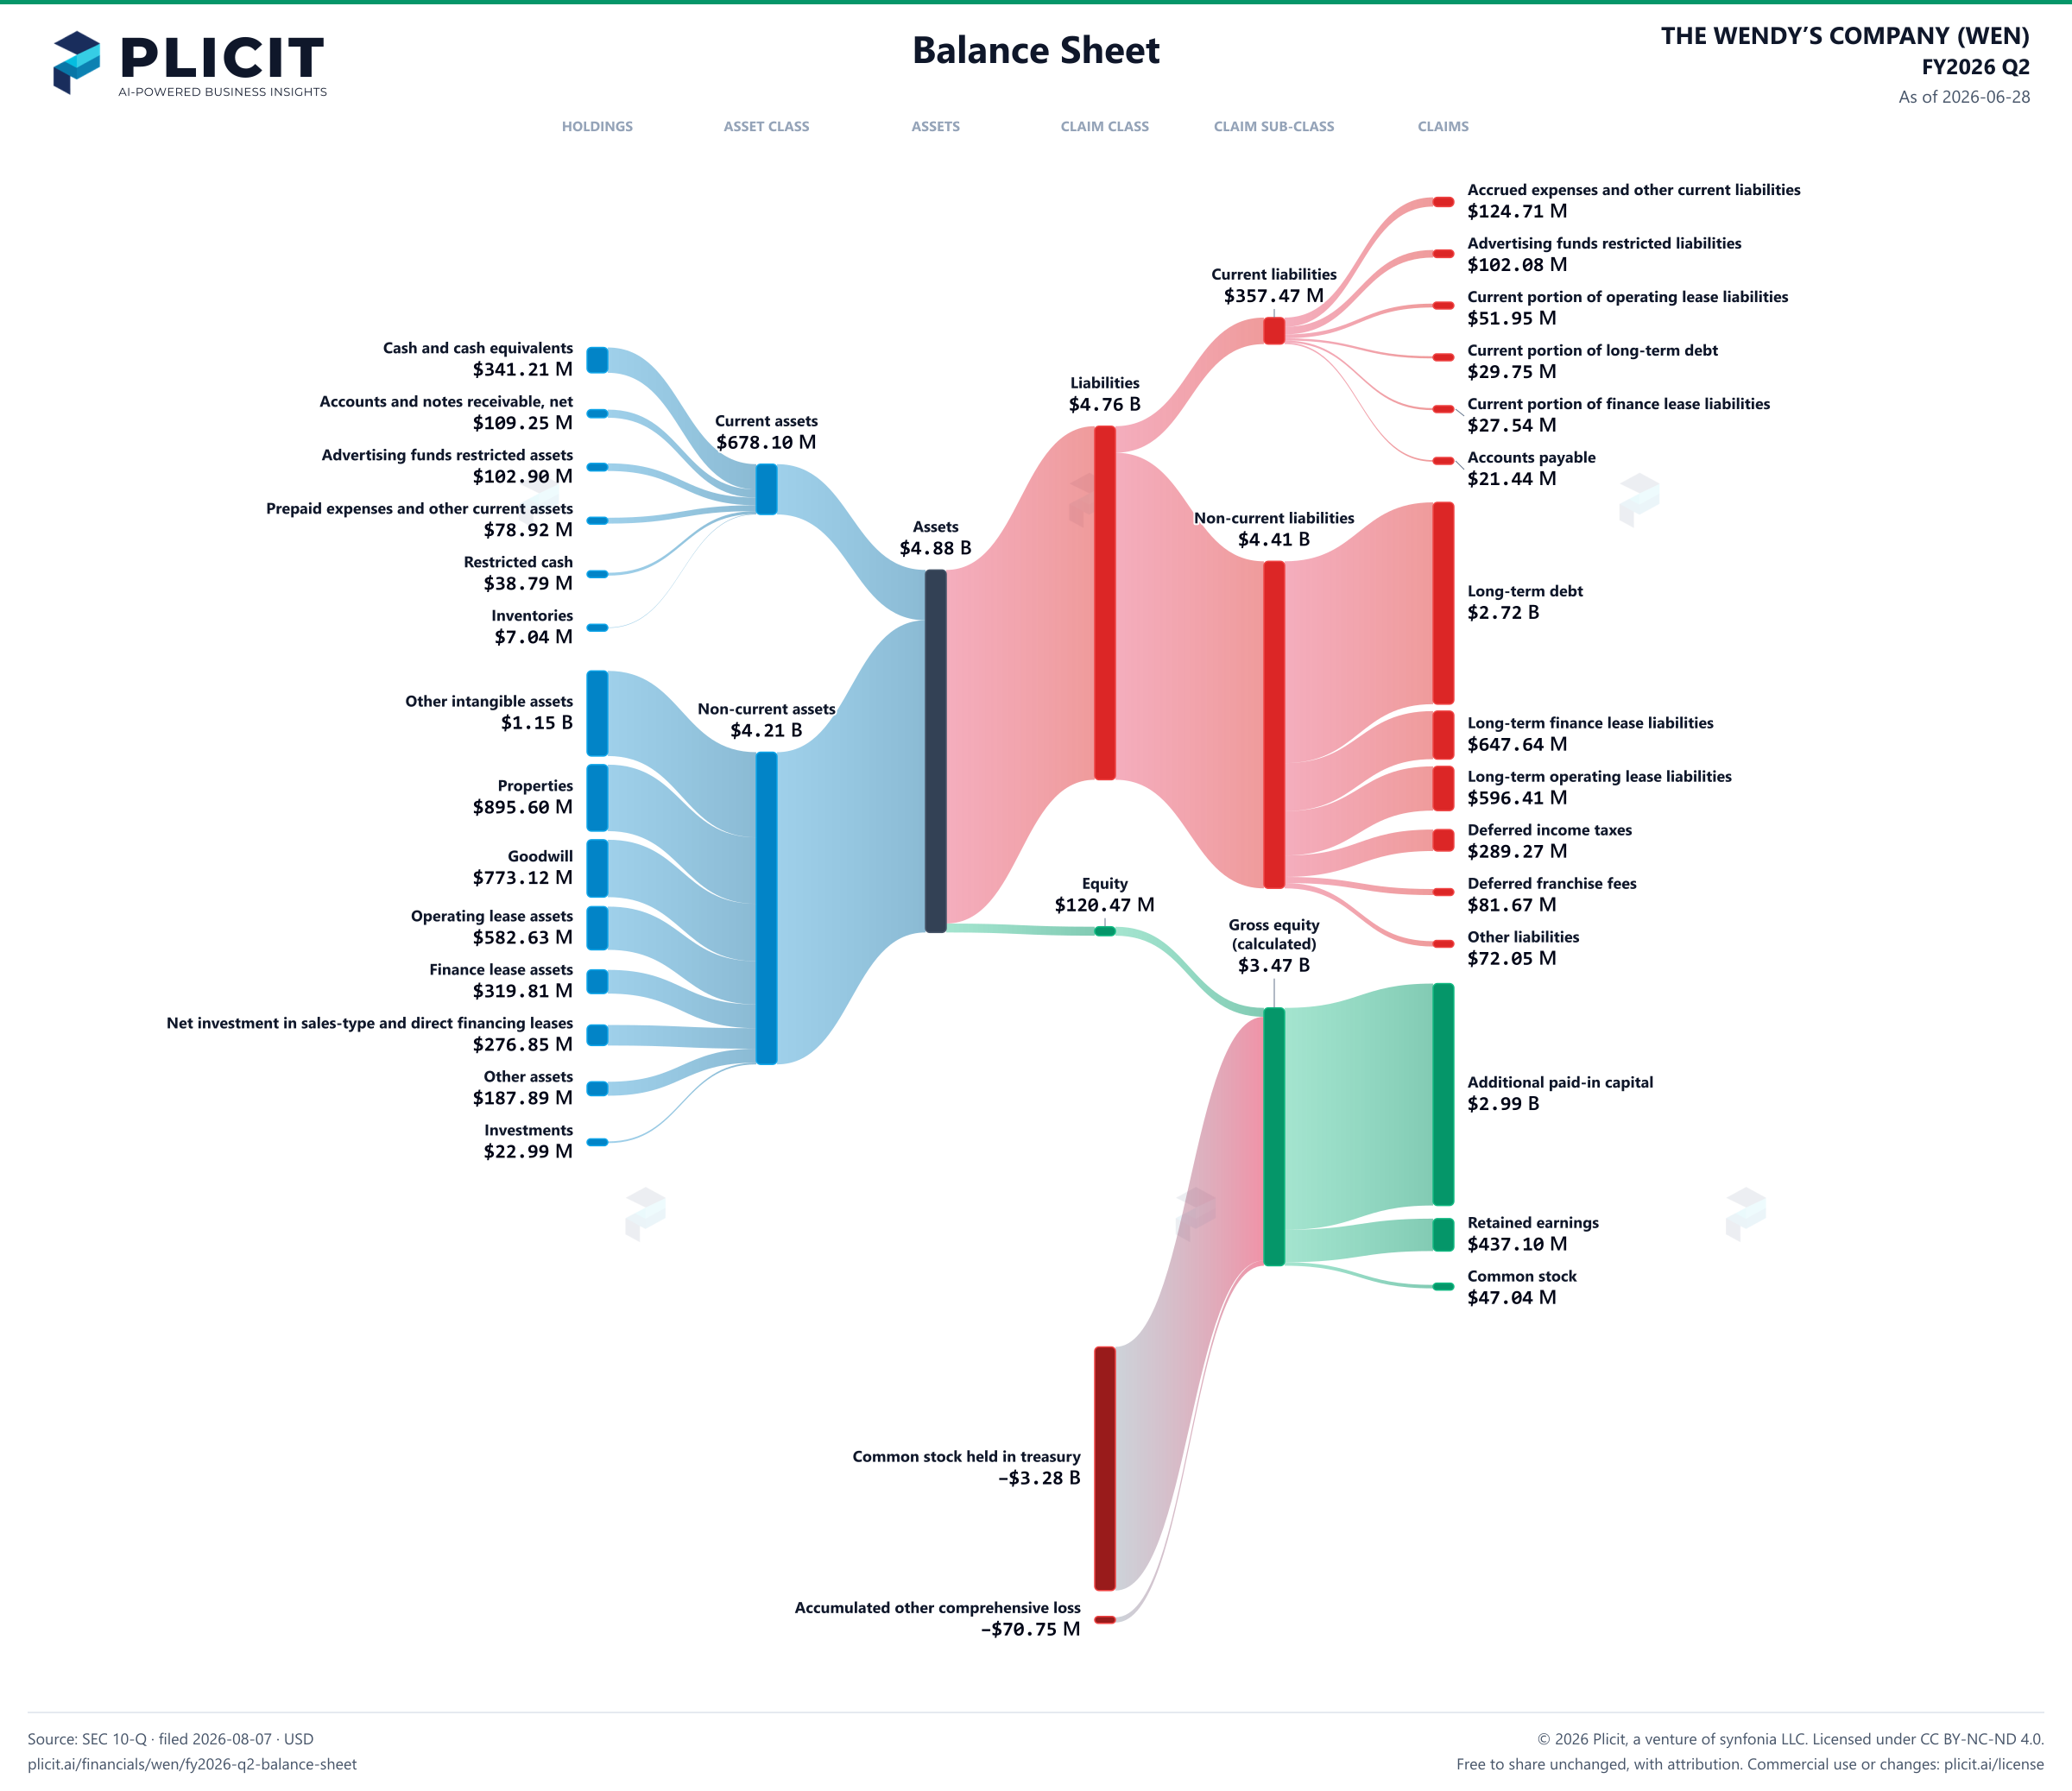
THE WENDY’S COMPANY (WEN) FY2026 Q2 Balance Sheet Sankey chart
Free to share unchanged, with credit to Plicit.ai · CC BY-NC-ND 4.0Download PNG

Newsletter

Get the teardowns by email

Subscribe if you want the public-company teardowns in your inbox when they're released.

Product waitlist

Health Check and Teardown for your own company

A health check uncovers insights of your private books, not a public ticker. Join this list to get notified as soon as we go-live!