
THE WENDY’S COMPANY (WEN) FY2026 YTD Q2 P&L / Income Statement

Revenue by Business Segment by Product and Service

2025-12-29 to 2026-06-28

Swipe to see the full flow
THE WENDY’S COMPANY (WEN) FY2026 YTD Q2 P&L / Income StatementIncome statement for 2025-12-29 through 2026-06-28. View: Segments by Product and Service. Revenue uses this breakdown; costs and expenses retain the consolidated categories.SOURCESREVENUEGROSSOPERATINGPRE-TAXNETWendy's U.S. - SalesWendy's U.S. - Advertising funds revenueWendy's U.S. - Franchise royalty revenueGlobal Real Estate & Development - Franchise rental incomeWendy's U.S. - Franchise feesWendy's International - Franchise royalty revenueWendy's International - Advertising funds revenueWendy's International - SalesWendy's International - Franchise feesGlobal Real Estate & Development - Franchise feesRevenuesGross profit (calculated)Cost of salesOperating profitOperating expenses (calculated)Advertising funds expenseGeneral and Administrative ExpenseDepreciation and amortization (exclusive of amortization of cloud computing arrangements shown separately below)Franchise rental expenseAmortization of cloud computing arrangementsImpairment of long-lived assetsSystem optimization gains, netReorganization and realignment costsFranchise support and other costsOther operating income, netIncome before income taxesOther income (expense), net (calculated)Net incomeProvision for income taxesGross profit (calculated)Gross profit(calculated)$702.88 MRevenuesRevenues$1.11 BOperating profitOperating profit$144.21 MIncome before income taxesPretax income$82.73 MNet incomeNet income$55.33 MWendy's U.S. - SalesWendy's U.S. - Sales$453.30 MOperating expenses (calculated)Operating expenses(calculated)$558.68 MProvision for income taxesProvision forincome taxes$27.40 MOther income (expense), net (calculated)Other income,net (calculated)−$61.47 MAdvertising funds expenseAdvertising funds expense$236.49 MWendy's U.S. - Advertising funds revenueWendy's U.S. - Advertisingfunds revenue$216.99 MGeneral and Administrative ExpenseGeneral andAdministrative Expense$139.00 MCost of salesCost of sales$408.32 MWendy's U.S. - Franchise royalty revenueWendy's U.S. - Franchiseroyalty revenue$201.06 MDepreciation and amortization (exclusive of amortization of cloud computing arrangements shown separately below)Depreciation and amortization$78.64 MGlobal Real Estate & Development - Franchise rental incomeGlobal Real Estate & Development- Franchise rental income$112.27 MFranchise rental expenseFranchise rental expense$58.22 MWendy's U.S. - Franchise feesWendy's U.S. - Franchise fees$50.41 MAmortization of cloud computing arrangementsAmortization of cloudcomputing arrangements$9.34 MWendy's International - Franchise royalty revenueWendy's International -Franchise royalty revenue$38.71 MImpairment of long-lived assetsImpairment of long-lived assets$5.69 MWendy's International - Advertising funds revenueWendy's International -Advertising funds revenue$18.77 MSystem optimization gains, netSystem optimization gains, net−$2.29 MReorganization and realignment costsReorganization andrealignment costs−$152.00 KWendy's International - SalesWendy's International - Sales$12.21 MWendy's International - Franchise feesWendy's International- Franchise fees$6.50 MFranchise support and other costsFranchise support and other costs$44.56 MGlobal Real Estate & Development - Franchise feesGlobal Real Estate &Development - Franchise fees$992.00 KOther operating income, netOther operating income, net−$10.81 M
Chart details

THE WENDY’S COMPANY (WEN) FY2026 YTD Q2 P&L / Income Statement

Income statement for 2025-12-29 through 2026-06-28. View: Segments by Product and Service. Revenue uses this breakdown; costs and expenses retain the consolidated categories.

Revenues
1,111,208,000 US dollars
Cost of sales
408,324,000 US dollars
Gross profit (calculated)
702,884,000 US dollars
Operating expenses (calculated)
558,679,000 US dollars
Operating profit
144,205,000 US dollars
Other income (expense), net (calculated)
negative 61,473,000 US dollars
Income before income taxes
82,732,000 US dollars
Provision for income taxes
27,404,000 US dollars
Net income
55,328,000 US dollars
Global Real Estate & Development - Advertising funds revenue
0 US dollars
Global Real Estate & Development - Franchise fees
992,000 US dollars
Global Real Estate & Development - Sales
0 US dollars
Global Real Estate & Development - Franchise rental income
112,267,000 US dollars
Global Real Estate & Development - Franchise royalty revenue
0 US dollars
Wendy's International - Advertising funds revenue
18,774,000 US dollars
Wendy's International - Franchise fees
6,501,000 US dollars
Wendy's International - Sales
12,211,000 US dollars
Wendy's International - Franchise rental income
0 US dollars
Wendy's International - Franchise royalty revenue
38,707,000 US dollars
Wendy's U.S. - Advertising funds revenue
216,988,000 US dollars
Wendy's U.S. - Franchise fees
50,409,000 US dollars
Wendy's U.S. - Sales
453,302,000 US dollars
Wendy's U.S. - Franchise rental income
0 US dollars
Wendy's U.S. - Franchise royalty revenue
201,057,000 US dollars
Franchise support and other costs
44,557,000 US dollars
Franchise rental expense
58,215,000 US dollars
Advertising funds expense
236,494,000 US dollars
General and Administrative Expense
139,004,000 US dollars
Depreciation and amortization (exclusive of amortization of cloud computing arrangements shown separately below)
78,636,000 US dollars
Amortization of cloud computing arrangements
9,339,000 US dollars
System optimization gains, net
negative 2,292,000 US dollars
Reorganization and realignment costs
negative 152,000 US dollars
Impairment of long-lived assets
5,692,000 US dollars
Other operating income, net
negative 10,814,000 US dollars

Chart connections

  • Revenue less cost of revenue equals gross profit; gross profit less operating expenses equals operating income.
  • Operating income plus other income or expense equals income before tax. Income before tax less income tax expense or benefit equals net income.
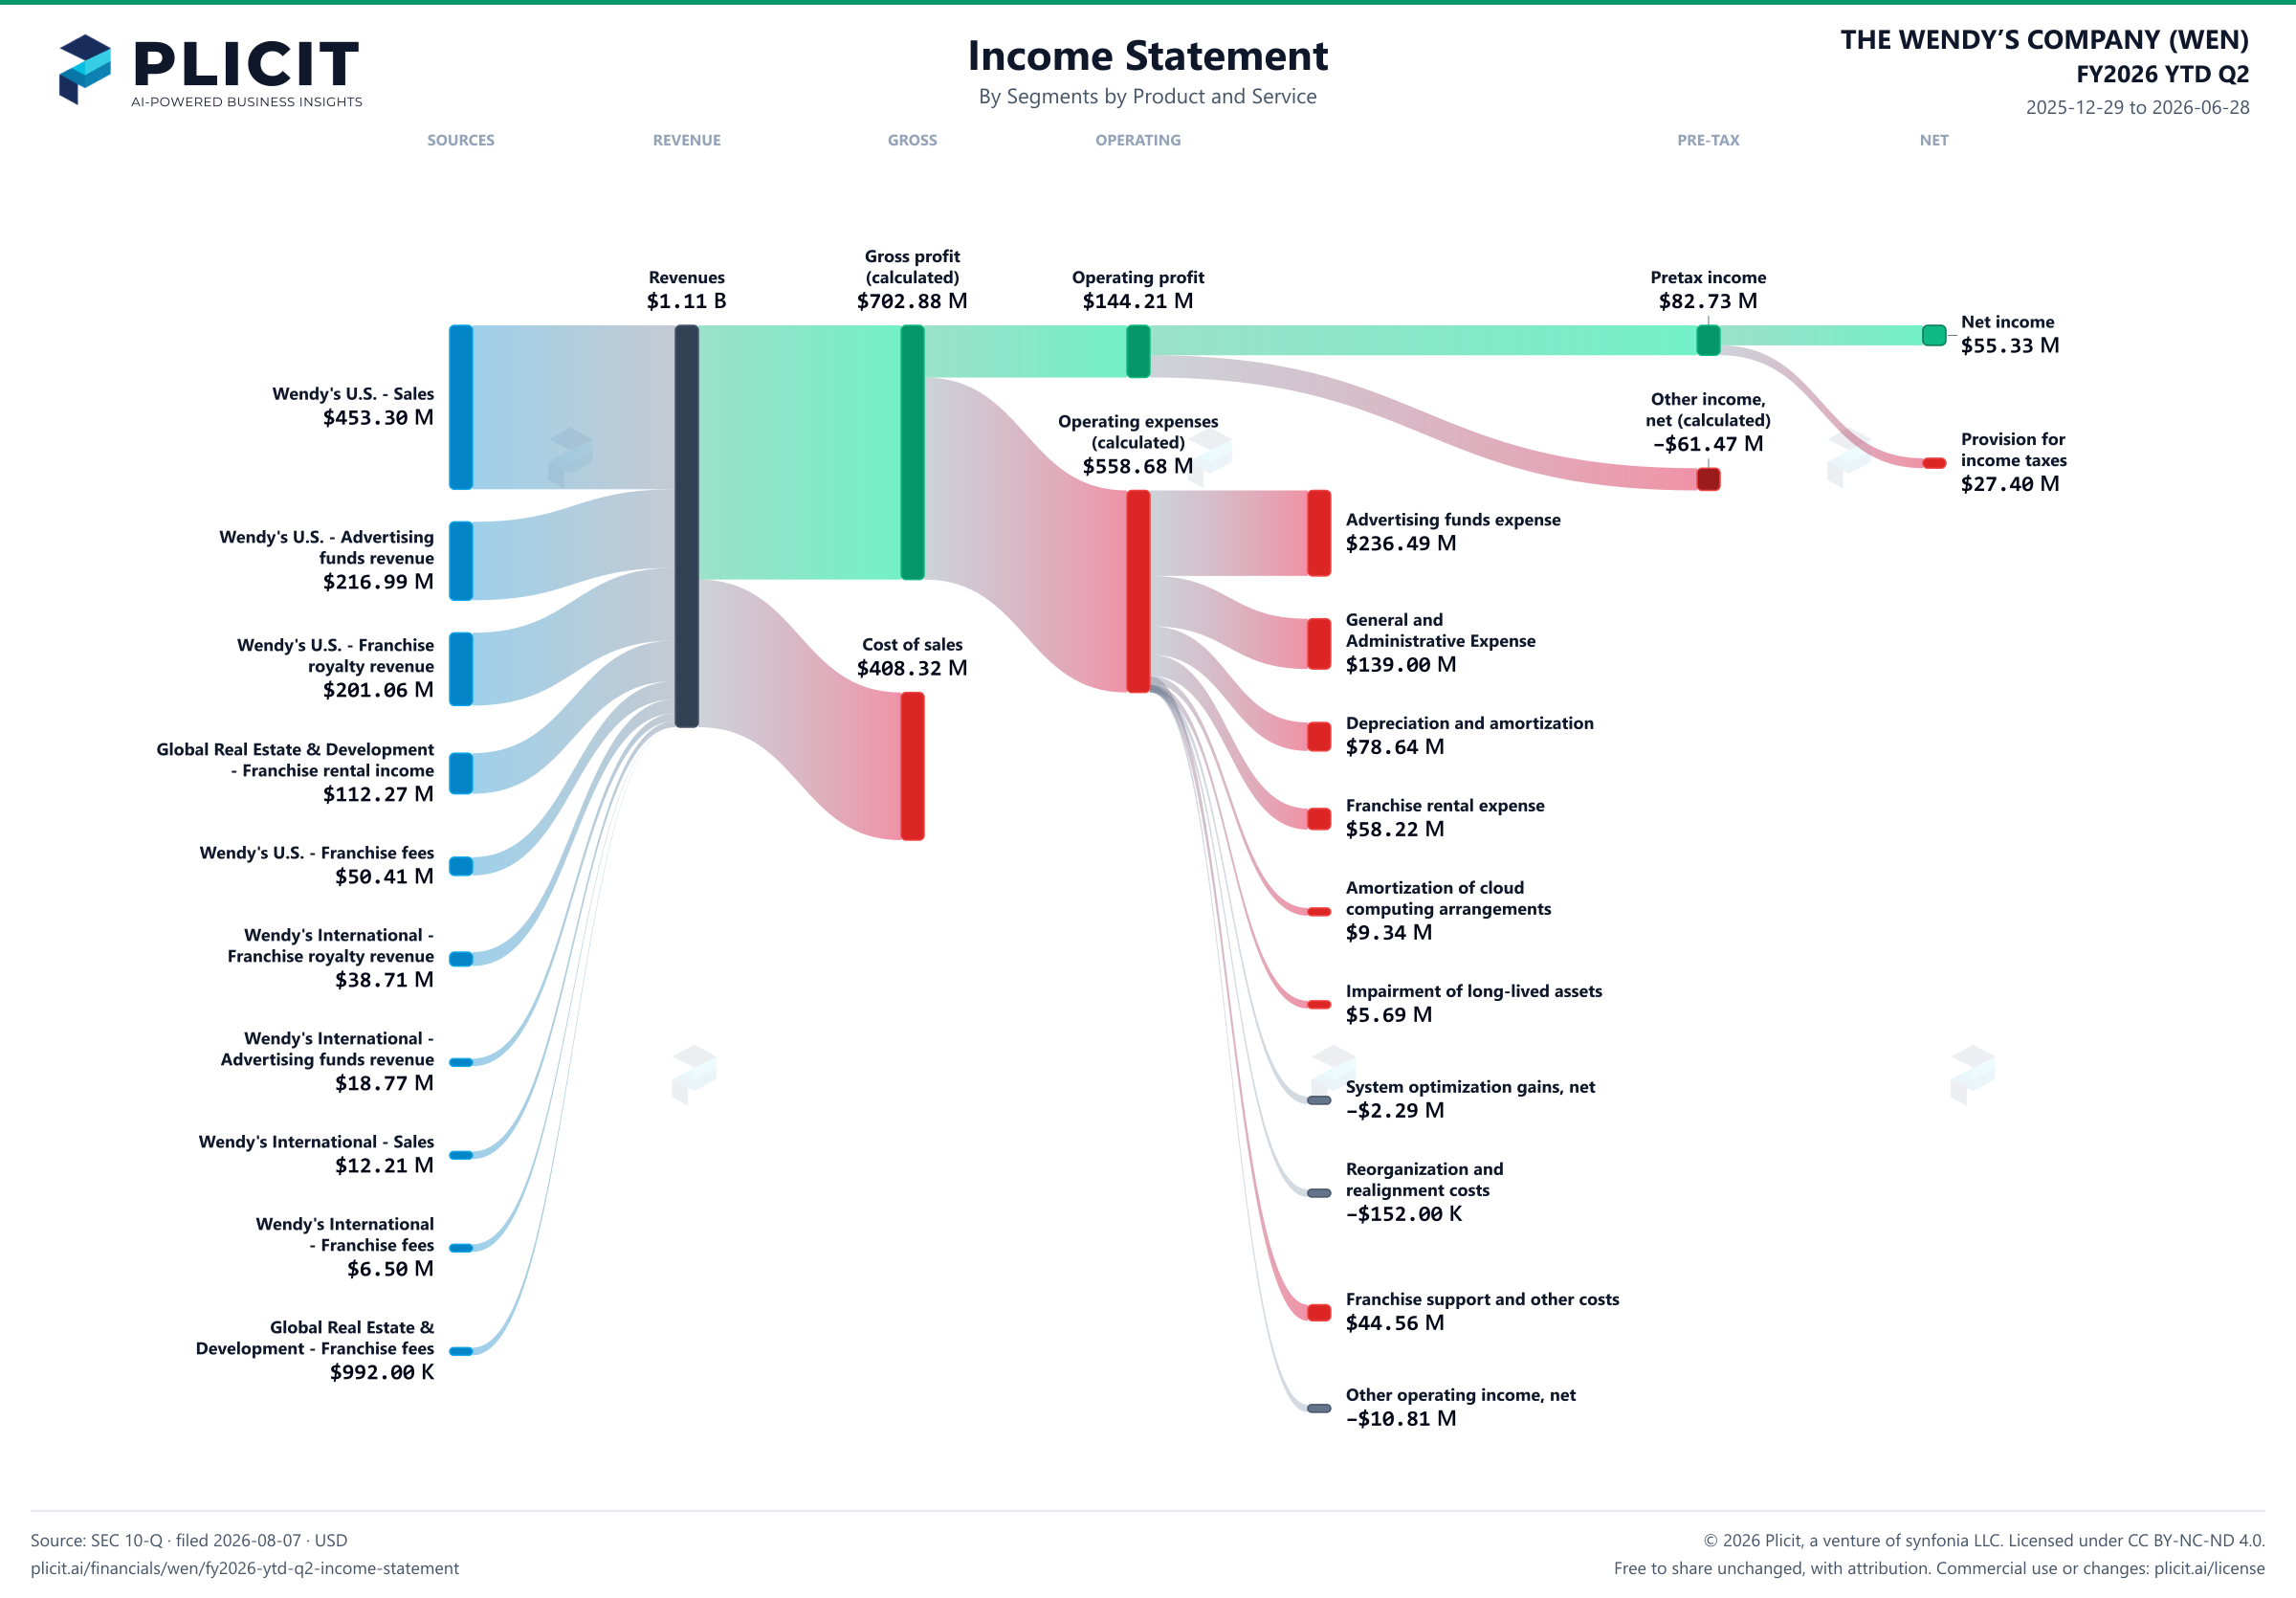
THE WENDY’S COMPANY (WEN) FY2026 YTD Q2 Revenue by Business Segment by Product and Service Sankey chart
Free to share unchanged, with credit to Plicit.ai · CC BY-NC-ND 4.0Download PNG

Gross margin

63.3%

Gross profit / revenue

Operating margin

13.0%

Operating profit / revenue

Cash conversion

289.1%

Operating cash / net income, same period

Newsletter

Get the teardowns by email

Subscribe if you want the public-company teardowns in your inbox when they're released.

Product waitlist

Health Check and Teardown for your own company

A health check uncovers insights of your private books, not a public ticker. Join this list to get notified as soon as we go-live!