
WEX Inc. (WEX) FY2026 Q3 Balance Sheet

Published Source: Form 10-Q on SEC EDGAR filed (opens in a new tab)

As of 2026-09-30

Balance Sheet

Swipe to see the full flow
WEX Inc. (WEX) FY2026 Q3 Balance SheetBalance sheet as of 2026-09-30. The chart shows assets, liabilities and equity at that date.Current liabilities$11.25 BCurrent assets$11.54 BLiabilities$15.04 BAssets$16.20 BNon-current liabilities$3.79 BEquity$1.15 BNon-current assets$4.66 BHOLDINGSASSET CLASSASSETSCLAIM CLASSCLAIM SUB-CLASSCLAIMSAccounts receivable, netInvestment securitiesCash and cash equivalentsRestricted cashSecuritized accounts receivable, restrictedPrepaid expenses and other current assetsGoodwillOther intangible assets (net of accumulated amortization of $1,865.5 in 2026 and $1,730.0 in 2025)Property, equipment and capitalized software (net of accumulated depreciation of $824.0 in 2026 and $713.0 in 2025)Other assetsInvestment securitiesDeferred income taxes, netShort-term depositsAccounts payableShort-term debt, netAccrued expenses and other current liabilitiesRestricted cash payableLong-term debt, netDeferred income taxes, netOther liabilitiesRetained earningsAdditional paid-in capitalCommon stock $0.01 par value; 175.0 shares authorized; 51.2 shares issued in 2026 and 50.7 in 2025; 33.3 shares outstanding in 2026 and 34.3 in 2025Treasury stock at cost; 17.9 shares in 2026 and 16.4 shares in 2025Accumulated other comprehensive lossCurrent assetsNon-current assetsAssetsCurrent liabilitiesNon-current liabilitiesLiabilitiesEquityEquityAccounts receivable, netAccounts receivable, net$5.34 BCurrent liabilitiesCurrent liabilities$11.25 BShort-term depositsShort-term deposits$6.18 BCurrent assetsCurrent assets$11.54 BLiabilitiesLiabilities$15.04 BInvestment securitiesInvestment securities$4.67 BAccounts payableAccounts payable$2.05 BShort-term debt, netShort-term debt, net$1.86 BCash and cash equivalentsCash and cash equivalents$593.20 MAccrued expenses and other current liabilitiesAccrued expenses and other current liabilities$583.40 MAssetsAssets$16.20 BRestricted cashRestricted cash$580.90 MRestricted cash payableRestricted cash payable$577.50 MSecuritized accounts receivable, restrictedSecuritized accounts receivable, restricted$192.80 MNon-current liabilitiesNon-current liabilities$3.79 BLong-term debt, netLong-term debt, net$3.46 BPrepaid expenses and other current assetsPrepaid expenses and other current assets$158.70 MDeferred income taxes, netDeferred income taxes, net$210.90 MOther liabilitiesOther liabilities$124.90 MGoodwillGoodwill$3.03 BEquityEquity$1.15 BRetained earningsRetained earnings$2.69 BOther intangible assets (net of accumulated amortization of $1,865.5 in 2026 and $1,730.0 in 2025)Other intangible assets$1.01 BNon-current assetsNon-current assets$4.66 BAdditional paid-in capitalAdditional paid-in capital$1.31 BProperty, equipment and capitalized software (net of accumulated depreciation of $824.0 in 2026 and $713.0 in 2025)Property, equipment and capitalized software$267.20 MCommon stock $0.01 par value; 175.0 shares authorized; 51.2 shares issued in 2026 and 50.7 in 2025; 33.3 shares outstanding in 2026 and 34.3 in 2025Common stock $0.01 par value$500.00 KOther assetsOther assets$233.70 MTreasury stock at cost; 17.9 shares in 2026 and 16.4 shares in 2025Bought back (treasury stock)−$2.48 BInvestment securitiesInvestment securities$102.70 MAccumulated other comprehensive lossOther comprehensive loss−$371.50 MDeferred income taxes, netDeferred income taxes, net$17.40 M
Chart details

WEX Inc. (WEX) FY2026 Q3 Balance Sheet

Balance sheet as of 2026-09-30. The chart shows assets, liabilities and equity at that date.

Assets
16,196,900,000 US dollars
Current assets
11,541,900,000 US dollars
Non-current assets
4,655,000,000 US dollars
Liabilities
15,044,900,000 US dollars
Current liabilities
11,251,600,000 US dollars
Non-current liabilities
3,793,300,000 US dollars
Equity
1,152,100,000 US dollars
Accounts receivable, net
5,342,700,000 US dollars
Investment securities
4,673,600,000 US dollars
Cash and cash equivalents
593,200,000 US dollars
Restricted cash
580,900,000 US dollars
Securitized accounts receivable, restricted
192,800,000 US dollars
Prepaid expenses and other current assets
158,700,000 US dollars
Goodwill
3,025,900,000 US dollars
Other intangible assets (net of accumulated amortization of $1,865.5 in 2026 and $1,730.0 in 2025)
1,008,200,000 US dollars
Property, equipment and capitalized software (net of accumulated depreciation of $824.0 in 2026 and $713.0 in 2025)
267,200,000 US dollars
Other assets
233,700,000 US dollars
Investment securities
102,700,000 US dollars
Deferred income taxes, net
17,400,000 US dollars
Short-term deposits
6,180,500,000 US dollars
Accounts payable
2,046,700,000 US dollars
Short-term debt, net
1,863,500,000 US dollars
Accrued expenses and other current liabilities
583,400,000 US dollars
Restricted cash payable
577,500,000 US dollars
Long-term debt, net
3,457,600,000 US dollars
Deferred income taxes, net
210,900,000 US dollars
Other liabilities
124,900,000 US dollars
Retained earnings
2,691,200,000 US dollars
Additional paid-in capital
1,311,300,000 US dollars
Common stock $0.01 par value; 175.0 shares authorized; 51.2 shares issued in 2026 and 50.7 in 2025; 33.3 shares outstanding in 2026 and 34.3 in 2025
500,000 US dollars
Treasury stock at cost; 17.9 shares in 2026 and 16.4 shares in 2025
negative 2,479,400,000 US dollars
Accumulated other comprehensive loss
negative 371,500,000 US dollars

Chart connections

  • Assets equal liabilities plus consolidated equity. Consolidated equity includes noncontrolling interests when reported.
  • Treasury shares and other negative equity contributions reduce equity.
  • Total assets are $16,196.90 M and liabilities and equity are $16,197.00 M; the $0.10 M difference is within the rounding of the filed amounts.
  • The filed non-current assets lines add up to $4,655.10 M and the non-current assets total is $4,655.00 M; the $0.10 M difference is within the rounding of the filed amounts.
  • The filed non-current liabilities lines add up to $3,793.40 M and the non-current liabilities total is $3,793.30 M; the $0.10 M difference is within the rounding of the filed amounts.
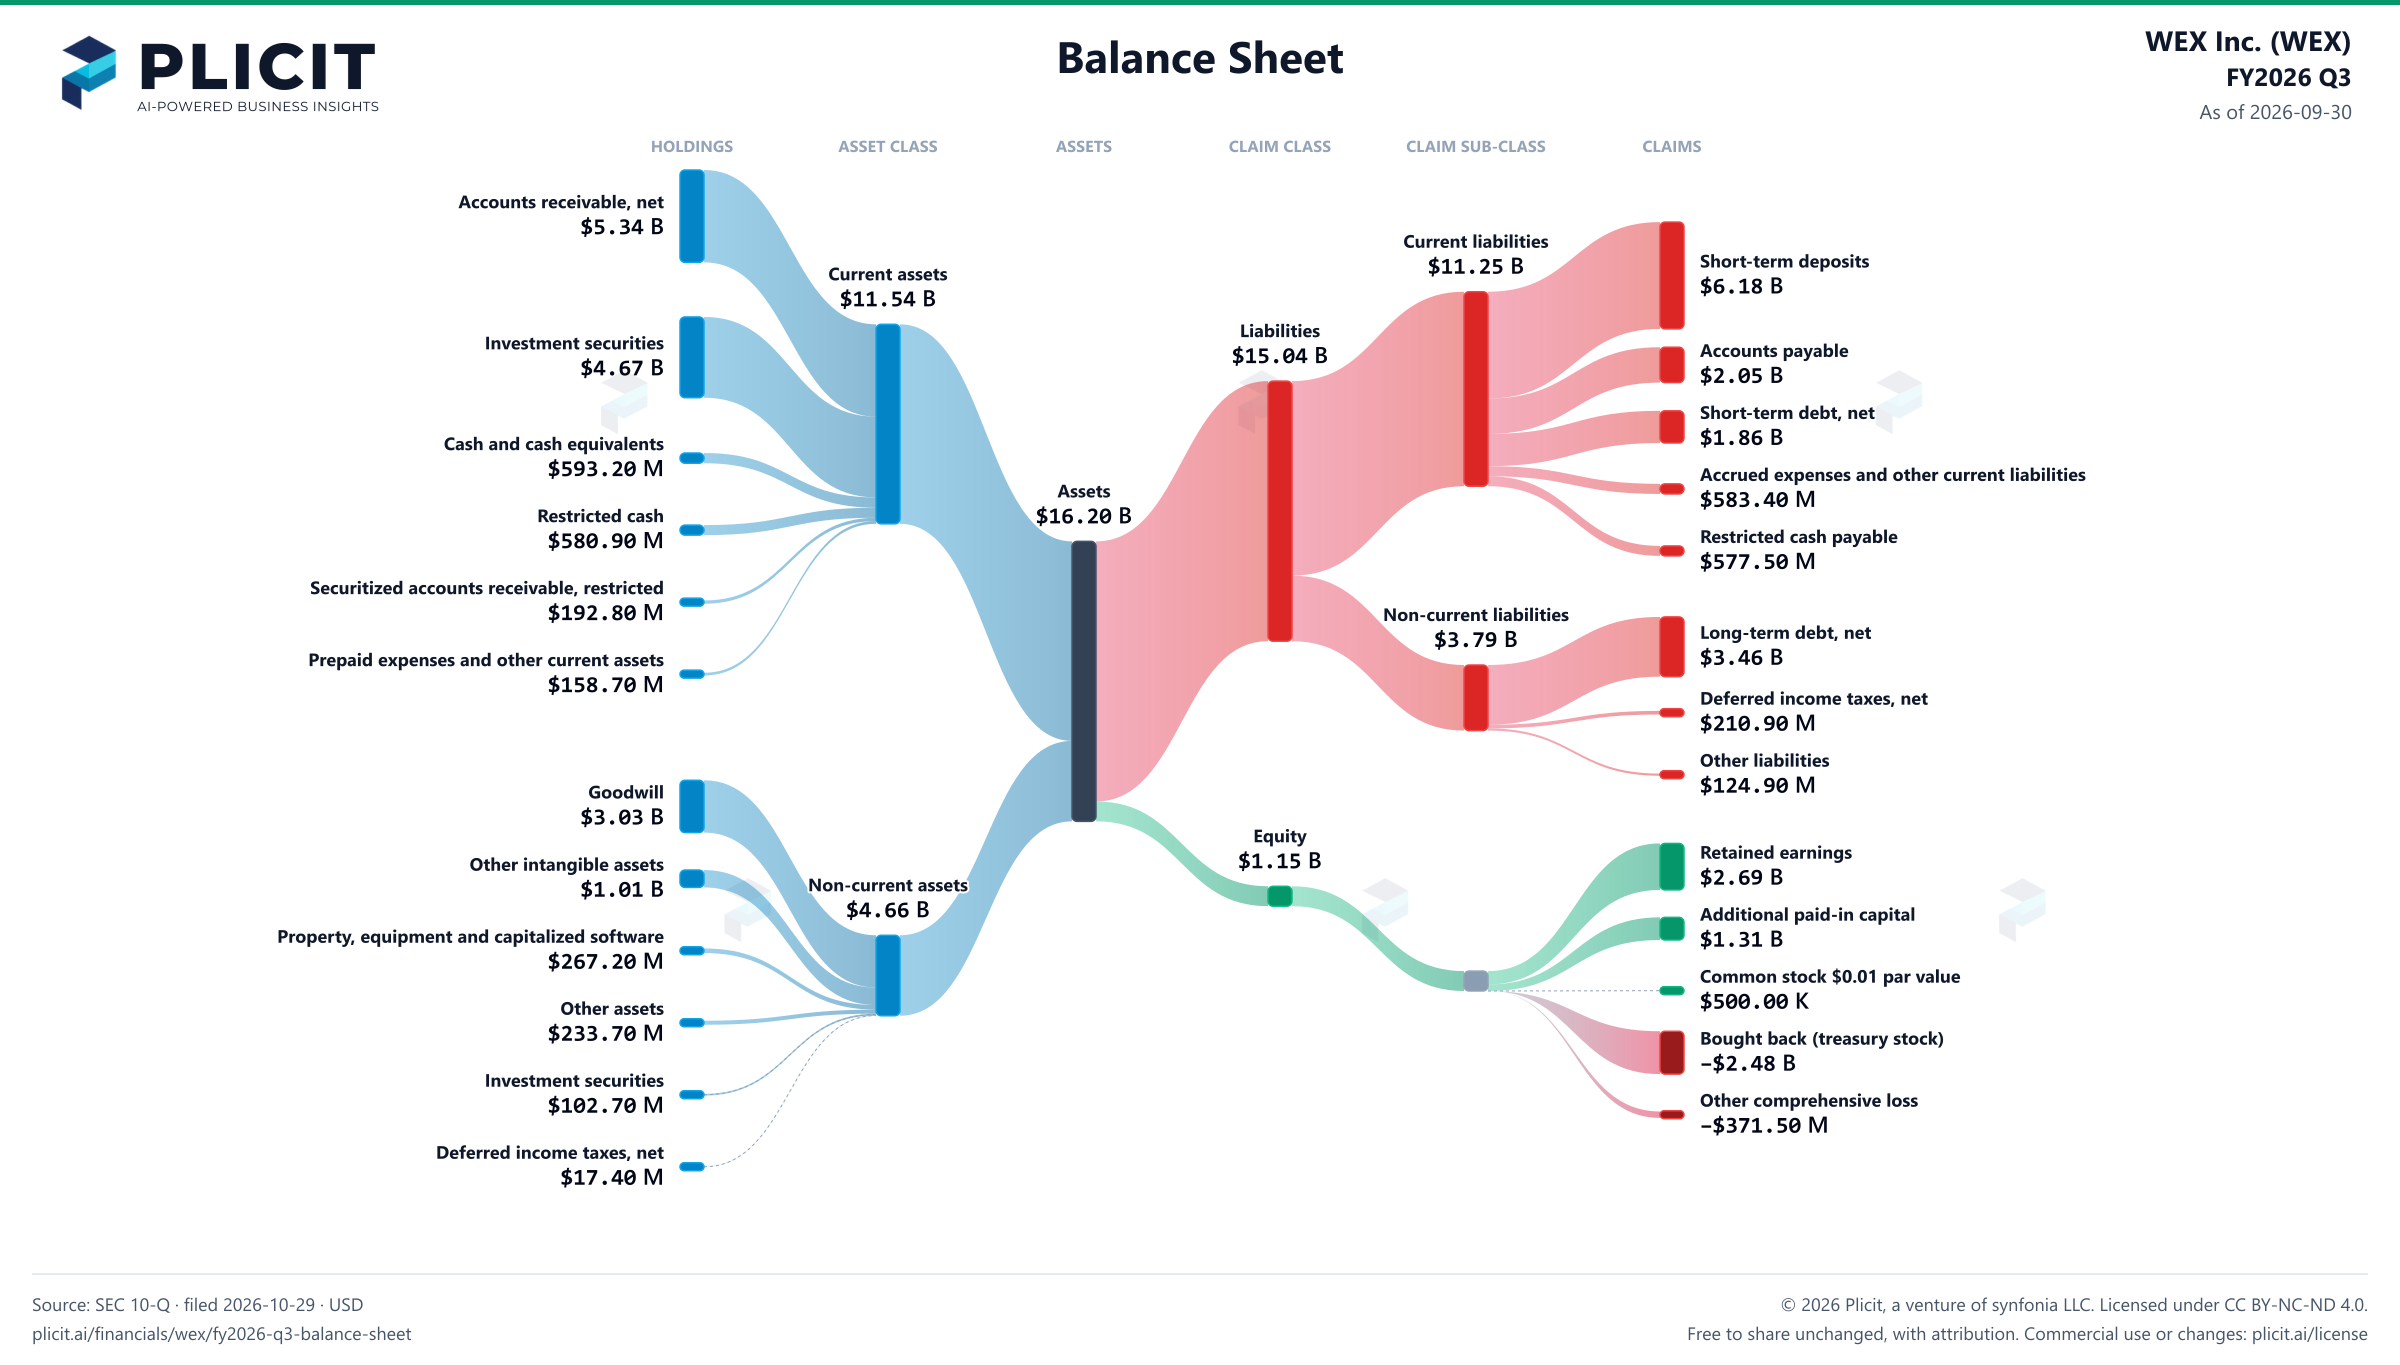
WEX Inc. (WEX) FY2026 Q3 Balance Sheet Sankey chart
Free to share unchanged, with credit to Plicit.ai · CC BY-NC-ND 4.0Download PNG

Product waitlist

Health Check and Teardown for your own company

A health check uncovers insights of your private books, not a public ticker. Join this list to get notified as soon as we go-live!