
Cactus, Inc. (WHD) FY2026 Q3 Statement of Cash Flows

Published Source: Form 10-Q on SEC EDGAR filed (opens in a new tab)

2026-07-01 to 2026-09-30

Statement of Cash Flows

Swipe to see the full flow
Cactus, Inc. cash flow reconciliation, Jul 1, 2026 through Sep 30, 2026One connected Sankey reconciles operating, investing and financing net cash flows through a shared cash pool, from beginning cash to ending cash. Ribbons flow left to right on one dollar scale. Activity totals are dark gray; beginning and ending cash are blue. Cash basis for beginning and ending balances and net cash change: Cash, cash equivalents, and restricted cash. Intermediate calculation bars are lighter gray. Net income is green for profit and red for loss. Identified asset purchases, sales and maturities are blue in either cash direction. Orange marks positive customer-advance and deferred-revenue changes that add to operating cash in the reconciliation. These are net changes, not gross customer receipts. Negative changes are neutral reconciliation adjustments; they do not by themselves identify cash payments. Purple identifies capital transactions such as borrowing, repayments, share issuance and dividends. Read chart description and values below for full signed amounts, including zero items.Net income → Net cash from operating activities: $18,420,000.00Net income → Operating adjustments reconciliation: $55,671,000.00Accrued expenses and other liabilities → Operating adjustments reconciliation: $28,362,000.00Depreciation and amortization → Operating adjustments reconciliation: $26,815,000.00Contract liabilities → Operating adjustments reconciliation: $14,364,000.00Accounts receivable → Operating adjustments reconciliation: $12,706,000.00Stock-based compensation → Operating adjustments reconciliation: $7,753,000.00Inventory obsolescence → Operating adjustments reconciliation: $2,617,000.00Deferred income taxes → Operating adjustments reconciliation: $2,597,000.00Deferred financing cost amortization → Operating adjustments reconciliation: $169,000.00Provision for expected credit losses → Operating adjustments reconciliation: $81,000.00Operating adjustments reconciliation → Accounts payable: $128,104,000.00Operating adjustments reconciliation → Inventories: $18,792,000.00Operating adjustments reconciliation → Gain on disposal of assets: $3,577,000.00Operating adjustments reconciliation → Prepaid expenses and other assets: $662,000.00Proceeds from sales of assets → investing reconciliation: $5,232,000.00Net cash used in investing activities → investing reconciliation: $16,066,000.00investing reconciliation → Capital expenditures and other: $21,298,000.00Net cash used in financing activities → financing reconciliation: $15,262,000.00financing reconciliation → Dividends paid to Class A common stock shareholders: $10,510,000.00financing reconciliation → Distributions to members: $2,652,000.00financing reconciliation → Payments on finance leases: $2,061,000.00financing reconciliation → Repurchases of shares: $39,000.00Exchange-rate effect → Cash sources and uses: $1,308,000.00Beginning cash: Cash, cash equivalents, and restricted cash → Cash sources and uses: $365,821,000.00Net cash from operating activities → Cash sources and uses: $18,420,000.00Cash sources and uses → Ending cash: Cash, cash equivalents, and restricted cash: $354,221,000.00Cash sources and uses → Net cash used in investing activities: $16,066,000.00Cash sources and uses → Net cash used in financing activities: $15,262,000.00Net income: $74,091,000.00Net income+$74.09 MDepreciation and amortization: $26,815,000.00Depreciation & amortization+$26.82 MDeferred financing cost amortization: $169,000.00Debt cost amortization+$169.00 KStock-based compensation: $7,753,000.00Stock-based compensation+$7.75 MProvision for expected credit losses: $81,000.00Credit loss provision+$81.00 KInventory obsolescence: $2,617,000.00Inventory write-downs+$2.62 MGain on disposal of assets: -$3,577,000.00Asset disposal gain & loss−$3.58 MDeferred income taxes: $2,597,000.00Deferred tax balances+$2.60 MAccounts receivable: $12,706,000.00Accounts receivable+$12.71 MInventories: -$18,792,000.00Inventories−$18.79 MPrepaid expenses and other assets: -$662,000.00Prepaid & other assets−$662.00 KAccounts payable: -$128,104,000.00Trade payables−$128.10 MAccrued expenses and other liabilities: $28,362,000.00Other payables & accruals+$28.36 MContract liabilities: $14,364,000.00Deferred revenue+$14.36 MGain from revaluation of liability related to tax receivable agreement and other: $0.00Net cash from operating activities: $18,420,000.00Operating cash+$18.42 MOperating adjustments reconciliation: $151,135,000.00Payments of deferred financing costs: $0.00Payments on finance leases: -$2,061,000.00Finance lease payments−$2.06 MDividends paid to Class A common stock shareholders: -$10,510,000.00Common dividends paid−$10.51 MDistributions to members: -$2,652,000.00Distributions to members−$2.65 MRepurchases of shares: -$39,000.00Common stock repurchases−$39.00 KNet cash used in financing activities: -$15,262,000.00. Cash required to fund net payments.Financing cash−$15.26 Mfinancing reconciliation: $15,262,000.00Acquisition of a business, net of cash and cash equivalents acquired: $0.00Investment in unconsolidated affiliate: $0.00Capital expenditures and other: -$21,298,000.00Capital expenditures and other−$21.30 MProceeds from sales of assets: $5,232,000.00Asset sales+$5.23 MNet cash used in investing activities: -$16,066,000.00. Cash required to fund net payments.Investing cash−$16.07 Minvesting reconciliation: $21,298,000.00Cash sources and uses: $385,549,000.00Beginning cash: Cash, cash equivalents, and restricted cash: $365,821,000.00Beginning cash$365.82 MEnding cash: Cash, cash equivalents, and restricted cash: $354,221,000.00Ending cash$354.22 MExchange-rate effect: $1,308,000.00FX effect+$1.31 MCASH RECONCILIATIONOperatingflowsInvestingflowsFinancingflowsFree cash flowNot availableCash flow / Net income0.25×Operating cash flow ÷ net incomeNet cash change−$11.60 MEnding cash − beginning cash
Chart details

Cactus, Inc. cash flow reconciliation, Jul 1, 2026 through Sep 30, 2026

Cash flows for Jul 1, 2026 through Sep 30, 2026. Cash basis: Cash, cash equivalents, and restricted cash. Beginning cash: Jun 30, 2026. Ending cash: Sep 30, 2026. Beginning and ending cash are dated balances. Positive cash flows add cash; negative cash flows reduce it.

Beginning cash on Jun 30, 2026
365,821,000 US dollars. Beginning cash: Cash, cash equivalents, and restricted cash
Operating activities
18,420,000 US dollars. Net cash provided.
Net income
74,091,000 US dollars
Depreciation and amortization
26,815,000 US dollars
Deferred financing cost amortization
169,000 US dollars
Stock-based compensation
7,753,000 US dollars
Provision for expected credit losses
81,000 US dollars
Inventory obsolescence
2,617,000 US dollars
Gain on disposal of assets
negative 3,577,000 US dollars
Deferred income taxes
2,597,000 US dollars
Accounts receivable
12,706,000 US dollars
Inventories
negative 18,792,000 US dollars
Prepaid expenses and other assets
negative 662,000 US dollars
Accounts payable
negative 128,104,000 US dollars
Accrued expenses and other liabilities
28,362,000 US dollars
Contract liabilities
14,364,000 US dollars
Gain from revaluation of liability related to tax receivable agreement and other
0 US dollars
Investing activities
negative 16,066,000 US dollars. Net cash used.
Acquisition of a business, net of cash and cash equivalents acquired
0 US dollars
Investment in unconsolidated affiliate
0 US dollars
Capital expenditures and other
negative 21,298,000 US dollars
Proceeds from sales of assets
5,232,000 US dollars
Financing activities
negative 15,262,000 US dollars. Net cash used.
Payments of deferred financing costs
0 US dollars
Payments on finance leases
negative 2,061,000 US dollars
Dividends paid to Class A common stock shareholders
negative 10,510,000 US dollars
Distributions to members
negative 2,652,000 US dollars
Repurchases of shares
negative 39,000 US dollars
Operating adjustment reconciliation
151,135,000 US dollars. Intermediate calculation joining the operating reconciliation branches. Its gross amount includes any portion of net income routed through this junction. It is not an additional cash source or use.
financing gross reconciliation
15,262,000 US dollars. Gross amount at the activity's junction before offsetting its receipts and deductions. It is not an additional cash source or use.
investing gross reconciliation
21,298,000 US dollars. Gross amount at the activity's junction before offsetting its receipts and deductions. It is not an additional cash source or use.
Exchange-rate effect
1,308,000 US dollars
Ending cash on Sep 30, 2026
354,221,000 US dollars. Ending cash: Cash, cash equivalents, and restricted cash
Cash sources and uses
385,549,000 US dollars. Opening cash plus net sources, equal to net uses plus ending cash.
Net cash change
negative 11,600,000 US dollars. Ending cash minus beginning cash.
Cash flow / Net income
0.25×. Operating cash flow divided by reconciliation net income for the same period. Black from 0.90× through 1.10×; green above 1.10×; red below 0.90×. Color uses the unrounded ratio.

Chart connections

  • Beginning cash plus operating, investing and financing cash flows plus the exchange-rate effect equals ending cash. Negative amounts reduce cash.
  • Financing contributions meet at a reconciliation junction before connecting to the net cash total.
  • Investing contributions meet at a reconciliation junction before connecting to the net cash total.
  • Operating reconciliation adjustments are not all independent cash receipts.
  • Net income exceeds operating cash. The diagram allocates $18.42M of net income directly to operating cash and $55.67M to the adjustment junction, where it combines with other additions to reconcile deductions. This is an accounting presentation, not a tracing of cash receipts.
  • Each activity has one net cash bar connected to the shared cash pool. Positive activity totals enter the pool; negative activity totals leave the pool to fund that activity's net payments. The central pool does not assign a particular funding source to a particular payment.
  • The intermediate calculation bars include both sides of the displayed activity breakdowns; they are not additional cash flows.
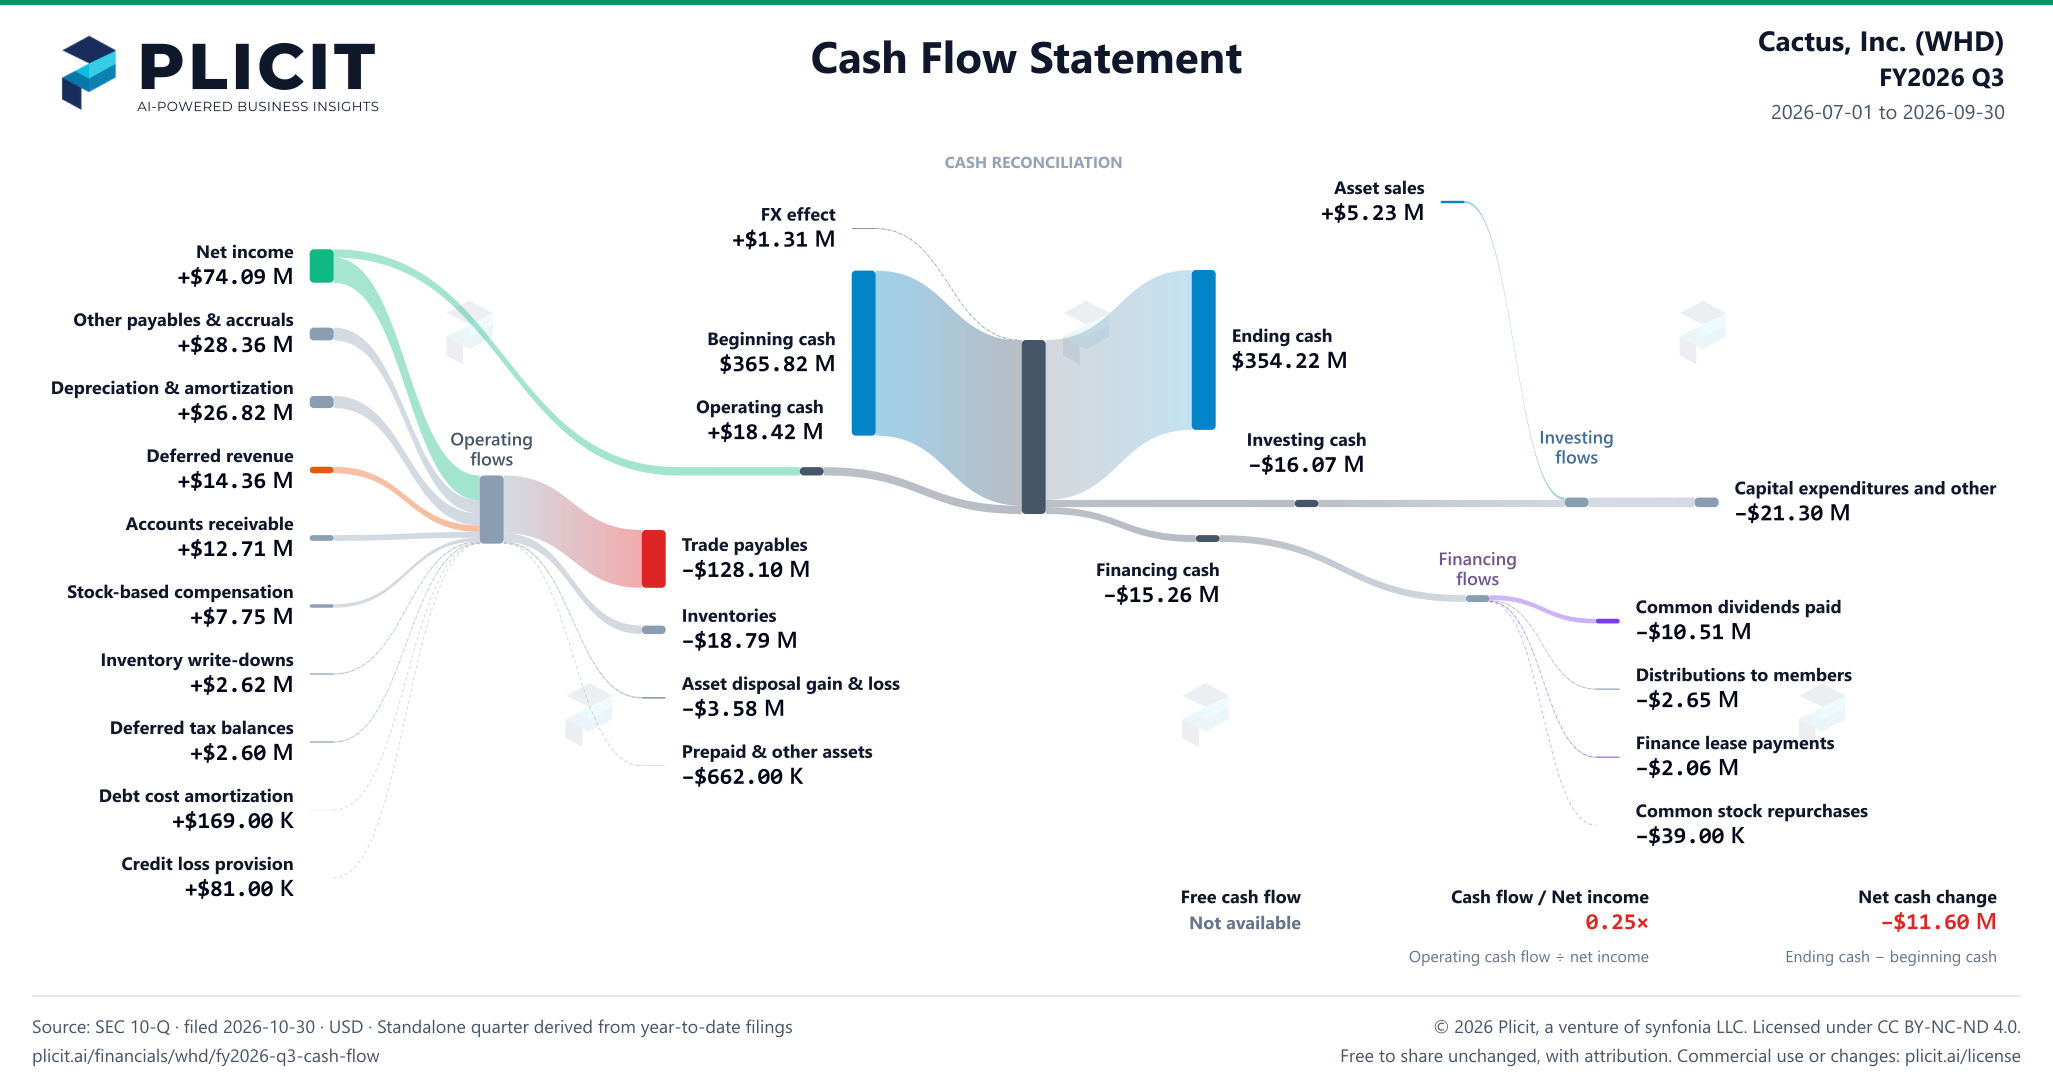
Cactus, Inc. (WHD) FY2026 Q3 Statement of Cash Flows Sankey chart
Free to share unchanged, with credit to Plicit.ai · CC BY-NC-ND 4.0Download PNG

Product waitlist

Health Check and Teardown for your own company

A health check uncovers insights of your private books, not a public ticker. Join this list to get notified as soon as we go-live!