
JOHN WILEY & SONS, INC. (WLY) FY2027 Q1 Balance Sheet
As of 2026-07-31
Balance Sheet
As of 2026-07-31
Swipe to see the full flow
Chart details
JOHN WILEY & SONS, INC. (WLY) FY2027 Q1 Balance Sheet
Balance sheet as of 2026-07-31. The chart shows assets, liabilities and equity at that date.
- Assets
- 3,132,399,000 US dollars
- Current assets
- 438,222,000 US dollars
- Non-current assets
- 2,694,177,000 US dollars
- Liabilities
- 2,335,360,000 US dollars
- Current liabilities
- 688,822,000 US dollars
- Non-current liabilities
- 1,646,538,000 US dollars
- Equity
- 797,039,000 US dollars
- Accounts receivable, net of allowance for credit losses of $xx million and $xx million, respectively
- 210,729,000 US dollars
- Cash and cash equivalents
- 106,426,000 US dollars
- Prepaid expenses and other current assets
- 102,595,000 US dollars
- Inventories, net
- 18,472,000 US dollars
- Goodwill
- 1,390,757,000 US dollars
- Intangible assets, net
- 853,303,000 US dollars
- Other non-current assets
- 262,075,000 US dollars
- Technology, property, and equipment, net
- 131,564,000 US dollars
- Operating lease right-of-use assets
- 56,478,000 US dollars
- Contract liabilities
- 384,278,000 US dollars
- Accrued royalties
- 101,948,000 US dollars
- Other accrued liabilities
- 71,671,000 US dollars
- Accrued employment costs
- 56,129,000 US dollars
- Accounts payable
- 44,935,000 US dollars
- Short-term portion of operating lease liabilities
- 16,111,000 US dollars
- Short-term portion of long-term debt
- 13,750,000 US dollars
- Long-term debt
- 1,277,516,000 US dollars
- Deferred income tax liabilities
- 165,492,000 US dollars
- Other long-term liabilities
- 77,297,000 US dollars
- Operating lease liabilities
- 67,493,000 US dollars
- Accrued pension liability
- 58,740,000 US dollars
- Retained earnings
- 1,708,201,000 US dollars
- Additional paid-in-capital
- 482,223,000 US dollars
- Common stock - Class A common stock
- 70,314,000 US dollars
- Common stock - Class B common stock
- 12,868,000 US dollars
- Preferred stock, $1 par value per share: Authorized shares – 2 million, Issued shares - 0
- 0 US dollars
- Less treasury shares at cost (Class A – x and x as of x and x, respectively; Class B – x and x as of x and x, respectively)
- negative 1,029,072,000 US dollars
- Accumulated other comprehensive loss, net of tax
- negative 447,495,000 US dollars
- Gross equity (calculated)
- 2,273,606,000 US dollars. Net equity plus the magnitudes of its negative contributions equals gross positive equity. The negative contributions enter this reconciliation as add-backs; their filed signs stay negative.
Chart connections
- Assets equal liabilities plus consolidated equity. Consolidated equity includes noncontrolling interests when reported.
- Treasury shares and other negative equity contributions reduce equity.
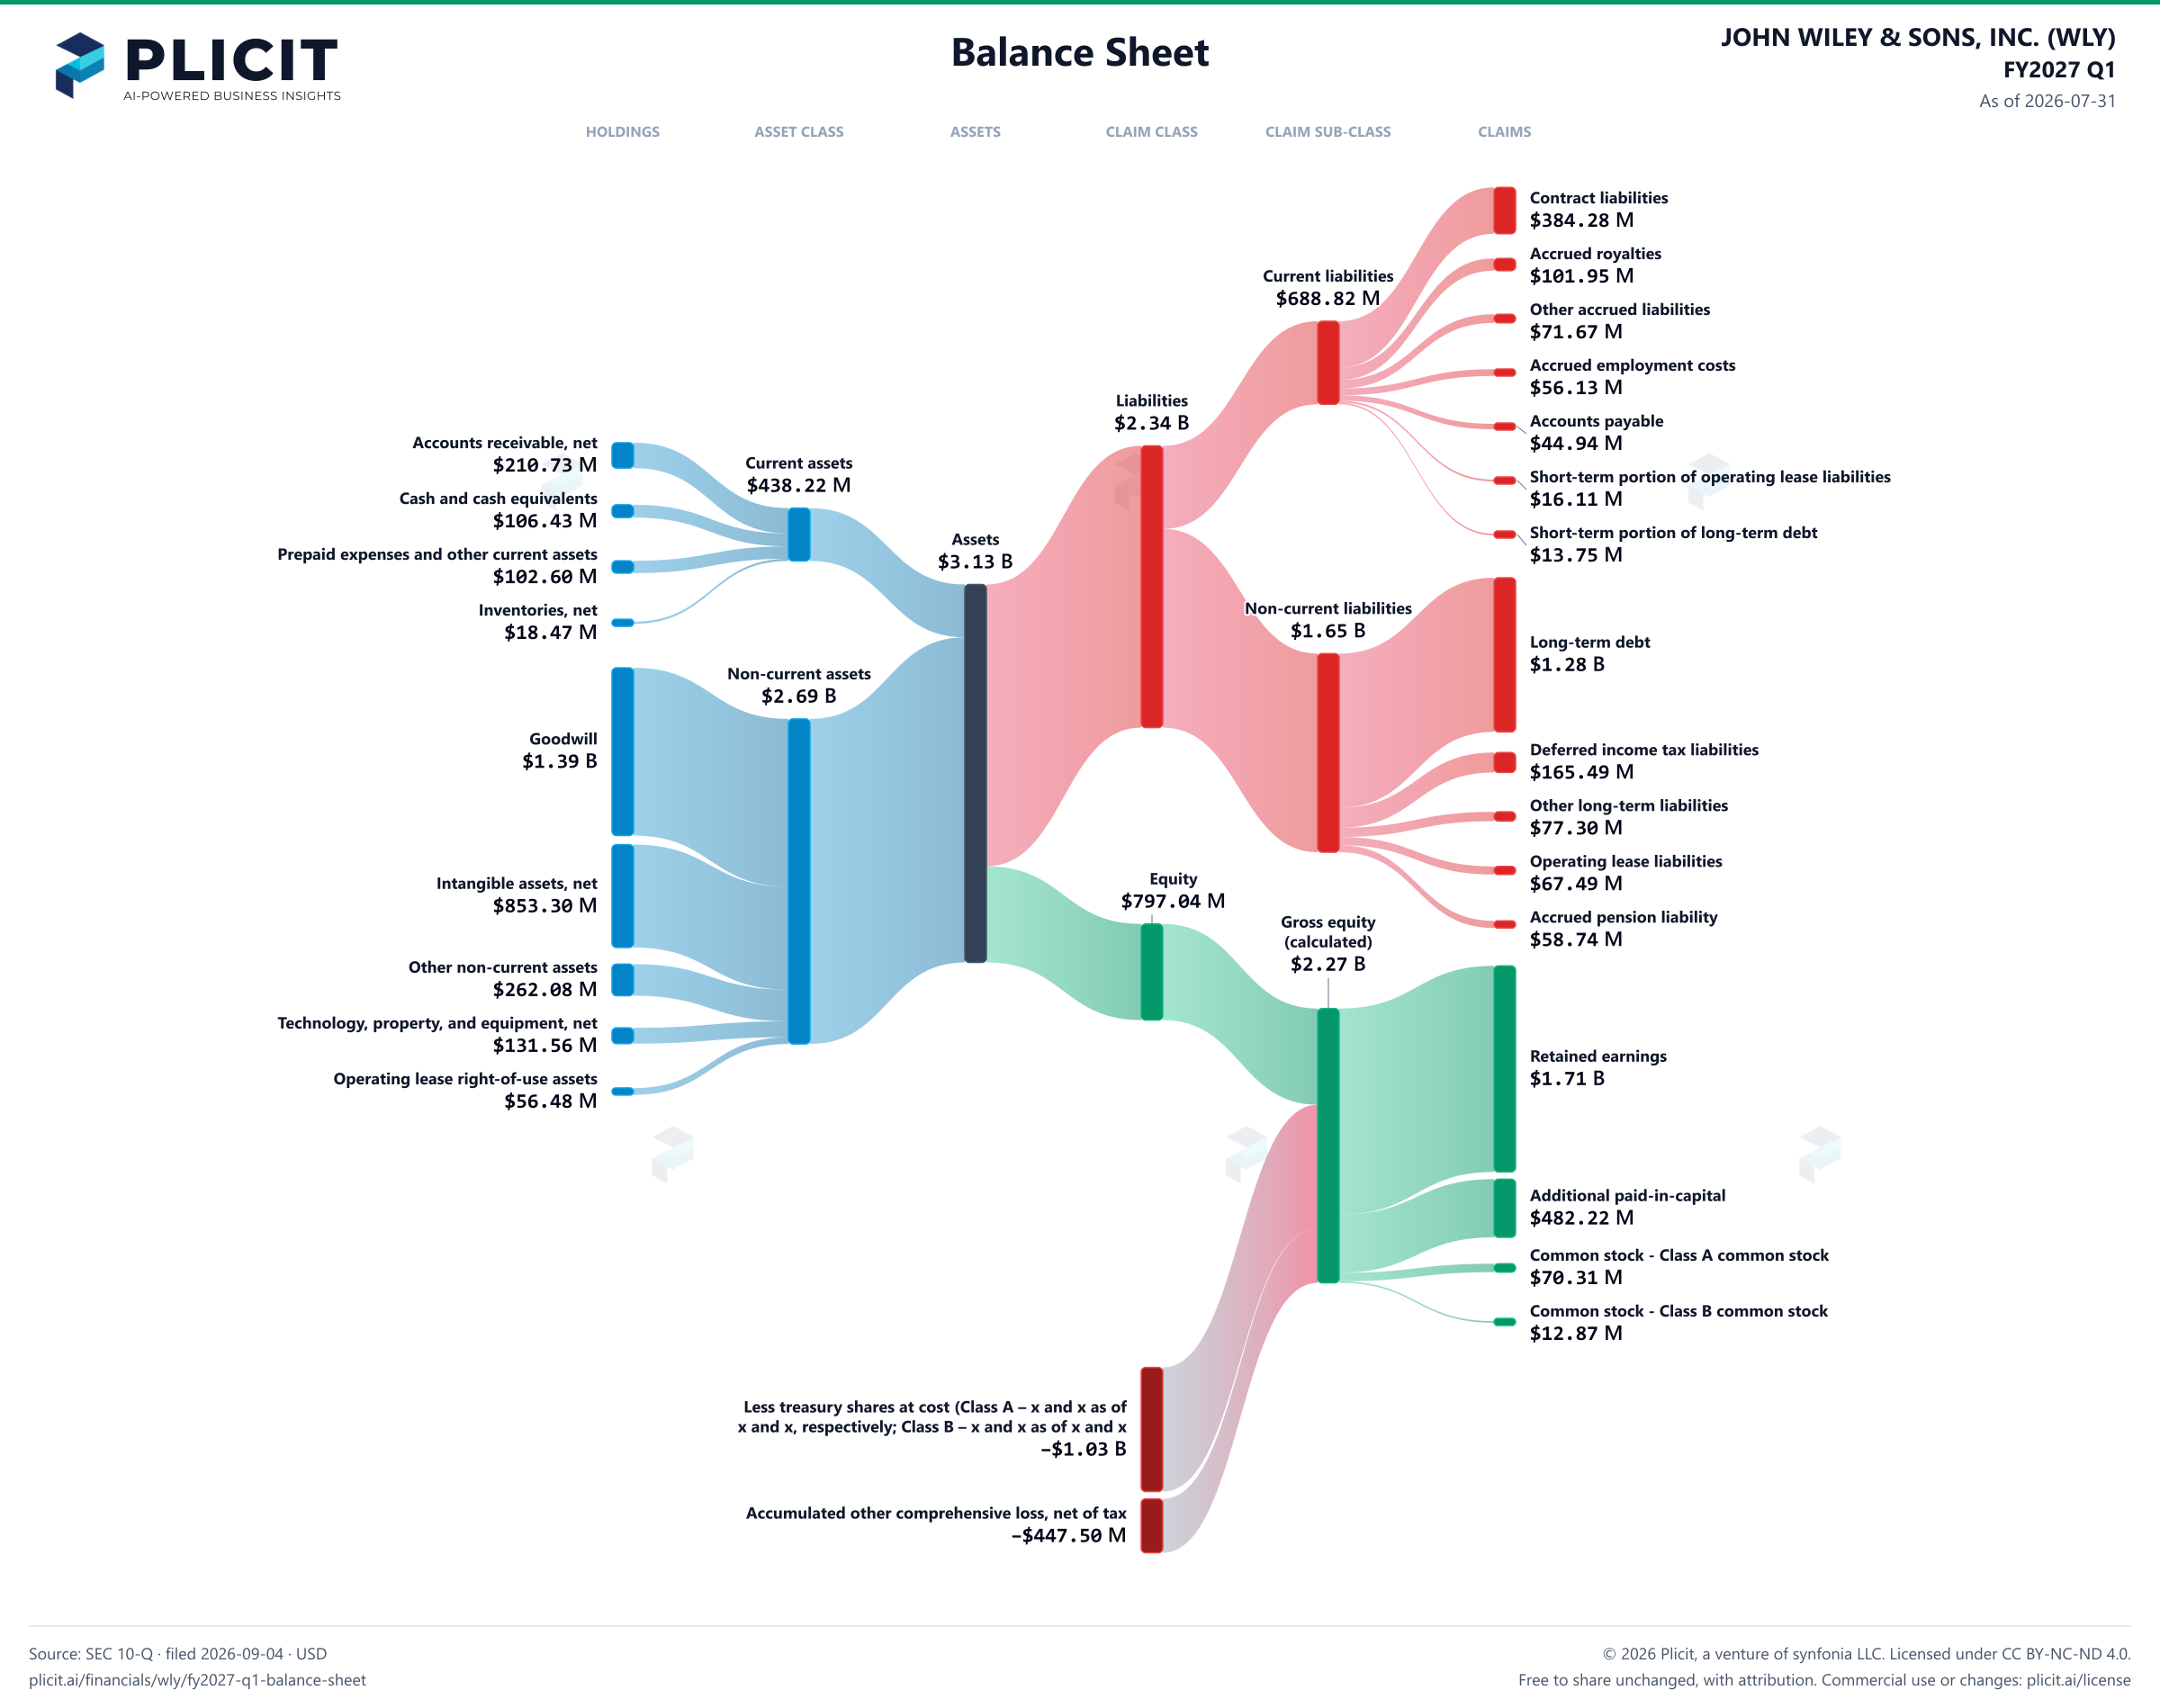
Free to share unchanged, with credit to Plicit.ai · CC BY-NC-ND 4.0Download PNG
Product waitlist
Health Check and Teardown for your own company
A health check uncovers insights of your private books, not a public ticker. Join this list to get notified as soon as we go-live!