
Block, Inc. (XYZ) FY2026 Q1 P&L / Income Statement
2026-01-01 to 2026-03-31
Revenue by Product and Service
2026-01-01 to 2026-03-31
Swipe to see the full flow
Chart details
Block, Inc. (XYZ) FY2026 Q1 P&L / Income Statement
Income statement for 2026-01-01 through 2026-03-31. View: Product and service. Revenue and costs use their disclosed categories.
- Total
- 6,056,847,000 US dollars
- Total cost of revenue
- 3,147,608,000 US dollars
- Gross profit
- 2,909,239,000 US dollars
- Operating expenses (calculated)
- 3,081,229,000 US dollars
- Operating income (loss)
- negative 171,990,000 US dollars
- Other income (expense), net (calculated)
- negative 220,587,000 US dollars
- Income (loss) before income tax
- negative 392,577,000 US dollars
- Provision for (benefit from) income taxes
- negative 83,982,000 US dollars
- Net income (loss)
- negative 308,595,000 US dollars
- Commerce enablement revenue revenue
- 2,938,470,000 US dollars
- Financial solutions revenue revenue
- 1,321,985,000 US dollars
- Bitcoin ecosystem revenue revenue
- 1,796,392,000 US dollars
- Commerce enablement revenue cost of revenue
- 1,317,459,000 US dollars
- Financial solutions revenue cost of revenue
- 89,375,000 US dollars
- Bitcoin ecosystem revenue cost of revenue
- 1,727,957,000 US dollars
- Amortization of acquired technology assets
- 12,817,000 US dollars
- Transaction, loan, and consumer receivable losses
- 500,125,000 US dollars
- General and administrative
- 857,564,000 US dollars
- Product development
- 1,038,873,000 US dollars
- Amortization of customer and other acquired intangible assets
- 34,159,000 US dollars
- Sales and marketing
- 650,508,000 US dollars
Chart connections
- Revenue less cost of revenue equals gross profit; gross profit less operating expenses equals operating income.
- Operating income plus other income or expense equals income before tax. Income before tax less income tax expense or benefit equals net income.
- Of which attributable to Block, Inc.: −$308.68 M; to noncontrolling interests: $86.00 K.
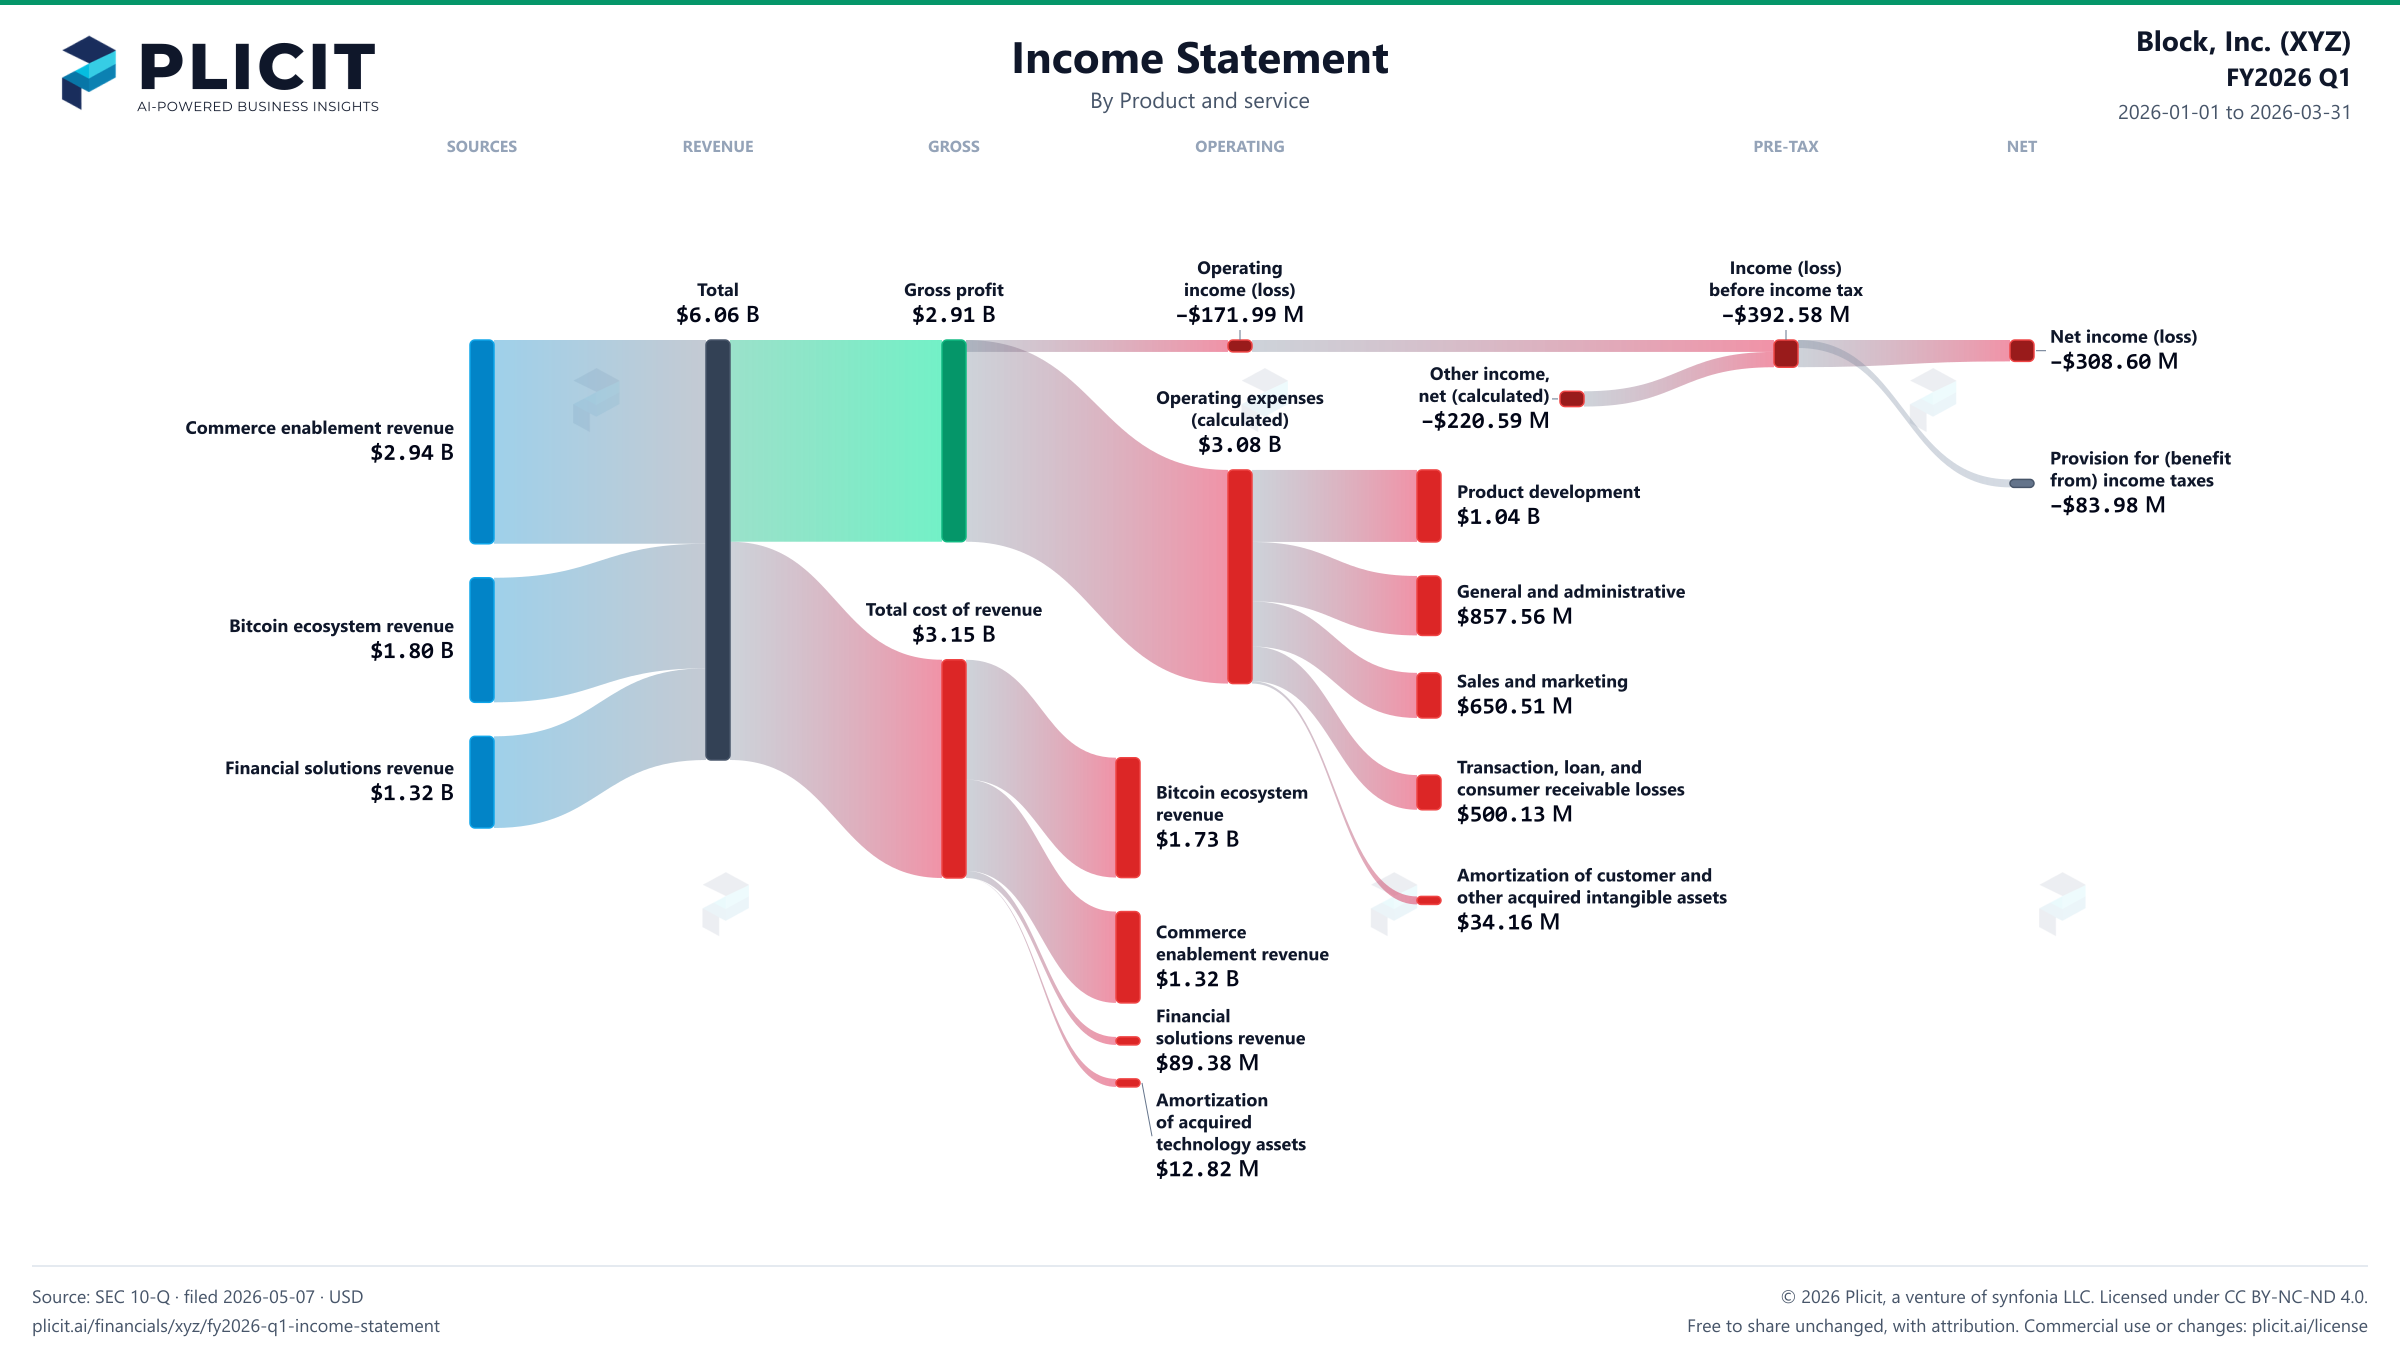
Free to share unchanged, with credit to Plicit.ai · CC BY-NC-ND 4.0Download PNG
Gross margin
48.0%
Gross profit / revenue
Operating margin
−2.8%
Operating profit / revenue
Product waitlist
Health Check and Teardown for your own company
A health check uncovers insights of your private books, not a public ticker. Join this list to get notified as soon as we go-live!