
Zebra Technologies Corporation (ZBRA) FY2026 Q2 Balance Sheet
As of 2026-07-04
Balance Sheet
As of 2026-07-04
Swipe to see the full flow
Chart details
Zebra Technologies Corporation (ZBRA) FY2026 Q2 Balance Sheet
Balance sheet as of 2026-07-04. The chart shows assets, liabilities and equity at that date.
- Assets
- 8,637,000,000 US dollars
- Current assets
- 2,062,000,000 US dollars
- Non-current assets
- 6,575,000,000 US dollars
- Liabilities
- 5,202,000,000 US dollars
- Current liabilities
- 3,998,000,000 US dollars
- Non-current liabilities
- 1,204,000,000 US dollars
- Equity
- 3,435,000,000 US dollars
- Accounts receivable, net of allowances for doubtful accounts of $1 million each as of July 4, 2026 and December 31, 2025
- 990,000,000 US dollars
- Inventories, net
- 733,000,000 US dollars
- Cash and cash equivalents
- 157,000,000 US dollars
- Prepaid expenses and other current assets
- 126,000,000 US dollars
- Income tax receivable
- 56,000,000 US dollars
- Goodwill
- 4,701,000,000 US dollars
- Other intangibles, net
- 725,000,000 US dollars
- Deferred income taxes
- 396,000,000 US dollars
- Property, plant and equipment, net
- 346,000,000 US dollars
- Other long-term assets
- 239,000,000 US dollars
- Right-of-use lease assets
- 168,000,000 US dollars
- Current portion of long-term debt
- 2,275,000,000 US dollars
- Accounts payable
- 738,000,000 US dollars
- Accrued liabilities
- 506,000,000 US dollars
- Deferred revenue
- 444,000,000 US dollars
- Income taxes payable
- 35,000,000 US dollars
- Long-term debt
- 493,000,000 US dollars
- Long-term deferred revenue
- 391,000,000 US dollars
- Long-term lease liabilities
- 156,000,000 US dollars
- Other long-term liabilities
- 133,000,000 US dollars
- Deferred income taxes
- 31,000,000 US dollars
- Retained earnings
- 5,647,000,000 US dollars
- Additional paid-in capital
- 882,000,000 US dollars
- Class A common stock, $.01 par value; authorized 150,000,000 shares; issued 72,151,857 shares
- 1,000,000 US dollars
- Preferred stock, $.01 par value; authorized 10,000,000 shares; none issued
- 0 US dollars
- Treasury stock at cost, 24,762,921 and 22,558,911 shares as of July 4, 2026 and December 31, 2025, respectively
- negative 3,057,000,000 US dollars
- Accumulated other comprehensive loss
- negative 38,000,000 US dollars
- Gross equity (calculated)
- 6,530,000,000 US dollars. Net equity plus the magnitudes of its negative contributions equals gross positive equity. The negative contributions enter this reconciliation as add-backs; their filed signs stay negative.
Chart connections
- Assets equal liabilities plus consolidated equity. Consolidated equity includes noncontrolling interests when reported.
- Treasury shares and other negative equity contributions reduce equity.
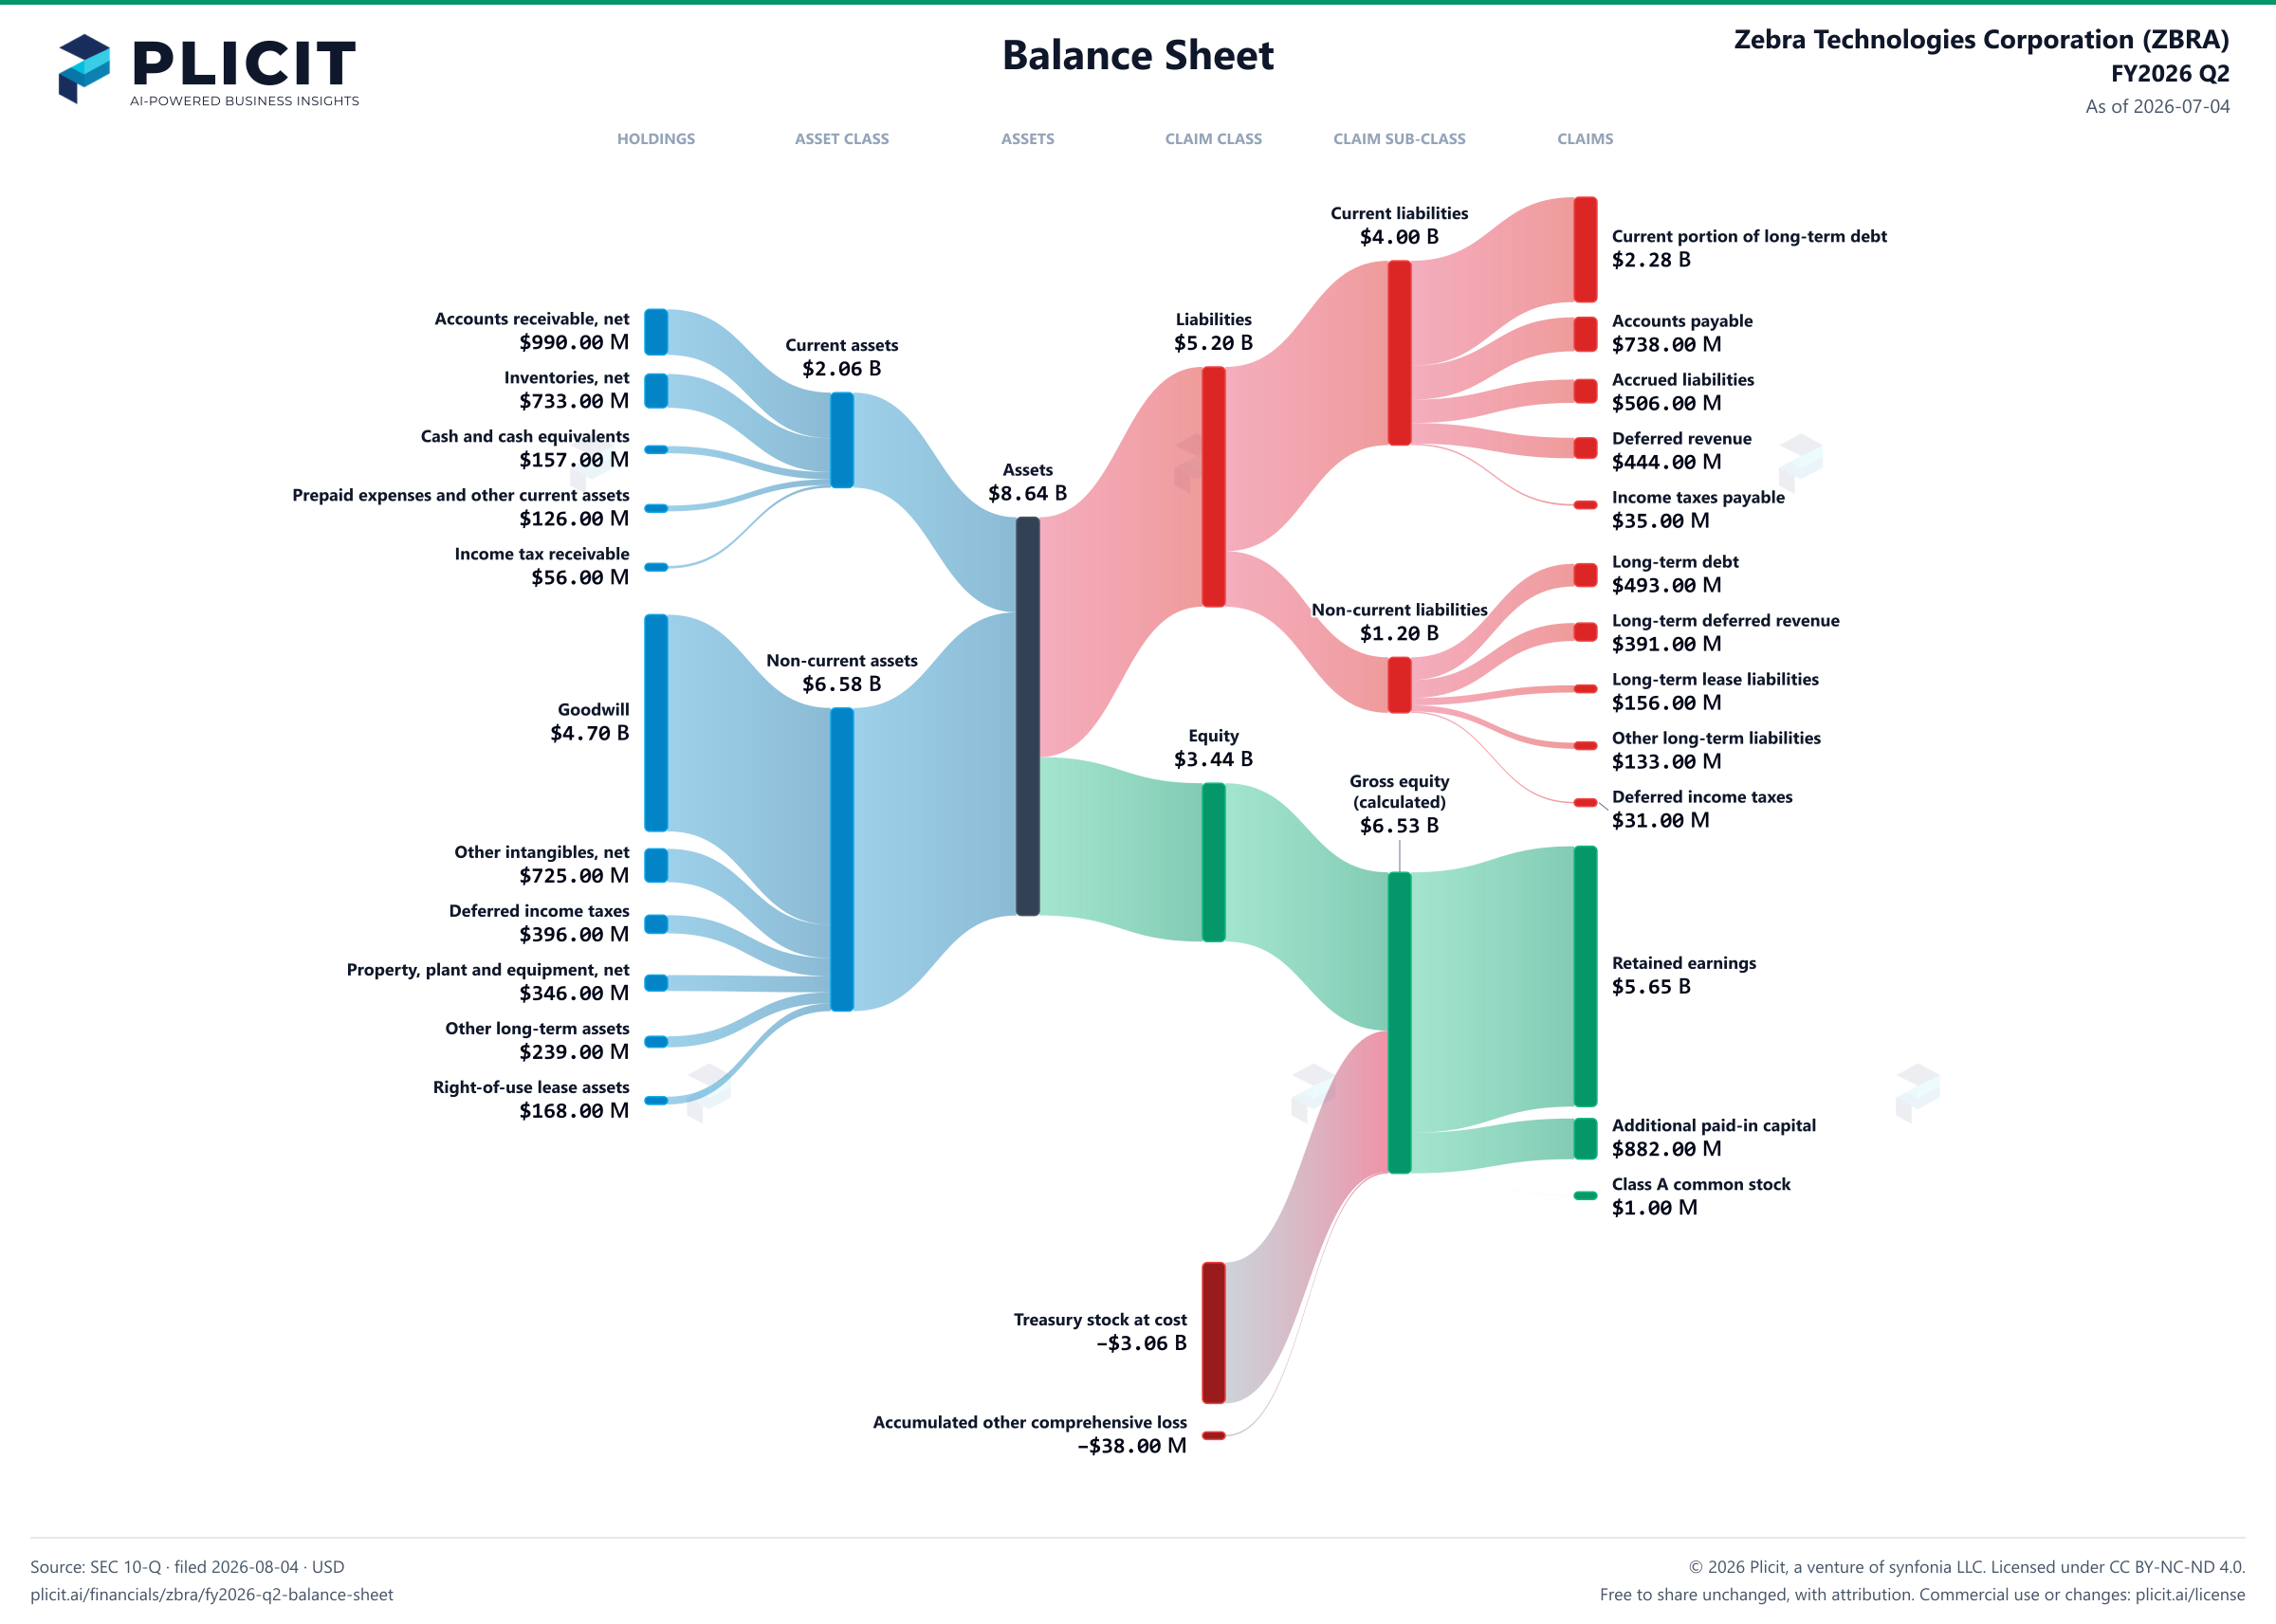
Free to share unchanged, with credit to Plicit.ai · CC BY-NC-ND 4.0Download PNG
Product waitlist
Health Check and Teardown for your own company
A health check uncovers insights of your private books, not a public ticker. Join this list to get notified as soon as we go-live!