
Zoom Communications, Inc. (ZM) FY2026 Q3 Balance Sheet

Balance Sheet

As of 2025-10-31

Swipe to see the full flow
Zoom Communications, Inc. (ZM) FY2026 Q3 Balance SheetBalance sheet as of 2025-10-31. The chart shows assets, liabilities and equity at that date.Current liabilities$1.96 BCurrent assets$8.71 BLiabilities$2.10 BAssets$11.39 BNon-current liabilities$144.55 MEquity$9.29 BNon-current assets$2.68 BHOLDINGSASSET CLASSASSETSCLAIM CLASSCLAIM SUB-CLASSCLAIMSMarketable securitiesCash and cash equivalentsAccounts receivable, net of allowances of $18,128 and $22,078 as of October 31, 2025 and January 31, 2025, respectivelyPrepaid expenses and other current assetsDeferred contract acquisition costs, currentStrategic investmentsDeferred tax assetsGoodwillProperty and equipment, netOther assets, noncurrentDeferred contract acquisition costs, noncurrentOperating lease right-of-use assetsDeferred revenue, currentAccrued expenses and other current liabilitiesAccounts payableOther liabilities, noncurrentOperating lease liabilities, noncurrentDeferred revenue, noncurrentRetained earningsAdditional paid-in capitalAccumulated other comprehensive incomeCommon stock, $0.001 par value per share, 2,000,000,000 Class A shares authorized as of October 31, 2025 and January 31, 2025; 266,345,564 and 263,113,866 shares issued and outstanding as of October 31, 2025 and January 31, 2025, respectively; 300,000,000 Class B shares authorized as of October 31, 2025 and January 31, 2025; 30,678,509 and 42,626,998 shares issued and outstanding as of October 31, 2025 and January 31, 2025, respectivelyCurrent assetsNon-current assetsAssetsCurrent liabilitiesNon-current liabilitiesLiabilitiesEquityCurrent liabilitiesCurrent liabilities$1.96 BCurrent assetsCurrent assets$8.71 BDeferred revenue, currentDeferred revenue, current$1.43 BAccrued expenses and other current liabilitiesAccrued expenses and other current liabilities$514.78 MLiabilitiesLiabilities$2.10 BMarketable securitiesMarketable securities$6.73 BAccounts payableAccounts payable$12.84 MAssetsAssets$11.39 BOther liabilities, noncurrentOther liabilities, noncurrent$103.79 MNon-current liabilitiesNon-current liabilities$144.55 MCash and cash equivalentsCash and cash equivalents$1.22 BOperating lease liabilities, noncurrentOperating lease liabilities, noncurrent$28.07 MAccounts receivable, net of allowances of $18,128 and $22,078 as of October 31, 2025 and January 31, 2025, respectivelyAccounts receivable, net$417.69 MDeferred revenue, noncurrentDeferred revenue, noncurrent$12.68 MEquityEquity$9.29 BPrepaid expenses and other current assetsPrepaid expenses and other current assets$178.92 MDeferred contract acquisition costs, currentDeferred contract acquisition costs, current$175.05 MRetained earningsRetained earnings$5.03 BStrategic investmentsStrategic investments$1.05 BDeferred tax assetsDeferred tax assets$746.40 MNon-current assetsNon-current assets$2.68 BGoodwillGoodwill$307.30 MAdditional paid-in capitalAdditional paid-in capital$4.25 BProperty and equipment, netProperty and equipment, net$284.85 MOther assets, noncurrentOther assets, noncurrent$125.51 MAccumulated other comprehensive incomeAccumulated other comprehensive income$10.36 MDeferred contract acquisition costs, noncurrentDeferred contract acquisition costs, noncurrent$118.32 MCommon stock, $0.001 par value per share, 2,000,000,000 Class A shares authorized as of October 31, 2025 and January 31, 2025; 266,345,564 and 263,113,866 shares issued and outstanding as of October 31, 2025 and January 31, 2025, respectively; 300,000,000 Class B shares authorized as of October 31, 2025 and January 31, 2025; 30,678,509 and 42,626,998 shares issued and outstanding as of October 31, 2025 and January 31, 2025, respectivelyCommon stock$296.00 KOperating lease right-of-use assetsOperating lease right-of-use assets$40.87 M
Chart details

Zoom Communications, Inc. (ZM) FY2026 Q3 Balance Sheet

Balance sheet as of 2025-10-31. The chart shows assets, liabilities and equity at that date.

Assets
11,390,811,000 US dollars
Current assets
8,714,967,000 US dollars
Non-current assets
2,675,844,000 US dollars
Liabilities
2,103,971,000 US dollars
Current liabilities
1,959,423,000 US dollars
Non-current liabilities
144,548,000 US dollars
Equity
9,286,840,000 US dollars
Marketable securities
6,727,428,000 US dollars
Cash and cash equivalents
1,215,877,000 US dollars
Accounts receivable, net of allowances of $18,128 and $22,078 as of October 31, 2025 and January 31, 2025, respectively
417,693,000 US dollars
Prepaid expenses and other current assets
178,922,000 US dollars
Deferred contract acquisition costs, current
175,047,000 US dollars
Strategic investments
1,052,604,000 US dollars
Deferred tax assets
746,400,000 US dollars
Goodwill
307,295,000 US dollars
Property and equipment, net
284,851,000 US dollars
Other assets, noncurrent
125,508,000 US dollars
Deferred contract acquisition costs, noncurrent
118,316,000 US dollars
Operating lease right-of-use assets
40,870,000 US dollars
Deferred revenue, current
1,431,802,000 US dollars
Accrued expenses and other current liabilities
514,778,000 US dollars
Accounts payable
12,843,000 US dollars
Other liabilities, noncurrent
103,794,000 US dollars
Operating lease liabilities, noncurrent
28,072,000 US dollars
Deferred revenue, noncurrent
12,682,000 US dollars
Retained earnings
5,025,586,000 US dollars
Additional paid-in capital
4,250,595,000 US dollars
Accumulated other comprehensive income
10,363,000 US dollars
Common stock, $0.001 par value per share, 2,000,000,000 Class A shares authorized as of October 31, 2025 and January 31, 2025; 266,345,564 and 263,113,866 shares issued and outstanding as of October 31, 2025 and January 31, 2025, respectively; 300,000,000 Class B shares authorized as of October 31, 2025 and January 31, 2025; 30,678,509 and 42,626,998 shares issued and outstanding as of October 31, 2025 and January 31, 2025, respectively
296,000 US dollars

Chart connections

  • Assets equal liabilities plus consolidated equity. Consolidated equity includes noncontrolling interests when reported.
  • Treasury shares and other negative equity contributions reduce equity.
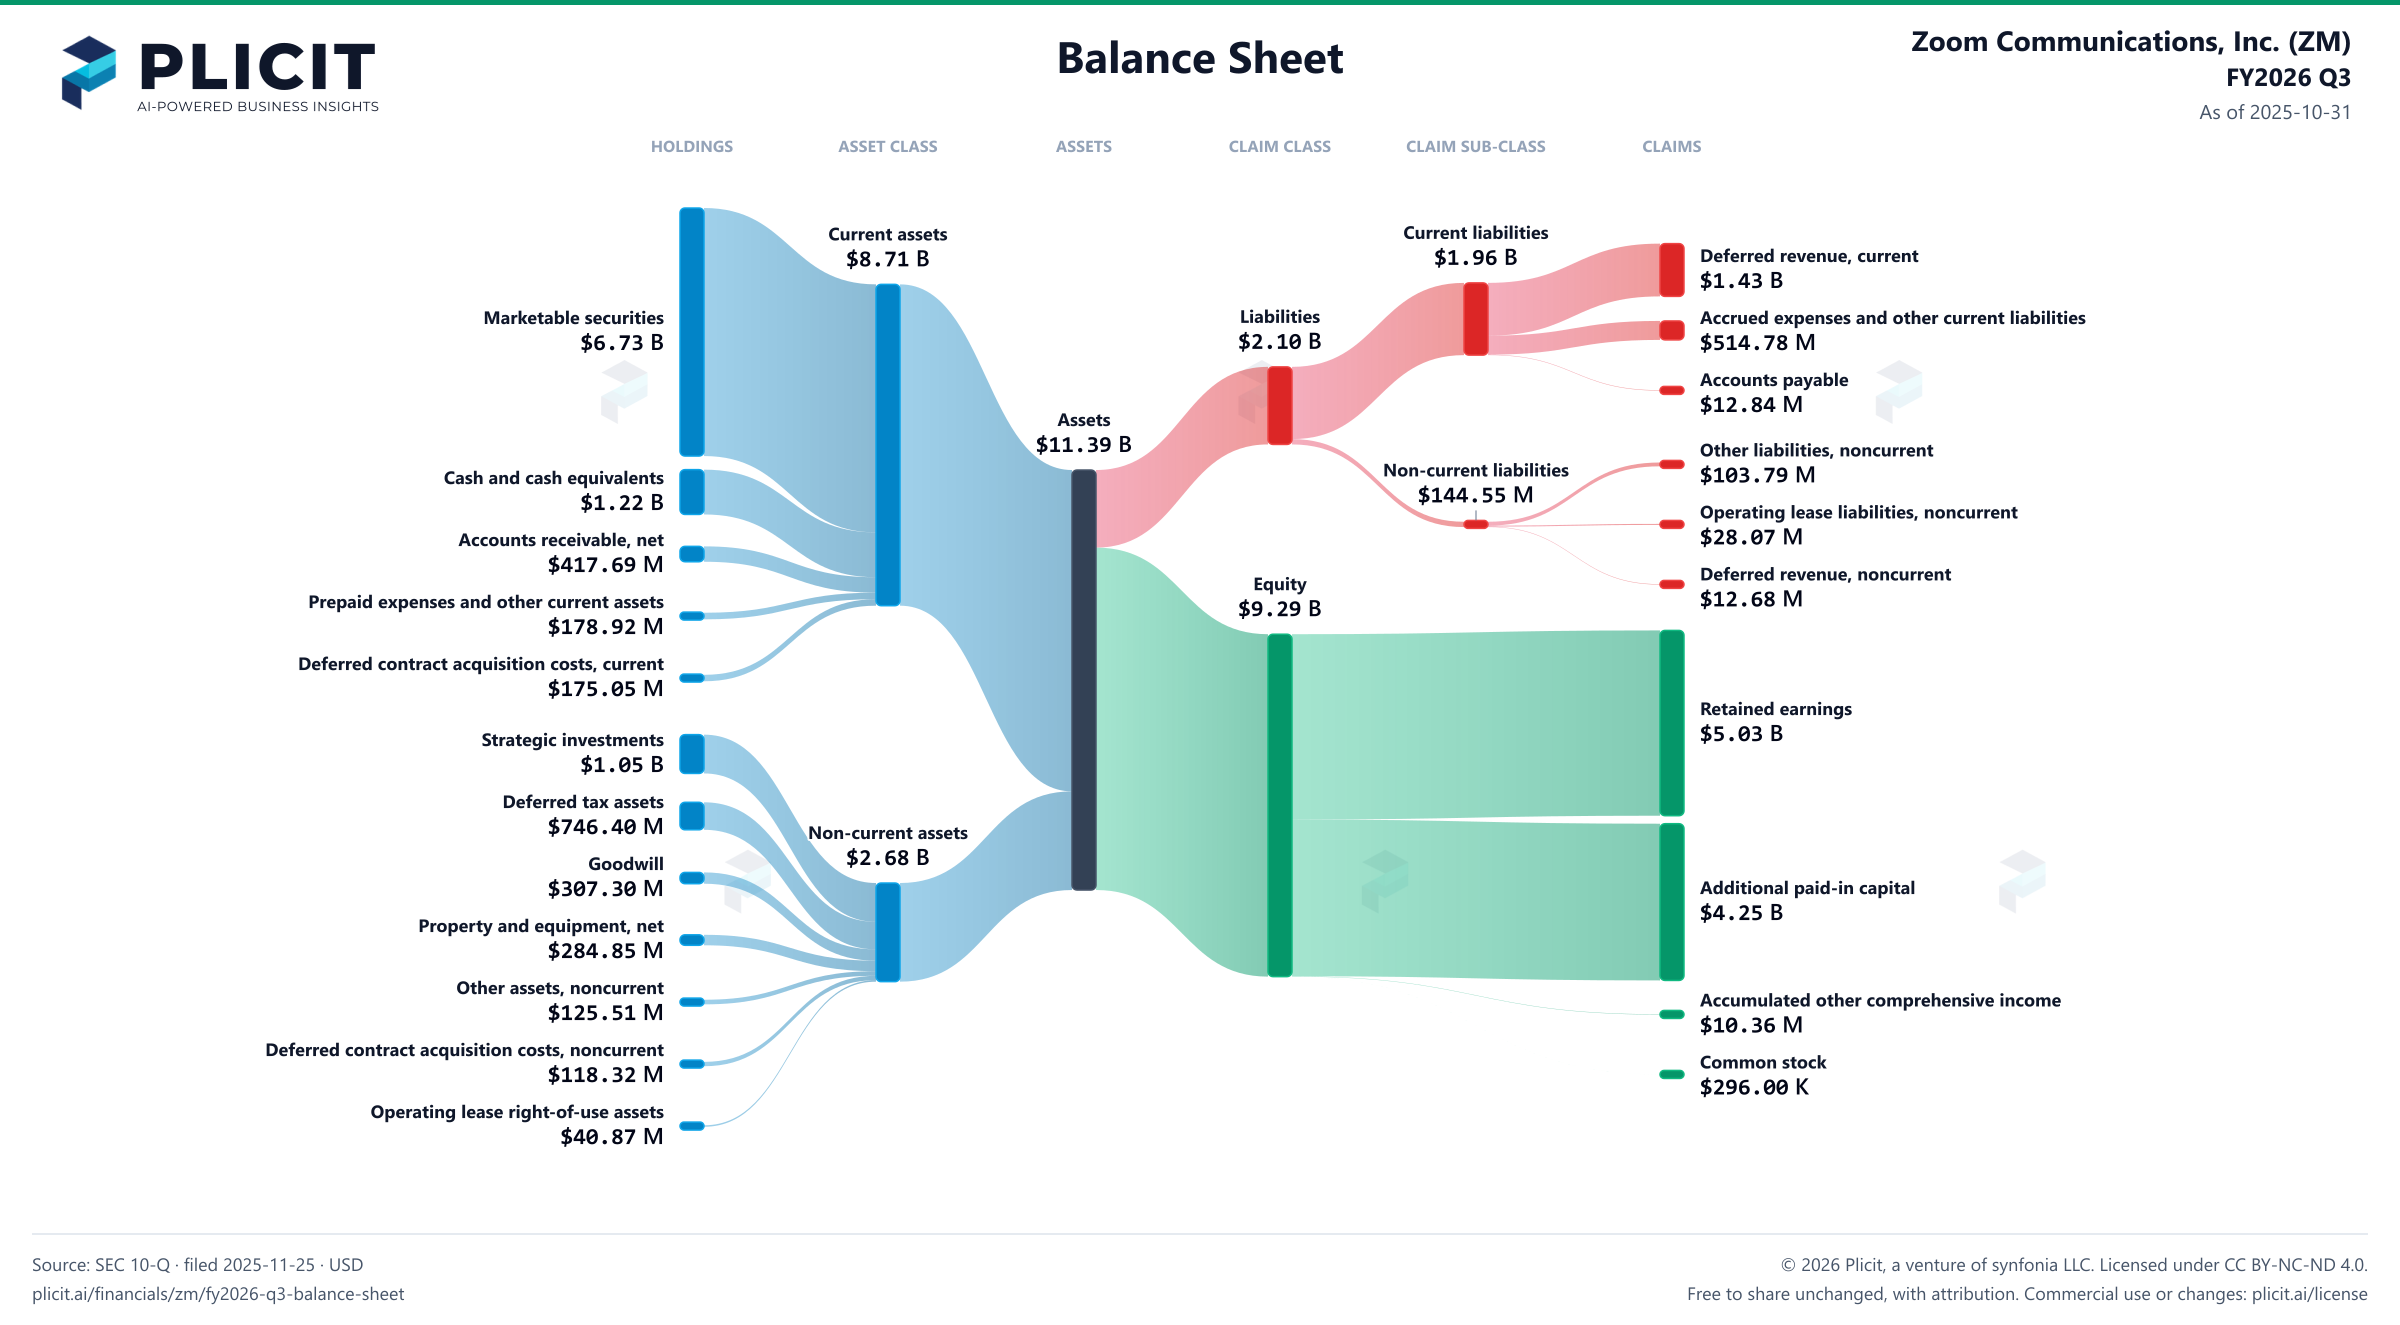
Zoom Communications, Inc. (ZM) FY2026 Q3 Balance Sheet Sankey chart
Free to share unchanged, with credit to Plicit.ai · CC BY-NC-ND 4.0Download PNG

Newsletter

Get the teardowns by email

Subscribe if you want the public-company teardowns in your inbox when they're released.

Product waitlist

Health Check and Teardown for your own company

A health check uncovers insights of your private books, not a public ticker. Join this list to get notified as soon as we go-live!