
ASBURY AUTOMOTIVE GROUP, INC. (ABG) FY2026 Q2 P&L / Income Statement
Published Source: Form 10-Q on SEC EDGAR filed (opens in a new tab)
Revenue by Business Segment (4 categories)
Swipe to see the full flow
Chart details
ASBURY AUTOMOTIVE GROUP, INC. (ABG) FY2026 Q2 P&L / Income Statement
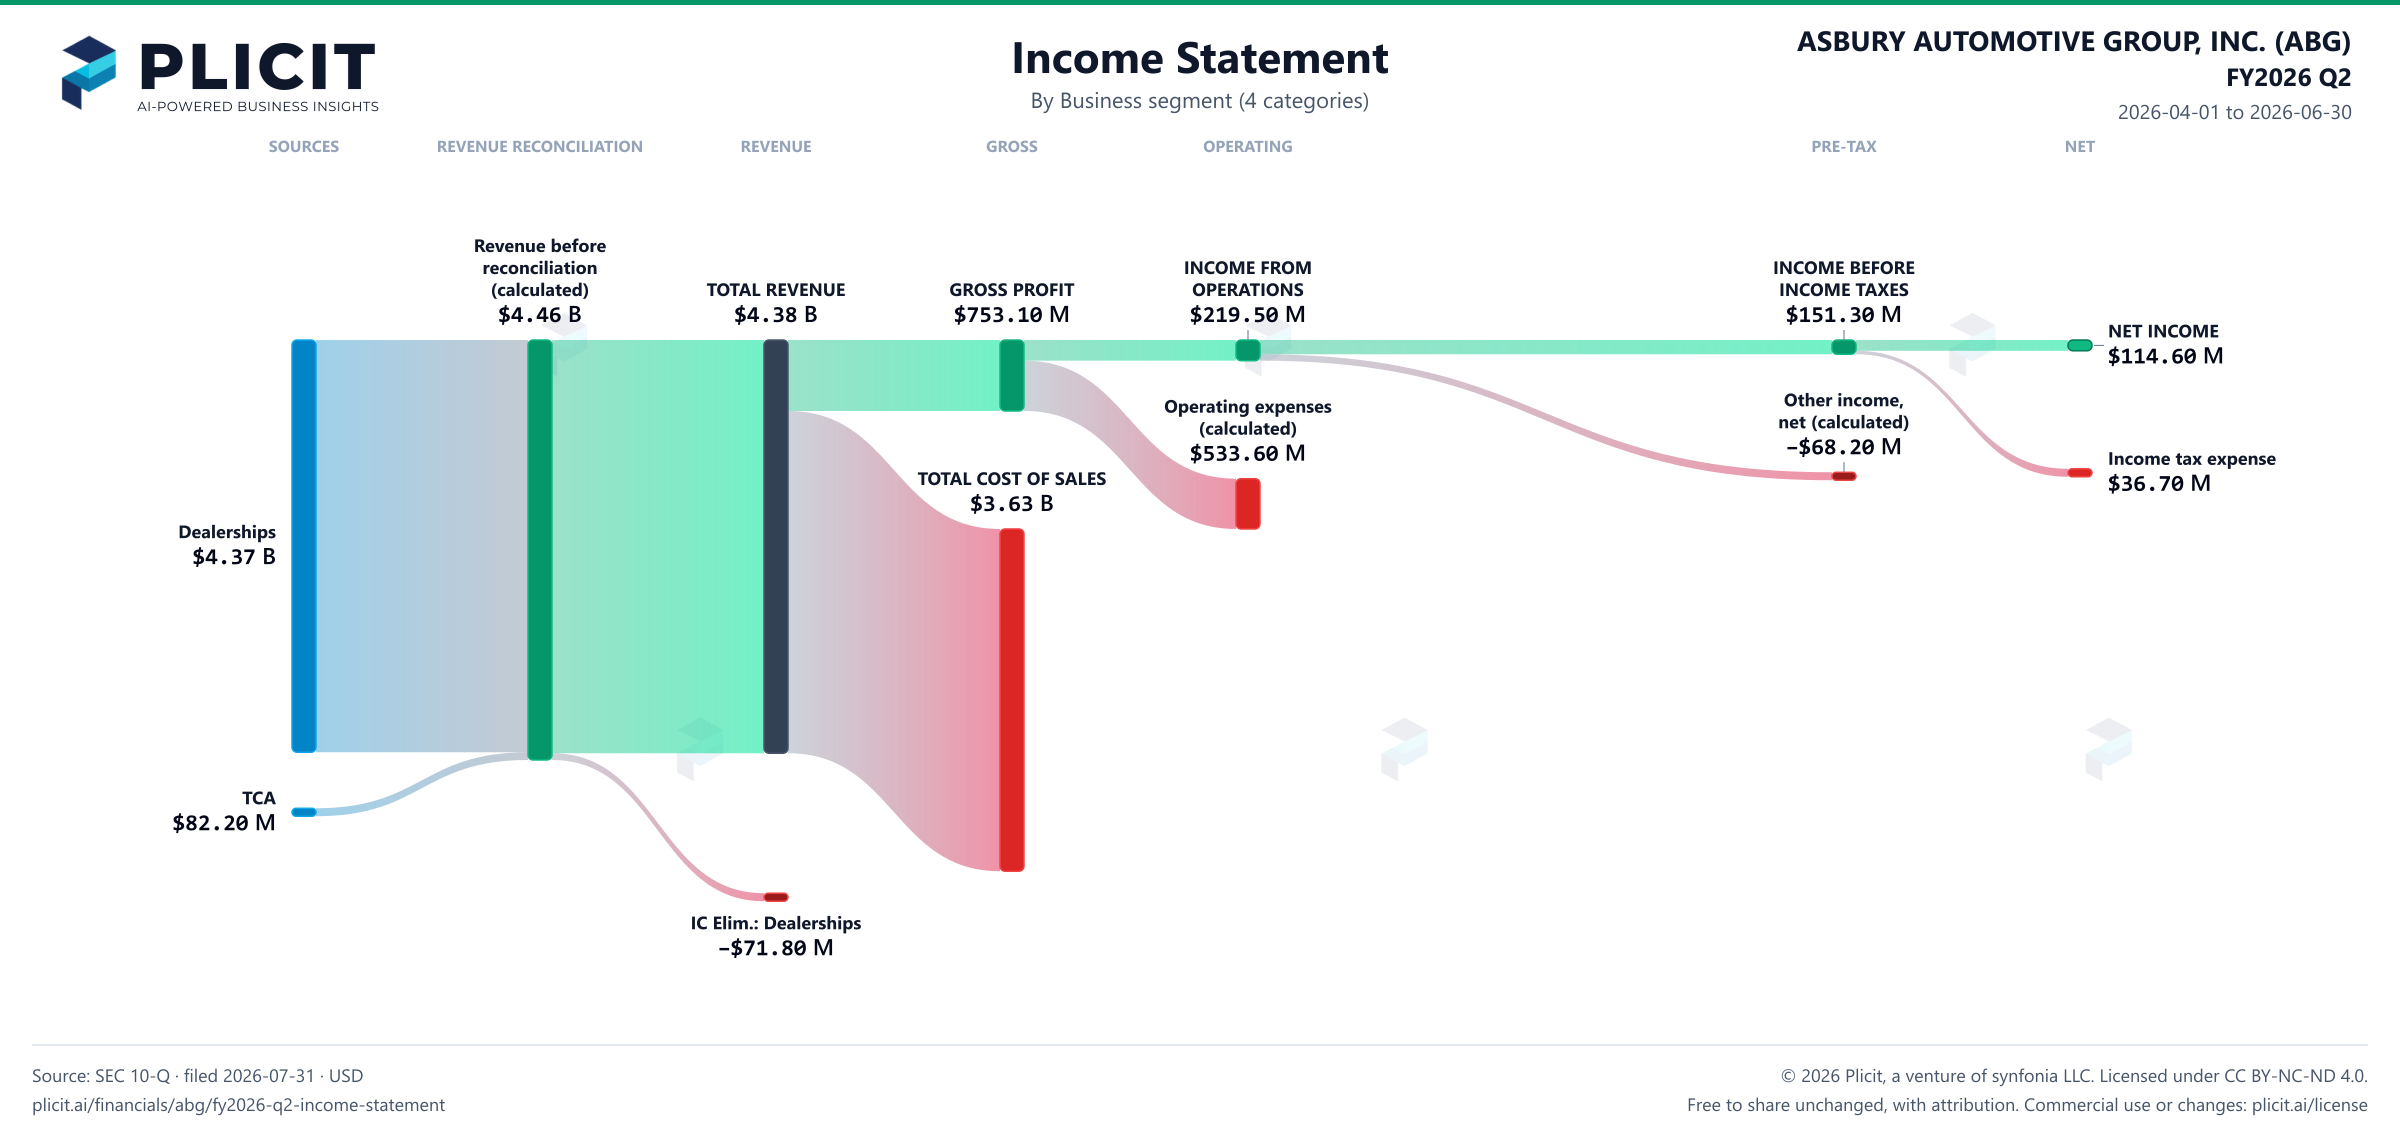
Income statement for 2026-04-01 through 2026-06-30. View: Business segment (4 categories). Revenue uses this breakdown; costs and expenses retain the consolidated categories.
- TOTAL REVENUE
- 4,384,600,000 US dollars
- TOTAL COST OF SALES
- 3,631,500,000 US dollars
- GROSS PROFIT
- 753,100,000 US dollars
- Operating expenses (calculated)
- 533,600,000 US dollars
- INCOME FROM OPERATIONS
- 219,500,000 US dollars
- Other income (expense), net (calculated)
- negative 68,200,000 US dollars
- INCOME BEFORE INCOME TAXES
- 151,300,000 US dollars
- Income tax expense
- 36,700,000 US dollars
- NET INCOME
- 114,600,000 US dollars
- Dealerships
- 4,374,200,000 US dollars
- TCA
- 82,200,000 US dollars
- Selling, general, and administrative
- 506,400,000 US dollars. Source detail retained; this breakdown has not reconciled exactly and is not drawn.
- Depreciation and amortization
- 23,100,000 US dollars. Source detail retained; this breakdown has not reconciled exactly and is not drawn.
- Asset impairments
- 4,200,000 US dollars. Source detail retained; this breakdown has not reconciled exactly and is not drawn.
- Revenue before reconciliation (calculated)
- 4,456,400,000 US dollars. Sum of the reported revenue categories before the separately reported reconciliation.
- Dealerships - Intersegment Eliminations
- negative 71,800,000 US dollars. Reported reconciliation to consolidated revenue.
- TCA - Intersegment Eliminations
- 0 US dollars. Reported reconciliation to consolidated revenue.
- Dealerships costs (calculated)
- 4,177,300,000 US dollars. Segment revenue less segment operating income; it includes cost of revenue and operating expenses.
- TCA costs (calculated)
- 61,100,000 US dollars. Segment revenue less segment operating income; it includes cost of revenue and operating expenses.
- Reconciling items (calculated)
- negative 73,300,000 US dollars. Segment revenue less segment operating income; it includes cost of revenue and operating expenses.
Chart connections
- Revenue less cost of revenue equals gross profit; gross profit less operating expenses equals operating income.
- Operating income plus other income or expense equals income before tax. Income before tax less income tax expense or benefit equals net income.
- Reported revenue categories plus the separately reported signed reconciliation equals consolidated revenue.
Free to share unchanged, with credit to Plicit.ai · CC BY-NC-ND 4.0Download PNG
Product waitlist
Health Check and Teardown for your own company
A health check uncovers insights of your private books, not a public ticker. Join this list to get notified as soon as we go-live!