
ASBURY AUTOMOTIVE GROUP, INC. (ABG) FY2026 Q3 Balance Sheet

Published Source: Form 10-Q on SEC EDGAR filed (opens in a new tab)

Key Takeaways

  • Cash of $84.50 M covers 19% of the $439.20 M of debt due within a year.
  • A $401.70 M real estate facility matures in December 2026; the refinance is only expected.
  • Total debt fell to $3.37 B from $3.57 B, yet goodwill still makes up 20% of assets.
  • Customers prepaid $891.30 M for products and services not yet delivered; that cash is in hand.
  • Liabilities of $7.32 B outweigh the $4.03 B of owners' equity, so creditors fund most of the company.

The Unvarnished Truth

Only $84.50 M in cash against $439.20 M due within a year

Asbury Automotive had $84.50 M of cash on September 30, 2026, and $439.20 M of its debt fell due within a year. Cash covered 19% of that bill. The 2021 Real Estate Facility, $401.70 M at quarter-end, is scheduled to mature in December 2026, which puts it inside that $439.20 M. Management says it expects to refinance the full principal before that facility expires. Nothing on the balance sheet closes that gap by itself.

Why so little cash? Part of the answer is where it sits. The liquidity section says $38.90 M of it is held by TCA, the unit that provides finance and insurance products, and the rest sits outside that unit. The headline liquidity figure is bigger: the filing reports $1.03 B of total available liquidity, but $794.30 M of that is undrawn room on the revolving credit facility, not cash. Debt is shrinking, though: total long-term debt including the current portion stood at $3.37 B, against $3.57 B at the last year-end.

What it means for a reader: the company says it met every covenant at quarter-end, so the loan terms are not the immediate problem. The timing is the problem. Cash on hand of $84.50 M is the only cushion the balance sheet shows for that bill. If the December refinance closes on time, the $439.20 M is a maturity schedule; if it slips, it would have to be paid from cash still to come in. Will the refinance close before December, and on what terms?
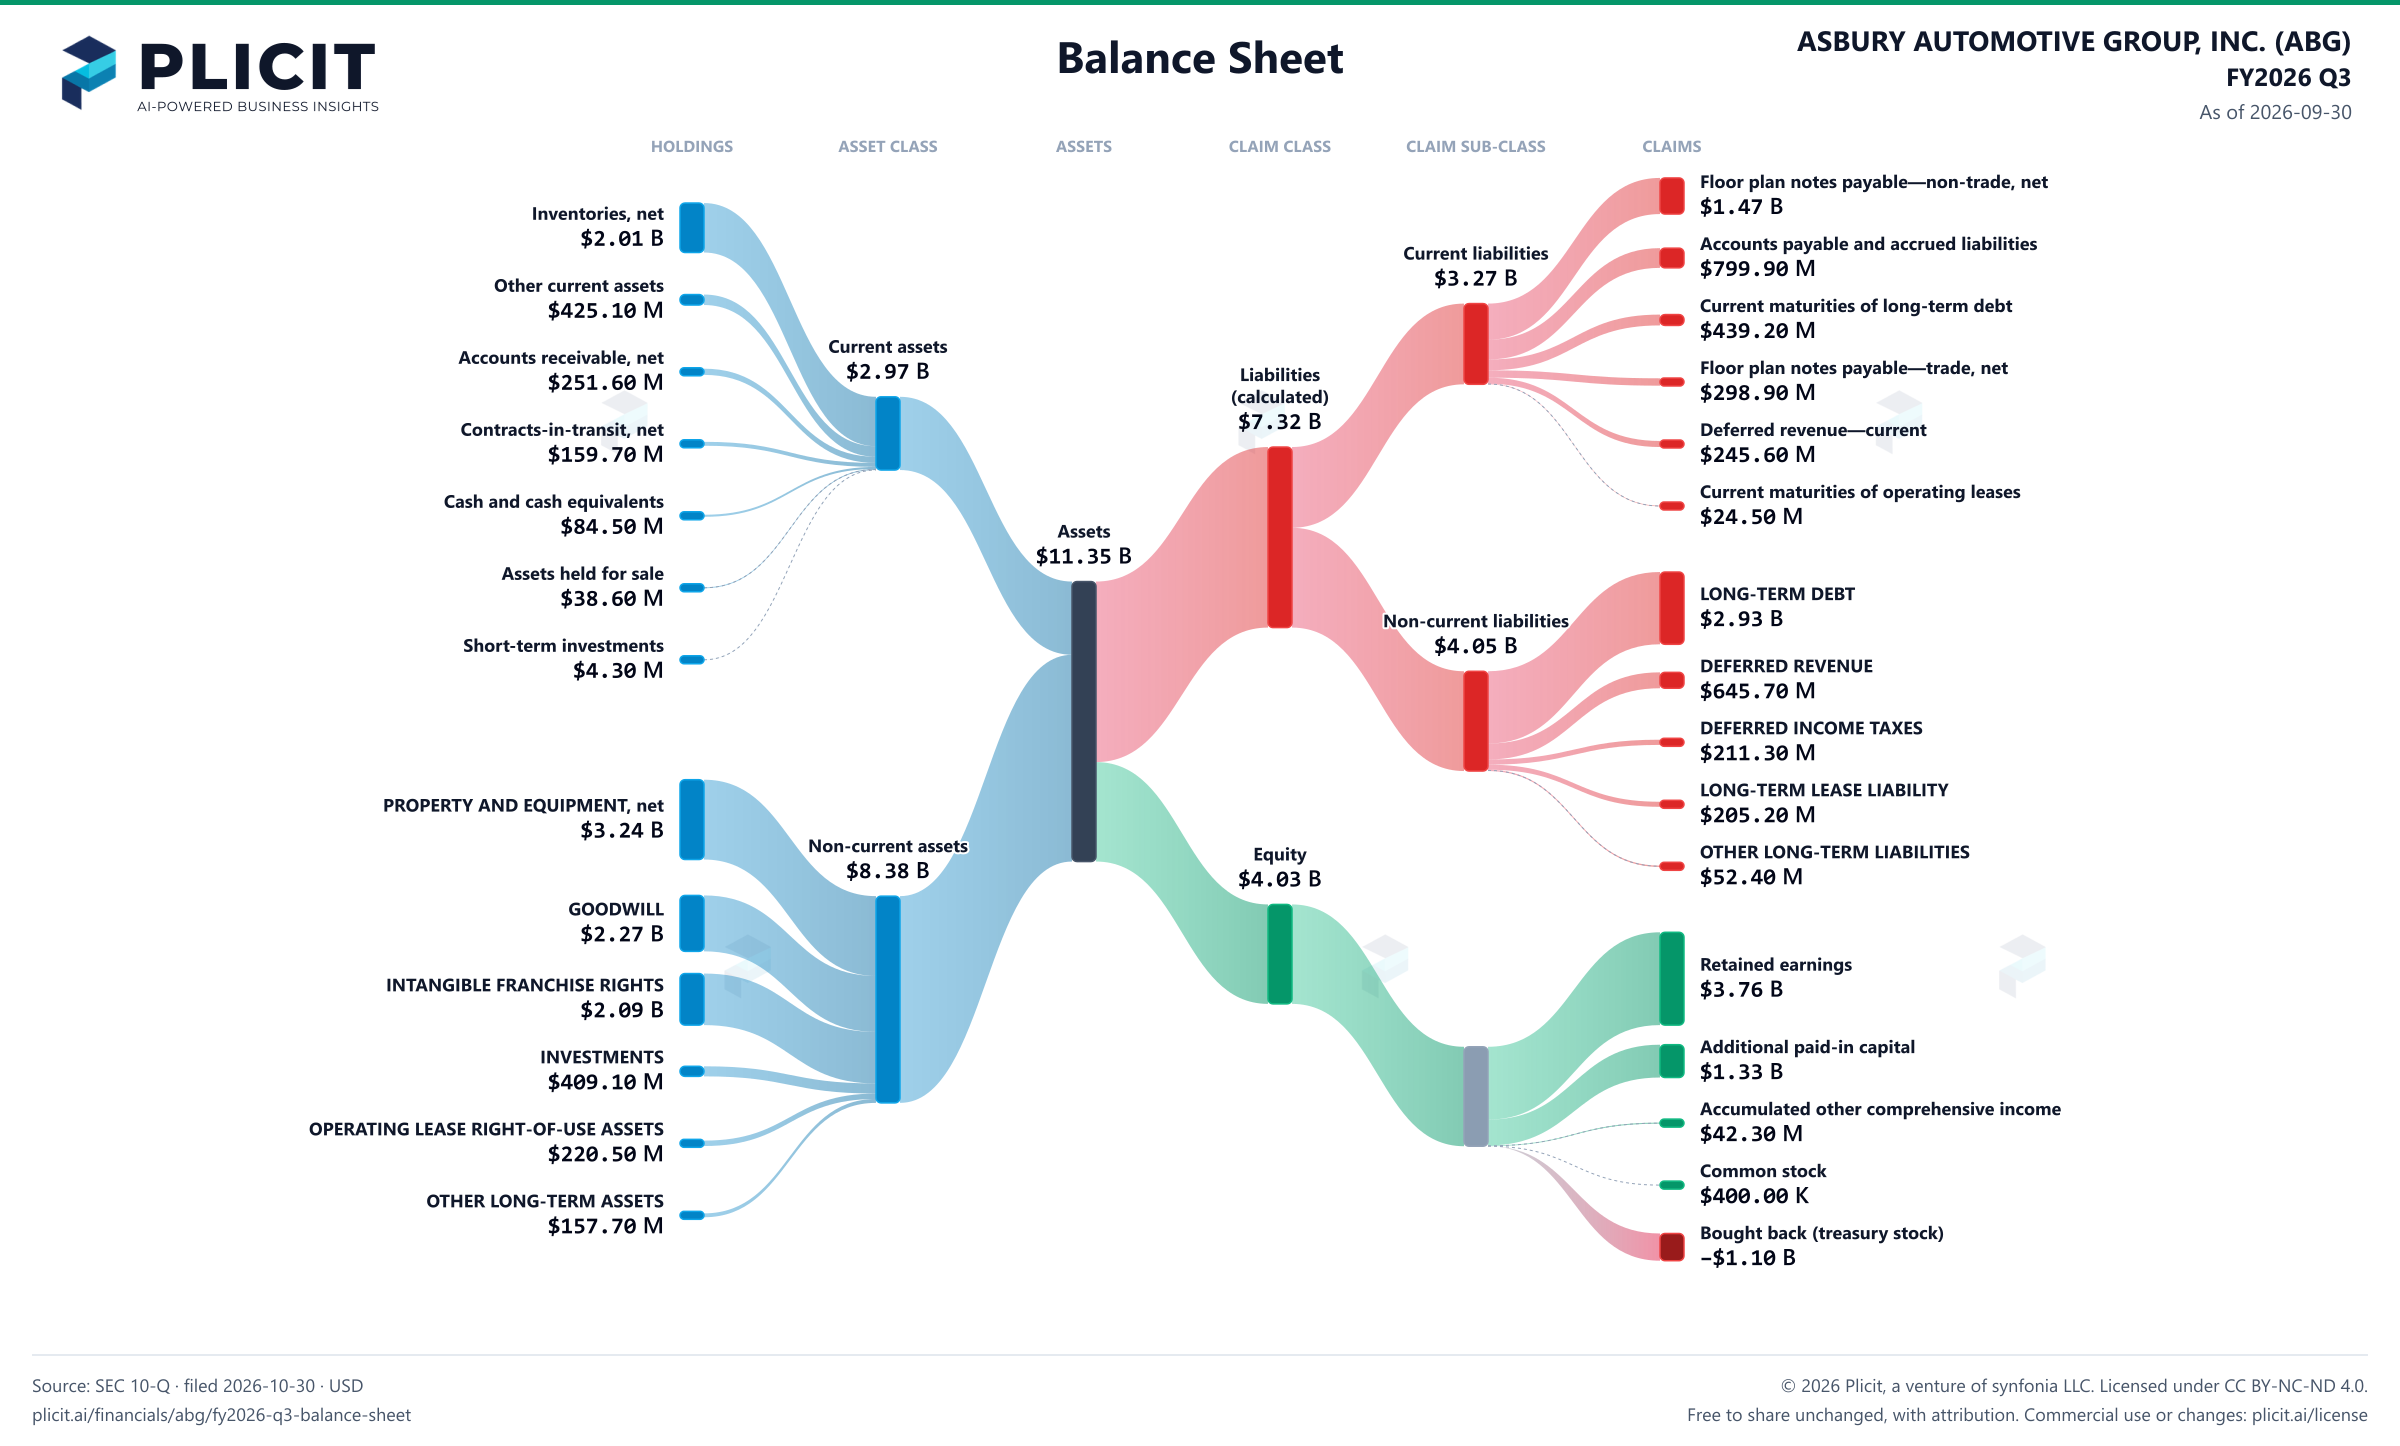
As of 2026-09-30

Balance Sheet

Swipe to see the full flow
ASBURY AUTOMOTIVE GROUP, INC. (ABG) FY2026 Q3 Balance SheetBalance sheet as of 2026-09-30. The chart shows assets, liabilities and equity at that date.Current liabilities$3.27 BCurrent assets$2.97 BLiabilities(calculated)$7.32 BAssets$11.35 BNon-current liabilities$4.05 BNon-current assets$8.38 BEquity$4.03 BHOLDINGSASSET CLASSASSETSCLAIM CLASSCLAIM SUB-CLASSCLAIMSInventories, netOther current assetsAccounts receivable, netContracts-in-transit, netCash and cash equivalentsAssets held for saleShort-term investmentsPROPERTY AND EQUIPMENT, netGOODWILLINTANGIBLE FRANCHISE RIGHTSINVESTMENTSOPERATING LEASE RIGHT-OF-USE ASSETSOTHER LONG-TERM ASSETSFloor plan notes payable—non-trade, netAccounts payable and accrued liabilitiesCurrent maturities of long-term debtFloor plan notes payable—trade, netDeferred revenue—currentCurrent maturities of operating leasesLONG-TERM DEBTDEFERRED REVENUEDEFERRED INCOME TAXESLONG-TERM LEASE LIABILITYOTHER LONG-TERM LIABILITIESRetained earningsAdditional paid-in capitalAccumulated other comprehensive incomeCommon stock, $.01 par value; 90,000,000 shares authorized; 40,103,893 and 41,338,419 shares issued, including shares held in treasury, respectivelyTreasury stock, at cost; 22,149,597 and 22,109,690 shares, respectivelyCurrent assetsNon-current assetsAssetsCurrent liabilitiesNon-current liabilitiesLiabilities (calculated)EquityEquityFloor plan notes payable—non-trade, netFloor plan notes payable—non-trade, net$1.47 BInventories, netInventories, net$2.01 BAccounts payable and accrued liabilitiesAccounts payable and accrued liabilities$799.90 MCurrent liabilitiesCurrent liabilities$3.27 BOther current assetsOther current assets$425.10 MCurrent maturities of long-term debtCurrent maturities of long-term debt$439.20 MCurrent assetsCurrent assets$2.97 BAccounts receivable, netAccounts receivable, net$251.60 MFloor plan notes payable—trade, netFloor plan notes payable—trade, net$298.90 MLiabilities (calculated)Liabilities(calculated)$7.32 BContracts-in-transit, netContracts-in-transit, net$159.70 MDeferred revenue—currentDeferred revenue—current$245.60 MCurrent maturities of operating leasesCurrent maturities of operating leases$24.50 MCash and cash equivalentsCash and cash equivalents$84.50 MAssetsAssets$11.35 BAssets held for saleAssets held for sale$38.60 MLONG-TERM DEBTLONG-TERM DEBT$2.93 BNon-current liabilitiesNon-current liabilities$4.05 BShort-term investmentsShort-term investments$4.30 MDEFERRED REVENUEDEFERRED REVENUE$645.70 MDEFERRED INCOME TAXESDEFERRED INCOME TAXES$211.30 MLONG-TERM LEASE LIABILITYLONG-TERM LEASE LIABILITY$205.20 MPROPERTY AND EQUIPMENT, netPROPERTY AND EQUIPMENT, net$3.24 BNon-current assetsNon-current assets$8.38 BOTHER LONG-TERM LIABILITIESOTHER LONG-TERM LIABILITIES$52.40 MEquityEquity$4.03 BGOODWILLGOODWILL$2.27 BRetained earningsRetained earnings$3.76 BINTANGIBLE FRANCHISE RIGHTSINTANGIBLE FRANCHISE RIGHTS$2.09 BAdditional paid-in capitalAdditional paid-in capital$1.33 BINVESTMENTSINVESTMENTS$409.10 MAccumulated other comprehensive incomeAccumulated other comprehensive income$42.30 MOPERATING LEASE RIGHT-OF-USE ASSETSOPERATING LEASE RIGHT-OF-USE ASSETS$220.50 MCommon stock, $.01 par value; 90,000,000 shares authorized; 40,103,893 and 41,338,419 shares issued, including shares held in treasury, respectivelyCommon stock$400.00 KOTHER LONG-TERM ASSETSOTHER LONG-TERM ASSETS$157.70 MTreasury stock, at cost; 22,149,597 and 22,109,690 shares, respectivelyBought back (treasury stock)−$1.10 B
Chart details

ASBURY AUTOMOTIVE GROUP, INC. (ABG) FY2026 Q3 Balance Sheet

Balance sheet as of 2026-09-30. The chart shows assets, liabilities and equity at that date.

Assets
11,350,100,000 US dollars
Current assets
2,968,900,000 US dollars
Non-current assets
8,381,200,000 US dollars
Liabilities (calculated)
7,318,600,000 US dollars
Current liabilities
3,273,600,000 US dollars
Non-current liabilities
4,045,000,000 US dollars
Equity
4,031,500,000 US dollars
Inventories, net
2,005,300,000 US dollars
Other current assets
425,100,000 US dollars
Accounts receivable, net
251,600,000 US dollars
Contracts-in-transit, net
159,700,000 US dollars
Cash and cash equivalents
84,500,000 US dollars
Assets held for sale
38,600,000 US dollars
Short-term investments
4,300,000 US dollars
PROPERTY AND EQUIPMENT, net
3,236,000,000 US dollars
GOODWILL
2,267,600,000 US dollars
INTANGIBLE FRANCHISE RIGHTS
2,090,400,000 US dollars
INVESTMENTS
409,100,000 US dollars
OPERATING LEASE RIGHT-OF-USE ASSETS
220,500,000 US dollars
OTHER LONG-TERM ASSETS
157,700,000 US dollars
Floor plan notes payable—non-trade, net
1,465,400,000 US dollars
Accounts payable and accrued liabilities
799,900,000 US dollars
Current maturities of long-term debt
439,200,000 US dollars
Floor plan notes payable—trade, net
298,900,000 US dollars
Deferred revenue—current
245,600,000 US dollars
Current maturities of operating leases
24,500,000 US dollars
Liabilities associated with assets held for sale
0 US dollars
LONG-TERM DEBT
2,930,400,000 US dollars
DEFERRED REVENUE
645,700,000 US dollars
DEFERRED INCOME TAXES
211,300,000 US dollars
LONG-TERM LEASE LIABILITY
205,200,000 US dollars
OTHER LONG-TERM LIABILITIES
52,400,000 US dollars
Retained earnings
3,762,400,000 US dollars
Additional paid-in capital
1,330,800,000 US dollars
Accumulated other comprehensive income
42,300,000 US dollars
Common stock, $.01 par value; 90,000,000 shares authorized; 40,103,893 and 41,338,419 shares issued, including shares held in treasury, respectively
400,000 US dollars
Preferred stock, $.01 par value; 10,000,000 shares authorized; none issued or outstanding
0 US dollars
Treasury stock, at cost; 22,149,597 and 22,109,690 shares, respectively
negative 1,104,300,000 US dollars

Chart connections

  • Assets equal liabilities plus consolidated equity. Consolidated equity includes noncontrolling interests when reported.
  • Treasury shares and other negative equity contributions reduce equity.
  • The filed current assets lines add up to $2,969.10 M and the current assets total is $2,968.90 M; the $0.20 M difference is within the rounding of the filed amounts.
  • The filed non-current assets lines add up to $8,381.30 M and the non-current assets total is $8,381.20 M; the $0.10 M difference is within the rounding of the filed amounts.
  • The filed current liabilities lines add up to $3,273.50 M and the current liabilities total is $3,273.60 M; the $0.10 M difference is within the rounding of the filed amounts.
  • The filed equity lines add up to $4,031.60 M and the equity total is $4,031.50 M; the $0.10 M difference is within the rounding of the filed amounts.
ASBURY AUTOMOTIVE GROUP, INC. (ABG) FY2026 Q3 Balance Sheet Sankey chart
Free to share unchanged, with credit to Plicit.ai · CC BY-NC-ND 4.0Download PNG

Intelligent Insights for Investors

When does Asbury Automotive's debt come due?

$439.20 M of Asbury's $3.37 B of long-term debt, finance leases included, was due within a year on September 30, 2026, against $84.50 M of cash on hand.

Can Asbury Automotive cover the bills due within a year?

Not entirely: for each dollar due within a year, Asbury held $0.91 in cash and assets expected to become cash on September 30, 2026. The rest is met from cash still to come in, or, for customer prepayments, by delivering what was paid for.

How much of Asbury's assets came from buying other businesses?

Goodwill came to $2.27 B on September 30, 2026, or 20% of total assets. Goodwill is the extra a company books when it pays more for a business than the value of what it can count.

What lawsuits or claims could cost Asbury Automotive money?

The Federal Trade Commission dismissed its administrative case over add-on product sales on October 5, 2026, but it can refile the enforcement action. Asbury's own lawsuit against the agency is still pending. The note gives no dollar figure for it, and says there can be no assurance of the outcome.

Intelligent Insights for Lenders

How much room does Asbury Automotive have under its loan terms?

Asbury says it was in compliance with all of its covenants on September 30, 2026. It adds that these financial covenants did not further limit its availability under its other credit facilities. The filing gives no covenant ratio, so the size of the cushion stays unknown.

How much has Asbury Automotive posted in letters of credit and surety bonds?

Asbury had $20.80 M of letters of credit outstanding on September 30, 2026, which its insurance providers require, plus a $25.90 M surety bond line that it counts as off balance sheet.

Intelligent Insights for Customers

How much have customers paid Asbury Automotive in advance?

Customers had paid Asbury $891.30 M in advance on September 30, 2026, for products and services it has not yet delivered. That money is already in hand; it becomes revenue as Asbury delivers.

Product waitlist

Health Check and Teardown for your own company

A health check uncovers insights of your private books, not a public ticker. Join this list to get notified as soon as we go-live!