
ASBURY AUTOMOTIVE GROUP, INC. (ABG) FY2026 Q3 P&L / Income Statement

Published Source: Form 10-Q on SEC EDGAR filed (opens in a new tab)

Key Takeaways

  • Net income of $105.10 M kept a 2% margin on $4.41 B of sales, down from $147.10 M a year earlier.
  • Sales fell 8% from a year earlier, and cost of sales took $83.43 of every $100.
  • Earnings per share fell 22% while net income fell 29%, as the diluted share count dropped 8%.
  • The tax rate fell to 24.4% from 26.5%, which helped profit after tax hold up better.
  • Selling and overhead costs rose to 11.4% of sales from 11.0%, the wrong direction.

The Unvarnished Truth

Profit fell 29%, but per-share profit fell 22% after buybacks

Asbury Automotive still made money. Net income was $105.10 M this quarter, a 2% margin on $4.41 B of sales, down from $147.10 M a year earlier. Sales fell 8% in the same span, and cost of sales took $83.43 of every $100 of sales. Its profit margin, at 2% of sales, is thin for a company of this size. Cost of sales is the biggest number on the page, at $3.68 B for the quarter.

The per-share number fell less than profit did. Earnings per share fell 22% to $5.84, while net income fell 29%. The gap is the share count: the average diluted count dropped 8%, to 18.0 M from 19.6 M. Diluted shares count the shares that options and awards could add, so they are the stricter measure. The filing says it repurchased 1,346,359 shares for $277.60 M in the nine months, and it bought back no stock in the quarter itself.

Two things hold the quarter together: the tax rate and the buybacks. The tax rate fell to 24.4% from 26.5%, so profit after tax fell less than profit before tax. Selling and overhead costs rose to 11.4% of sales from 11.0%, the wrong direction for a company that needs its costs to fall. Will per-share profit keep outrunning profit if the buybacks stop and the tax rate returns to 26.5%?
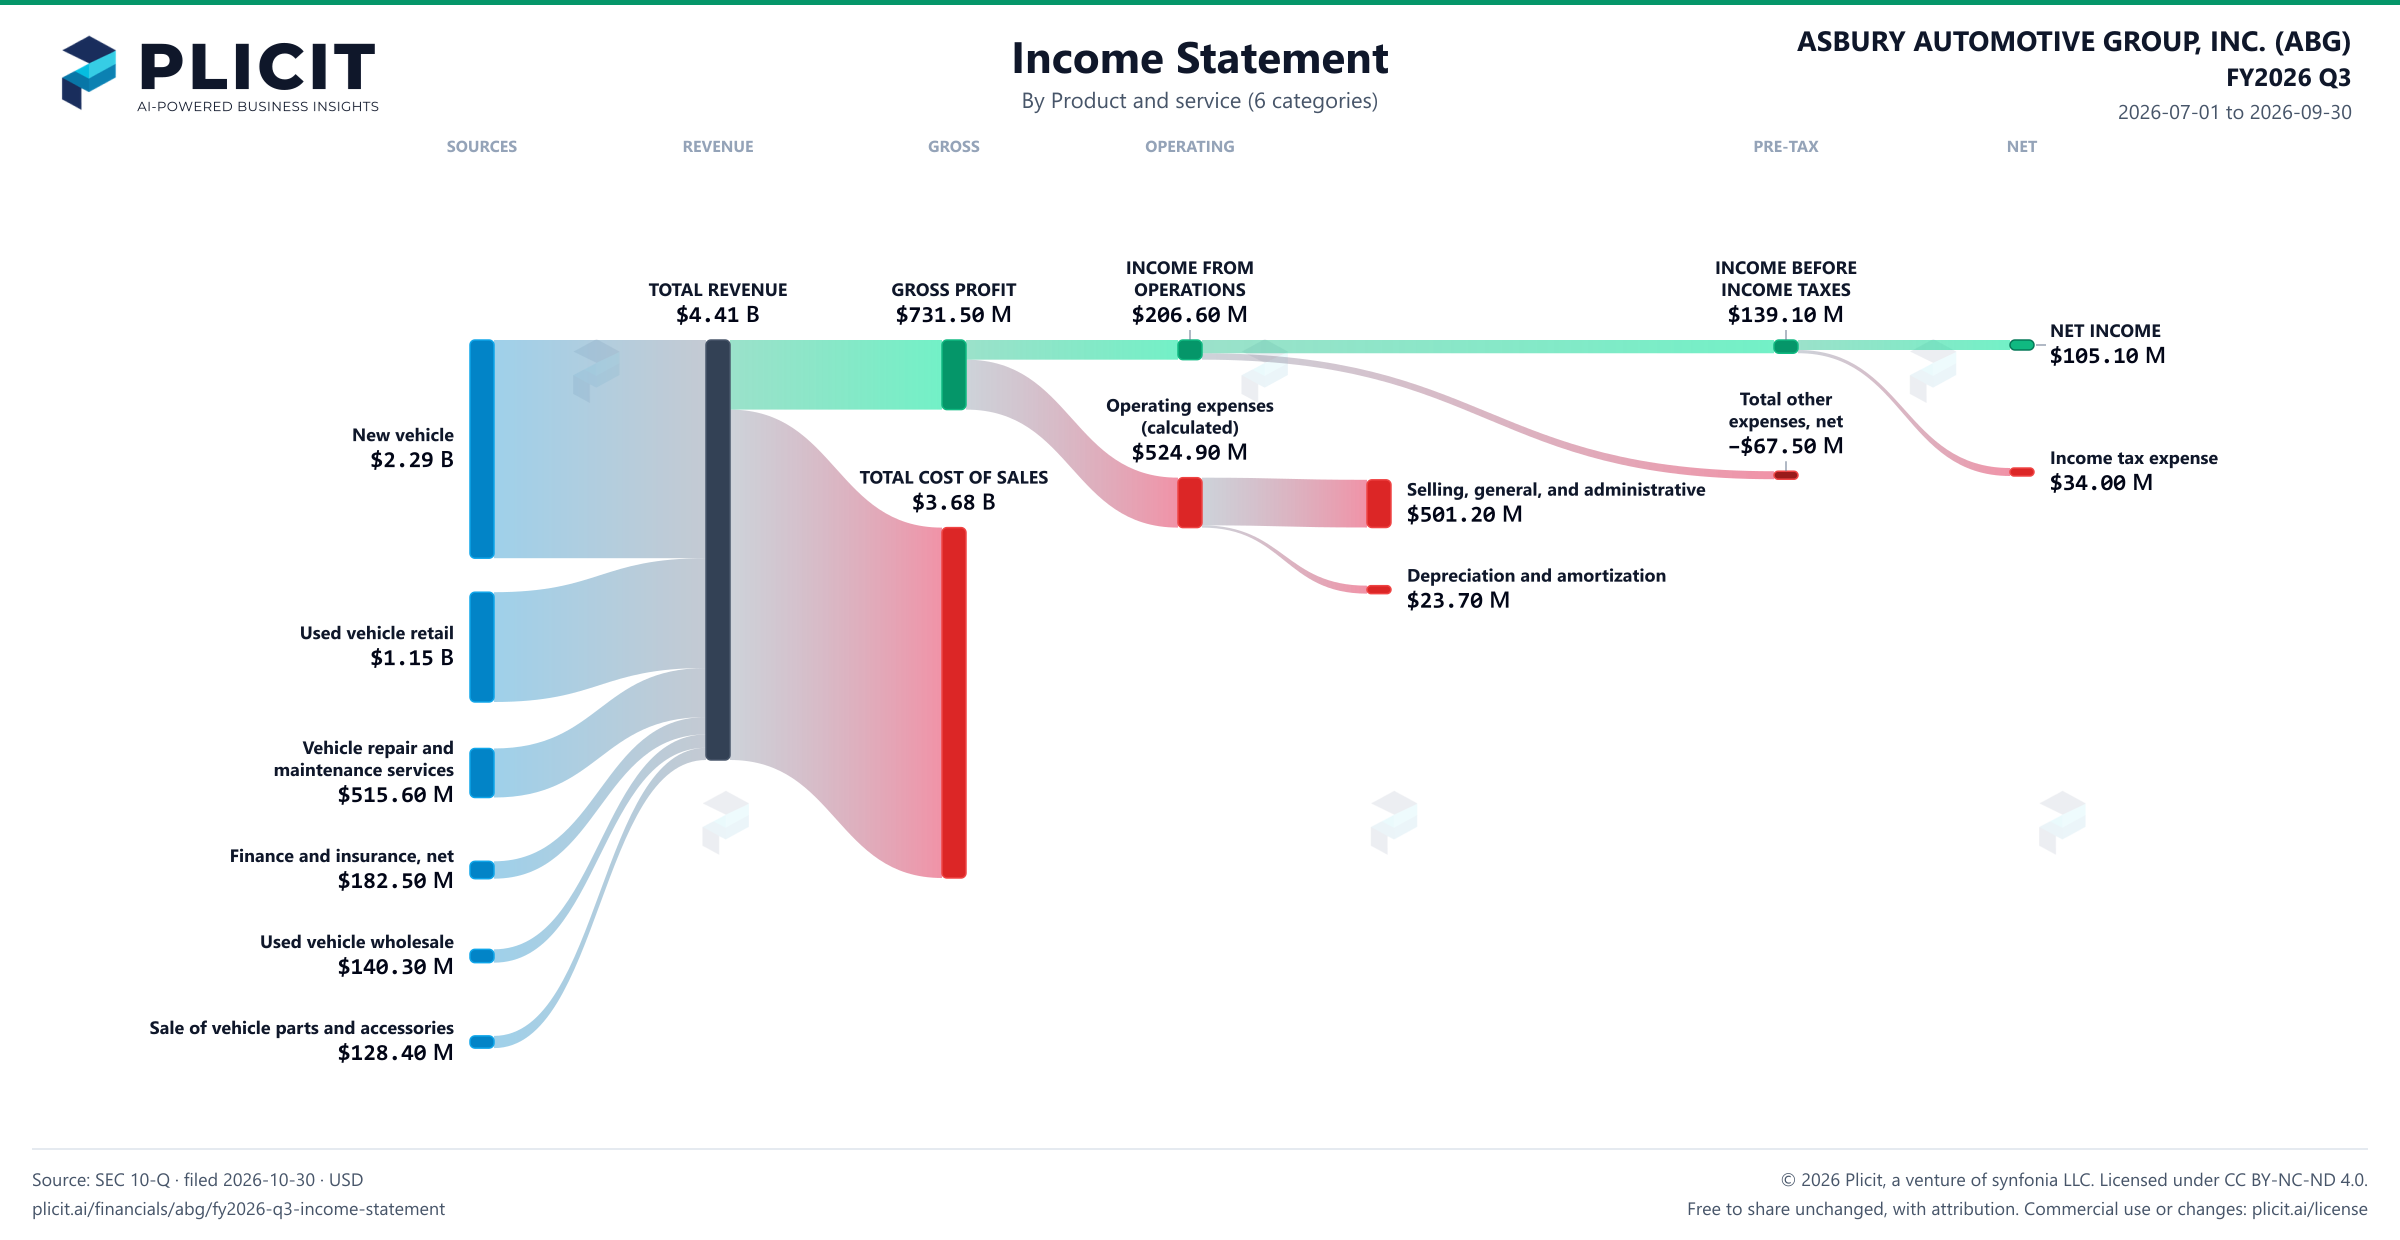
Revenue by Product and Service (6 categories)

Swipe to see the full flow
ASBURY AUTOMOTIVE GROUP, INC. (ABG) FY2026 Q3 P&L / Income StatementIncome statement for 2026-07-01 through 2026-09-30. View: Product and service (6 categories). Revenue uses this breakdown; costs and expenses retain the consolidated categories.SOURCESREVENUEGROSSOPERATINGPRE-TAXNETNew vehicleUsed vehicle retailVehicle repair and maintenance servicesFinance and insurance, netUsed vehicle wholesaleSale of vehicle parts and accessoriesTOTAL REVENUEGROSS PROFITTOTAL COST OF SALESINCOME FROM OPERATIONSOperating expenses (calculated)Selling, general, and administrativeDepreciation and amortizationINCOME BEFORE INCOME TAXESTotal other expenses, netNET INCOMEIncome tax expenseINCOME FROM OPERATIONSINCOME FROMOPERATIONS$206.60 MINCOME BEFORE INCOME TAXESINCOME BEFOREINCOME TAXES$139.10 MTOTAL REVENUETOTAL REVENUE$4.41 BGROSS PROFITGROSS PROFIT$731.50 MNET INCOMENET INCOME$105.10 MOperating expenses (calculated)Operating expenses(calculated)$524.90 MNew vehicleNew vehicle$2.29 BIncome tax expenseIncome tax expense$34.00 MTOTAL COST OF SALESTOTAL COST OF SALES$3.68 BSelling, general, and administrativeSelling, general, and administrative$501.20 MTotal other expenses, netTotal otherexpenses, net−$67.50 MDepreciation and amortizationDepreciation and amortization$23.70 MUsed vehicle retailUsed vehicle retail$1.15 BVehicle repair and maintenance servicesVehicle repair andmaintenance services$515.60 MFinance and insurance, netFinance and insurance, net$182.50 MUsed vehicle wholesaleUsed vehicle wholesale$140.30 MSale of vehicle parts and accessoriesSale of vehicle parts and accessories$128.40 M
Chart details

ASBURY AUTOMOTIVE GROUP, INC. (ABG) FY2026 Q3 P&L / Income Statement

Income statement for 2026-07-01 through 2026-09-30. View: Product and service (6 categories). Revenue uses this breakdown; costs and expenses retain the consolidated categories.

TOTAL REVENUE
4,413,600,000 US dollars
TOTAL COST OF SALES
3,682,100,000 US dollars
GROSS PROFIT
731,500,000 US dollars
Operating expenses (calculated)
524,900,000 US dollars
INCOME FROM OPERATIONS
206,600,000 US dollars
Total other expenses, net
negative 67,500,000 US dollars
INCOME BEFORE INCOME TAXES
139,100,000 US dollars
Income tax expense
34,000,000 US dollars
NET INCOME
105,100,000 US dollars
New vehicle
2,293,000,000 US dollars
Used vehicle retail
1,153,800,000 US dollars
Used vehicle wholesale
140,300,000 US dollars
Sale of vehicle parts and accessories
128,400,000 US dollars
Vehicle repair and maintenance services
515,600,000 US dollars
Finance and insurance, net
182,500,000 US dollars
Selling, general, and administrative
501,200,000 US dollars
Depreciation and amortization
23,700,000 US dollars
Asset impairments
0 US dollars

Chart connections

  • Revenue less cost of revenue equals gross profit; gross profit less operating expenses equals operating income.
  • Operating income plus other income or expense equals income before tax. Income before tax less income tax expense or benefit equals net income.
ASBURY AUTOMOTIVE GROUP, INC. (ABG) FY2026 Q3 P&L / Income Statement Sankey chart, Product and service (6 categories) view
Free to share unchanged, with credit to Plicit.ai · CC BY-NC-ND 4.0Download PNG

Intelligent Insights for Investors

Is Asbury Automotive's profit per share growing faster than its profit?

Yes: earnings per share fell 22% this quarter while profit fell 29%. The average number of shares it counted fell 8%.

Did a lower tax rate drive Asbury Automotive's profit growth?

Some of it: a drop in the tax rate (income tax as a share of profit before tax), to 24.4% this quarter from 26.5%, let profit after tax outrun profit before tax. The before-tax figure shows how the business itself did.

How much does Asbury Automotive keep after the direct cost of what it sells?

It kept 16.6% of its sales this quarter after the direct cost of what it sold, against 16.7% a year earlier. That gross margin (the share of sales kept after direct costs) has to cover everything else, from running the business to taxes.

Intelligent Insights for Lenders

How much of Asbury Automotive's profit comes from its main business?

Its main business earned $206.60 M of operating income (profit from the main business, before interest and taxes) this quarter, and interest and other items then took away $67.50 M, led by other interest expense of $47.60 M.

Intelligent Insights for Employees

Are Asbury Automotive's overhead and selling costs falling as a share of sales?

No: selling and overhead costs took 11.4% of sales this quarter, up from 11.0% a year earlier.

Intelligent Insights for Customers

Did Asbury Automotive's sales change through prices, volumes, or product mix?

Both volume and price moved: new vehicle units sold fell by 4,334, and revenue per new vehicle fell by $181. Revenue per used vehicle rose while used unit volume fell for lack of inventory.

Product waitlist

Health Check and Teardown for your own company

A health check uncovers insights of your private books, not a public ticker. Join this list to get notified as soon as we go-live!