
ASBURY AUTOMOTIVE GROUP, INC. (ABG) FY2026 YTD Q2 P&L / Income Statement
Published Source: Form 10-Q on SEC EDGAR filed (opens in a new tab)
Revenue by Business Segment
Swipe to see the full flow
Chart details
ASBURY AUTOMOTIVE GROUP, INC. (ABG) FY2026 YTD Q2 P&L / Income Statement
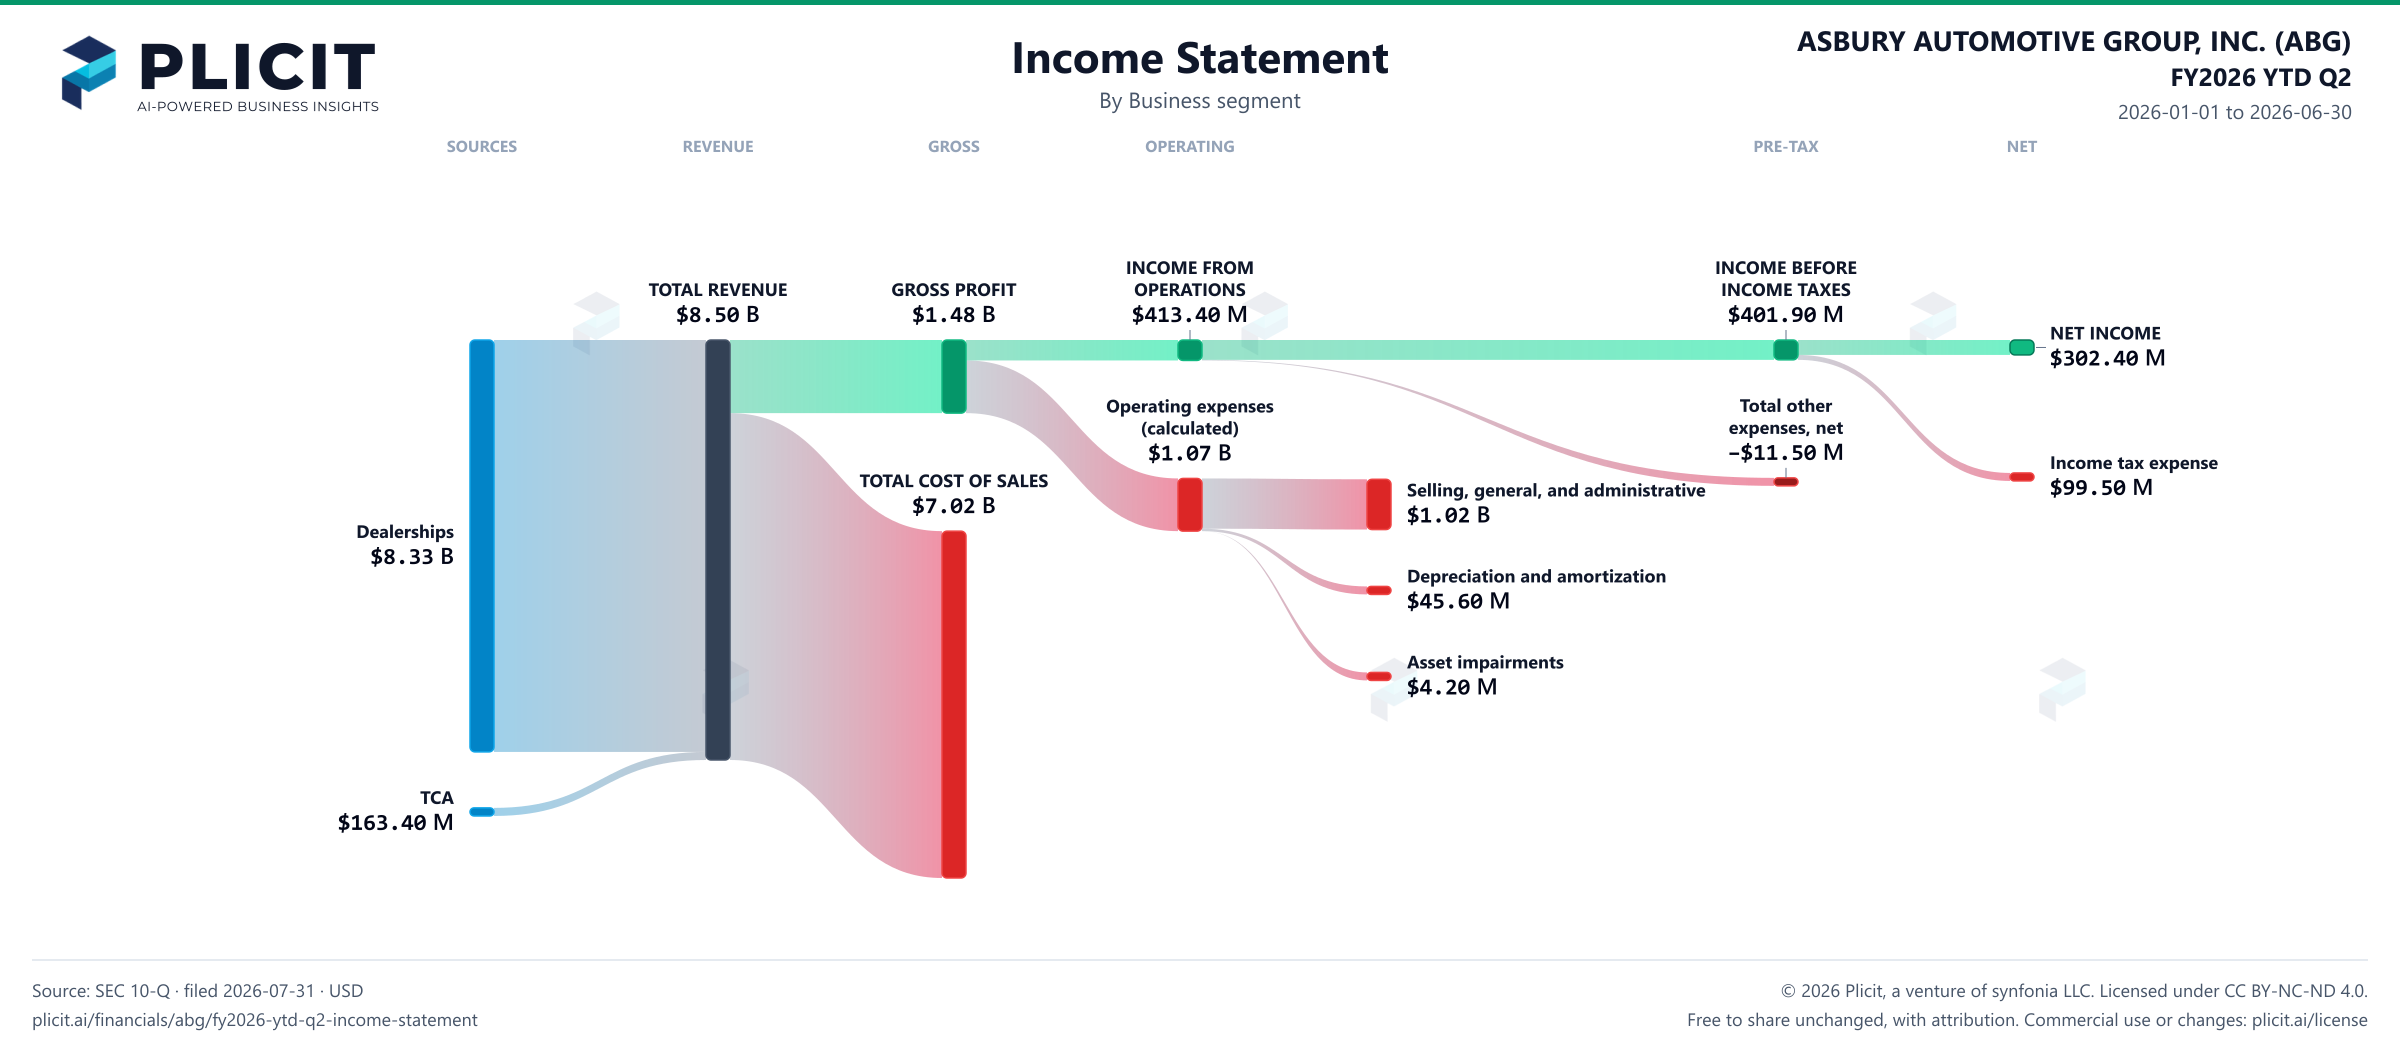
Income statement for 2026-01-01 through 2026-06-30. View: Business segment. Revenue uses this breakdown; costs and expenses retain the consolidated categories.
- TOTAL REVENUE
- 8,497,600,000 US dollars
- TOTAL COST OF SALES
- 7,017,700,000 US dollars
- GROSS PROFIT
- 1,480,000,000 US dollars
- Operating expenses (calculated)
- 1,066,600,000 US dollars
- INCOME FROM OPERATIONS
- 413,400,000 US dollars
- Total other expenses, net
- negative 11,500,000 US dollars
- INCOME BEFORE INCOME TAXES
- 401,900,000 US dollars
- Income tax expense
- 99,500,000 US dollars
- NET INCOME
- 302,400,000 US dollars
- Dealerships
- 8,334,200,000 US dollars
- TCA
- 163,400,000 US dollars
- Selling, general, and administrative
- 1,016,800,000 US dollars
- Depreciation and amortization
- 45,600,000 US dollars
- Asset impairments
- 4,200,000 US dollars
Chart connections
- Revenue less cost of revenue equals gross profit; gross profit less operating expenses equals operating income.
- Operating income plus other income or expense equals income before tax. Income before tax less income tax expense or benefit equals net income.
- The amounts that make up gross profit come to $1,479.90 M and gross profit is $1,480.00 M; the $0.10 M difference is within the rounding of the filed amounts.
Free to share unchanged, with credit to Plicit.ai · CC BY-NC-ND 4.0Download PNG
Product waitlist
Health Check and Teardown for your own company
A health check uncovers insights of your private books, not a public ticker. Join this list to get notified as soon as we go-live!