
ALASKA AIR GROUP, INC. (ALK) FY2026 Q2 P&L / Income Statement

Published · Updated Source: Form 10-Q on SEC EDGAR filed (opens in a new tab)

Key Takeaways

  • Alaska Air lost $76.00 M this quarter after earning $172.00 M in the same quarter a year earlier.
  • Fuel cost $1.31 B, up 86%, as the price of a gallon jumped 85% to $4.43 from $2.39.
  • Sales rose $361 million, or 10%, but the fuel bill alone rose $605 million.
  • A $138 million tax benefit shrank a $214.00 M pretax loss to a $76.00 M net loss.
  • Interest expense rose to $86.00 M from $66.00 M while operations lost $168.00 M.

The Unvarnished Truth

Fuel bill jumped $605 million and wiped out Alaska Air's profit

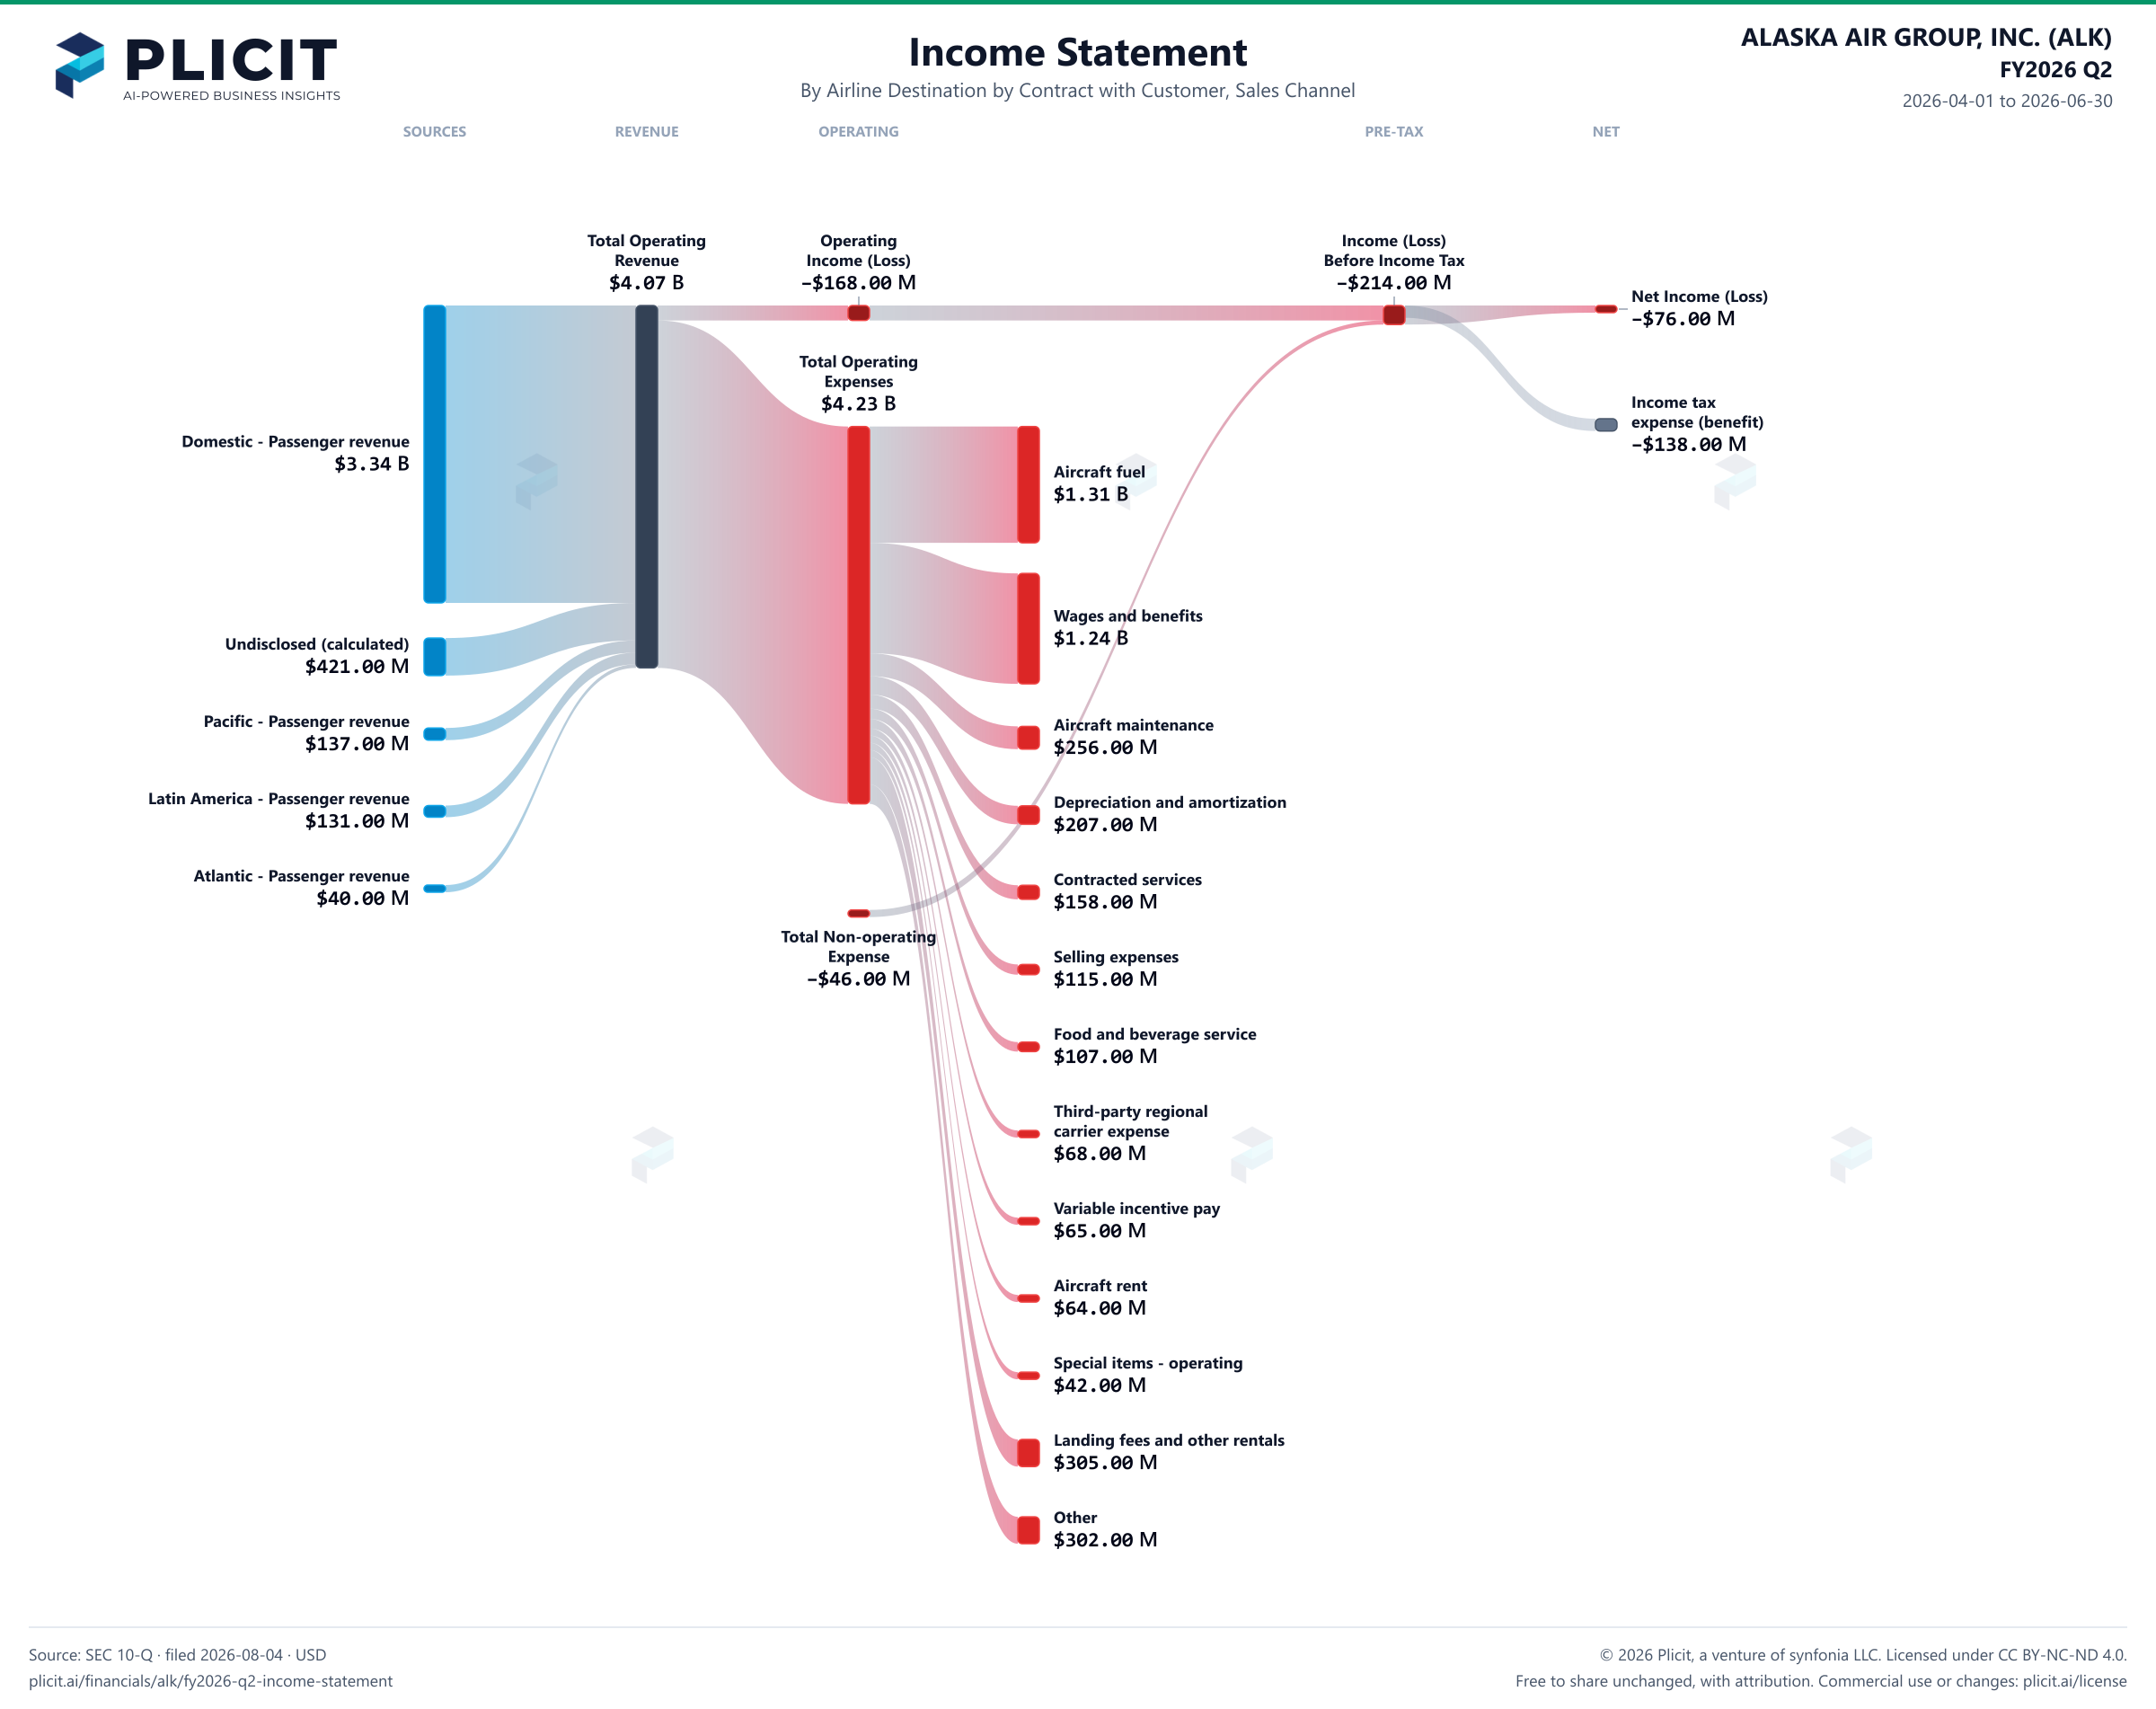
Alaska Air swung from a $172.00 M profit a year earlier to a $76.00 M loss this quarter. The culprit sits on one line. Aircraft fuel cost $1.31 B, 32% of revenue. Management says the fuel bill rose $605 million, or 86%, due to "elevated refining margins and crude oil prices." Refining margins alone cost $517 million, against $164 million a year earlier. Sales did their part, rising $361 million, or 10%. They were simply outrun. The main business lost $168.00 M before interest and tax, after earning $277.00 M a year earlier.

Is fuel the whole story? Mostly. Non-fuel costs, excluding special items, rose 8% to $2,886 million, slower than the 10% rise in sales. But the quarter also carried $42 million of special items, mainly for folding in Hawaiian Airlines, and lost last year's $25 million gain from selling four jets. Interest expense rose to $86.00 M from $66.00 M. Then the tax line did the heavy lifting: a $138 million benefit shrank a $214.00 M pretax loss to a $76.00 M net loss. Strip out special items and foreign-debt swings, and management's adjusted net loss is $102 million, deeper than the reported one.

Management expects fuel costs "will remain elevated and volatile until these disruptions are resolved." That turns the rest of 2026 into a test of pricing power. Revenue per seat mile rose 8.6% this quarter while the price of a gallon of fuel rose 85%. Demand is holding: passenger revenue grew $289 million, which management credits mainly to higher yields. Watch whether fares keep climbing as fast as fuel, and whether tax benefits keep cushioning the losses. If refining margins stay this high, can Alaska Air raise fares fast enough to cover a fuel bill that is up 86% in a year?
2026-04-01 to 2026-06-30

Revenue by Airline Destination by Sales Channel

Swipe to see the full flow
ALASKA AIR GROUP, INC. (ALK) FY2026 Q2 P&L / Income StatementIncome statement for 2026-04-01 through 2026-06-30. View: Airline Destination by Contract with Customer, Sales Channel. Revenue uses this breakdown; costs and expenses retain the consolidated categories.SOURCESREVENUEOPERATINGPRE-TAXNETDomestic - Passenger revenueUndisclosed (calculated)Pacific - Passenger revenueLatin America - Passenger revenueAtlantic - Passenger revenueTotal Operating RevenueOperating Income (Loss)Total Operating ExpensesAircraft fuelWages and benefitsAircraft maintenanceDepreciation and amortizationContracted servicesSelling expensesFood and beverage serviceThird-party regional carrier expenseVariable incentive payAircraft rentSpecial items - operatingLanding fees and other rentalsOtherIncome (Loss) Before Income TaxTotal Non-operating ExpenseNet Income (Loss)Income tax expense (benefit)Total Operating RevenueTotal OperatingRevenue$4.07 BOperating Income (Loss)OperatingIncome (Loss)−$168.00 MIncome (Loss) Before Income TaxIncome (Loss)Before Income Tax−$214.00 MNet Income (Loss)Net Income (Loss)−$76.00 MTotal Operating ExpensesTotal OperatingExpenses$4.23 BIncome tax expense (benefit)Income taxexpense (benefit)−$138.00 MDomestic - Passenger revenueDomestic - Passenger revenue$3.34 BAircraft fuelAircraft fuel$1.31 BWages and benefitsWages and benefits$1.24 BUndisclosed (calculated)Undisclosed (calculated)$421.00 MPacific - Passenger revenuePacific - Passenger revenue$137.00 MAircraft maintenanceAircraft maintenance$256.00 MLatin America - Passenger revenueLatin America - Passenger revenue$131.00 MDepreciation and amortizationDepreciation and amortization$207.00 MAtlantic - Passenger revenueAtlantic - Passenger revenue$40.00 MContracted servicesContracted services$158.00 MTotal Non-operating ExpenseTotal Non-operatingExpense−$46.00 MSelling expensesSelling expenses$115.00 MFood and beverage serviceFood and beverage service$107.00 MThird-party regional carrier expenseThird-party regionalcarrier expense$68.00 MVariable incentive payVariable incentive pay$65.00 MAircraft rentAircraft rent$64.00 MSpecial items - operatingSpecial items - operating$42.00 MLanding fees and other rentalsLanding fees and other rentals$305.00 MOtherOther$302.00 M
Chart details

ALASKA AIR GROUP, INC. (ALK) FY2026 Q2 P&L / Income Statement

Income statement for 2026-04-01 through 2026-06-30. View: Airline Destination by Contract with Customer, Sales Channel. Revenue uses this breakdown; costs and expenses retain the consolidated categories.

Total Operating Revenue
4,065,000,000 US dollars
Total Operating Expenses
4,233,000,000 US dollars
Operating Income (Loss)
negative 168,000,000 US dollars
Total Non-operating Expense
negative 46,000,000 US dollars
Income (Loss) Before Income Tax
negative 214,000,000 US dollars
Income tax expense (benefit)
negative 138,000,000 US dollars
Net Income (Loss)
negative 76,000,000 US dollars
Atlantic - Passenger revenue
40,000,000 US dollars
Domestic - Passenger revenue
3,336,000,000 US dollars
Latin America - Passenger revenue
131,000,000 US dollars
Pacific - Passenger revenue
137,000,000 US dollars
Undisclosed (calculated)
421,000,000 US dollars
Wages and benefits
1,239,000,000 US dollars
Variable incentive pay
65,000,000 US dollars
Aircraft fuel
1,305,000,000 US dollars
Aircraft maintenance
256,000,000 US dollars
Aircraft rent
64,000,000 US dollars
Landing fees and other rentals
305,000,000 US dollars
Contracted services
158,000,000 US dollars
Selling expenses
115,000,000 US dollars
Depreciation and amortization
207,000,000 US dollars
Food and beverage service
107,000,000 US dollars
Third-party regional carrier expense
68,000,000 US dollars
Other
302,000,000 US dollars
Special items - operating
42,000,000 US dollars

Chart connections

  • Revenue minus operating expenses equals operating income.
  • Operating income plus other income or expense equals income before tax. Income before tax less income tax expense or benefit equals net income.
ALASKA AIR GROUP, INC. (ALK) FY2026 Q2 P&L / Income Statement Sankey chart, Airline Destination by Contract with Customer, Sales Channel view
Free to share unchanged, with credit to Plicit.ai · CC BY-NC-ND 4.0Download PNG

Intelligent Insights for Investors

Did Alaska Air make a profit this quarter?

No: Alaska Air lost $76.00 M this quarter, or 2 cents of every sales dollar. A year earlier it earned $172.00 M.

How much did Alaska Air's sales grow from a year ago?

By 10%: sales reached $4.07 B this quarter, against $3.70 B a year earlier. Management credits higher yields, premium cabins, loyalty redemptions and corporate travel.

What is Alaska Air's biggest expense?

Aircraft fuel, at $1.31 B this quarter, or 32% of revenue. Wages and benefits came next, at $1.24 B. A swing in fuel prices hits this airline harder than any other cost.

How much of Alaska Air's result comes from flying, and how much from everything else?

Its main business lost $168.00 M this quarter. Interest and other items took away another $46.00 M, led by interest expense, for a pretax loss of $214.00 M.

Intelligent Insights for Lenders

Does Alaska Air earn enough to cover its interest payments?

No: operations lost $168.00 M this quarter, against $86.00 M of interest. A year earlier, operating profit of $277.00 M covered $66.00 M of interest with room to spare.

Product waitlist

Health Check and Teardown for your own company

A health check uncovers insights of your private books, not a public ticker. Join this list to get notified as soon as we go-live!