
Axon Enterprise, Inc. (AXON) FY2025 Q1 Balance Sheet

Balance Sheet

As of 2025-03-31

Swipe to see the full flow
Axon Enterprise, Inc. (AXON) FY2025 Q1 Balance SheetBalance sheet as of 2025-03-31. The chart shows assets, liabilities and equity at that date.Current liabilities$1.34 BCurrent assets$3.78 BLiabilities$3.53 BAssets$6.08 BNon-current liabilities$2.19 BEquity$2.56 BNon-current assets$2.31 BGross equity(calculated)$2.73 BHOLDINGSASSET CLASSASSETSCLAIM CLASSCLAIM SUB-CLASSCLAIMSShort-term investmentsCash and cash equivalentsAccounts and notes receivable, net of allowance of $3,204 and $3,322 as of March 31, 2025 and December 31, 2024, respectivelyContract assets, netInventoryMarketable securitiesPrepaid expenses and other current assetsGoodwillStrategic investmentsDeferred tax assets, netProperty and equipment, netOther long-term assetsIntangible assets, netLong-term contract assets, netLong-term notes receivable, netCurrent portion of deferred revenueCurrent portion of notes payable, netAccrued liabilitiesAccounts payableCustomer depositsOther current liabilitiesLong-term notes payable, netDeferred revenue, net of current portionLong-term lease liabilitiesLiability for unrecognized tax benefitsOther long-term liabilitiesLong-term deferred compensationAdditional paid-in capitalRetained earningsCommon stockCurrent assetsNon-current assetsAssetsCurrent liabilitiesNon-current liabilitiesLiabilitiesEquityGross equity (calculated)Treasury stock at cost, 20,220,227 shares as of March 31, 2025 and December 31, 2024Accumulated other comprehensive lossCurrent portion of deferred revenueCurrent portion of deferred revenue$661.12 MCurrent liabilitiesCurrent liabilities$1.34 BCurrent portion of notes payable, netCurrent portion of notes payable, net$278.92 MShort-term investmentsShort-term investments$1.10 BCurrent assetsCurrent assets$3.78 BAccrued liabilitiesAccrued liabilities$266.60 MCash and cash equivalentsCash and cash equivalents$1.09 BAccounts payableAccounts payable$97.67 MLiabilitiesLiabilities$3.53 BAccounts and notes receivable, net of allowance of $3,204 and $3,322 as of March 31, 2025 and December 31, 2024, respectivelyAccounts and notes receivable, net$600.37 MCustomer depositsCustomer deposits$21.65 MAssetsAssets$6.08 BContract assets, netContract assets, net$373.71 MOther current liabilitiesOther current liabilities$10.67 MInventoryInventory$279.67 MLong-term notes payable, netLong-term notes payable, net$1.73 BMarketable securitiesMarketable securities$174.87 MNon-current liabilitiesNon-current liabilities$2.19 BPrepaid expenses and other current assetsPrepaid expenses and other current assets$155.80 MDeferred revenue, net of current portionDeferred revenue, net of current portion$348.61 MGoodwillGoodwill$755.88 MLong-term lease liabilitiesLong-term lease liabilities$40.02 MEquityEquity$2.56 BStrategic investmentsStrategic investments$413.69 MLiability for unrecognized tax benefitsLiability for unrecognized tax benefits$28.51 MNon-current assetsNon-current assets$2.31 BDeferred tax assets, netDeferred tax assets, net$335.74 MOther long-term liabilitiesOther long-term liabilities$27.06 MProperty and equipment, netProperty and equipment, net$259.87 MLong-term deferred compensationLong-term deferred compensation$18.69 MGross equity (calculated)Gross equity(calculated)$2.73 BOther long-term assetsOther long-term assets$235.68 MAdditional paid-in capitalAdditional paid-in capital$1.83 BIntangible assets, netIntangible assets, net$168.83 MLong-term contract assets, netLong-term contract assets, net$133.55 MRetained earningsRetained earnings$899.99 MLong-term notes receivable, netLong-term notes receivable, net$3.32 MCommon stockCommon stock$1.00 KTreasury stock at cost, 20,220,227 shares as of March 31, 2025 and December 31, 2024Treasury stock at cost−$155.95 MAccumulated other comprehensive lossAccumulated other comprehensive loss−$17.95 M
Chart details

Axon Enterprise, Inc. (AXON) FY2025 Q1 Balance Sheet

Balance sheet as of 2025-03-31. The chart shows assets, liabilities and equity at that date.

Assets
6,083,159,000 US dollars
Current assets
3,776,589,000 US dollars
Non-current assets
2,306,570,000 US dollars
Liabilities
3,527,306,000 US dollars
Current liabilities
1,336,622,000 US dollars
Non-current liabilities
2,190,684,000 US dollars
Equity
2,555,853,000 US dollars
Short-term investments
1,099,230,000 US dollars
Cash and cash equivalents
1,092,938,000 US dollars
Accounts and notes receivable, net of allowance of $3,204 and $3,322 as of March 31, 2025 and December 31, 2024, respectively
600,371,000 US dollars
Contract assets, net
373,707,000 US dollars
Inventory
279,669,000 US dollars
Marketable securities
174,870,000 US dollars
Prepaid expenses and other current assets
155,804,000 US dollars
Goodwill
755,882,000 US dollars
Strategic investments
413,693,000 US dollars
Deferred tax assets, net
335,742,000 US dollars
Property and equipment, net
259,869,000 US dollars
Other long-term assets
235,681,000 US dollars
Intangible assets, net
168,834,000 US dollars
Long-term contract assets, net
133,551,000 US dollars
Long-term notes receivable, net
3,318,000 US dollars
Current portion of deferred revenue
661,116,000 US dollars
Current portion of notes payable, net
278,915,000 US dollars
Accrued liabilities
266,604,000 US dollars
Accounts payable
97,670,000 US dollars
Customer deposits
21,645,000 US dollars
Other current liabilities
10,672,000 US dollars
Long-term notes payable, net
1,727,797,000 US dollars
Deferred revenue, net of current portion
348,614,000 US dollars
Long-term lease liabilities
40,016,000 US dollars
Liability for unrecognized tax benefits
28,510,000 US dollars
Other long-term liabilities
27,056,000 US dollars
Long-term deferred compensation
18,691,000 US dollars
Additional paid-in capital
1,829,755,000 US dollars
Retained earnings
899,994,000 US dollars
Common stock
1,000 US dollars
Preferred stock
0 US dollars
Treasury stock at cost, 20,220,227 shares as of March 31, 2025 and December 31, 2024
negative 155,947,000 US dollars
Accumulated other comprehensive loss
negative 17,950,000 US dollars
Gross equity (calculated)
2,729,750,000 US dollars. Net equity plus the magnitudes of its negative contributions equals gross positive equity. The negative contributions enter this reconciliation as add-backs; their filed signs stay negative.

Chart connections

  • Assets equal liabilities plus consolidated equity. Consolidated equity includes noncontrolling interests when reported.
  • Treasury shares and other negative equity contributions reduce equity.
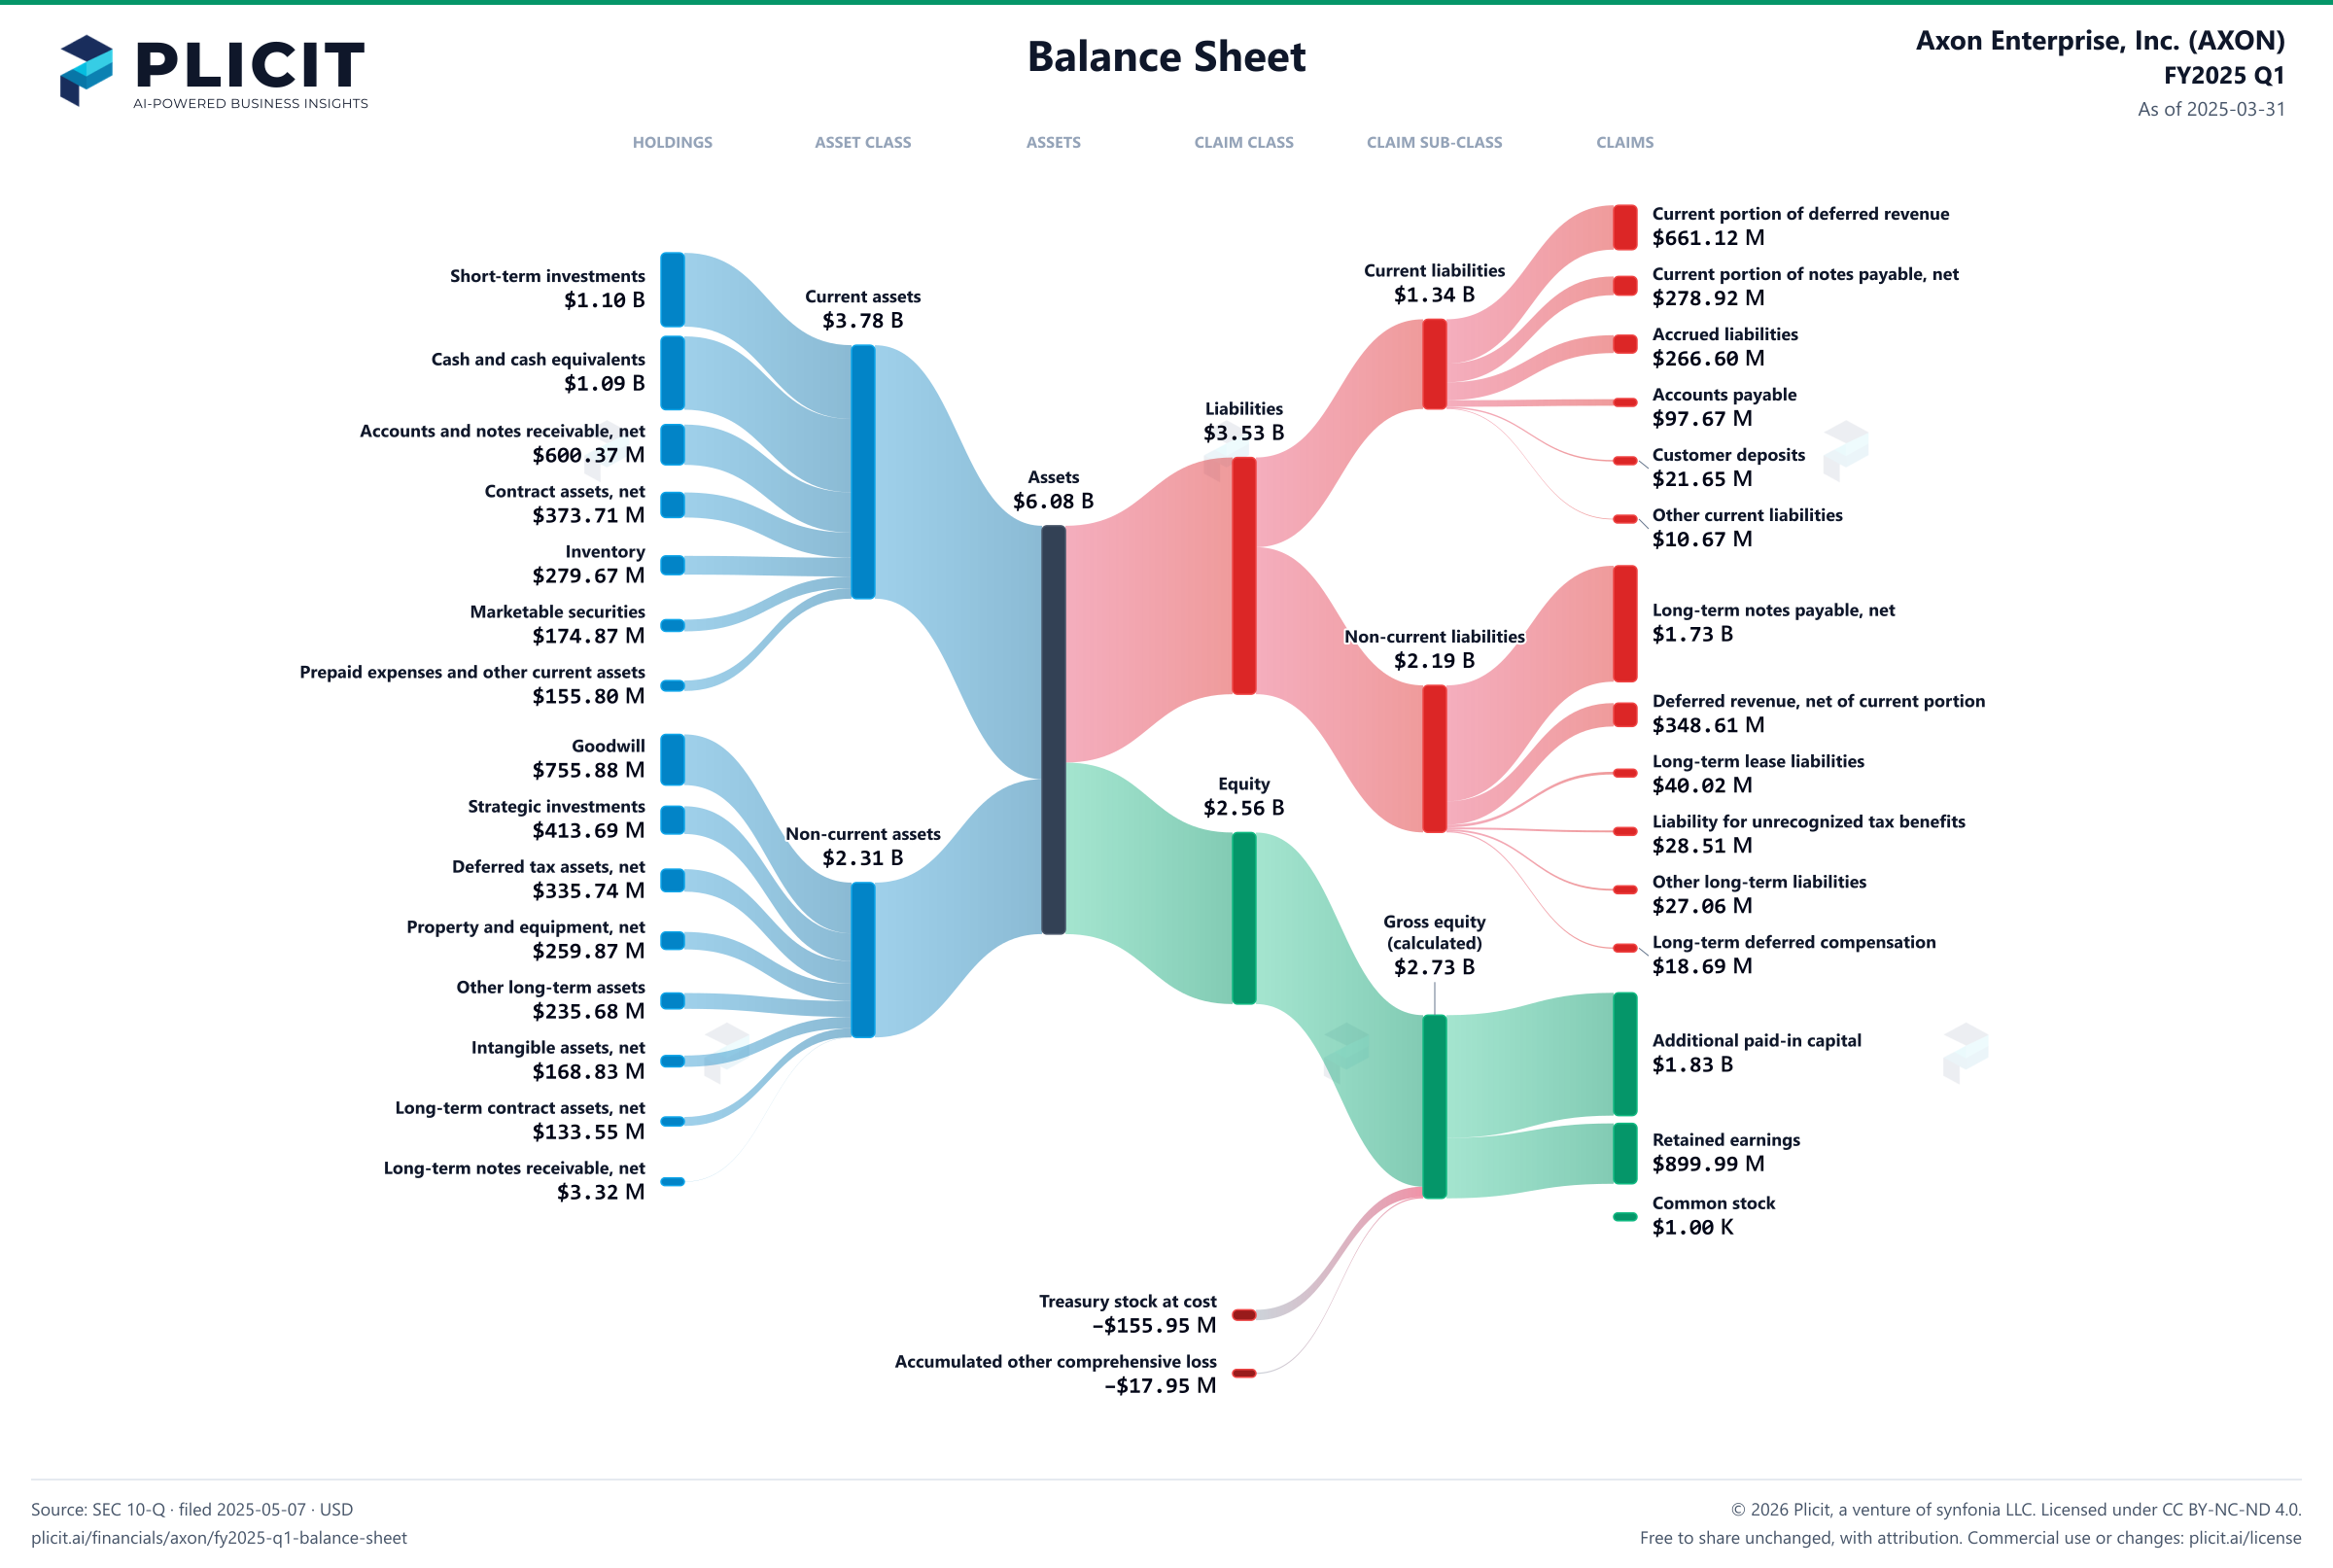
Axon Enterprise, Inc. (AXON) FY2025 Q1 Balance Sheet Sankey chart
Free to share unchanged, with credit to Plicit.ai · CC BY-NC-ND 4.0Download PNG

Newsletter

Get the teardowns by email

Subscribe if you want the public-company teardowns in your inbox when they're released.

Product waitlist

Health Check and Teardown for your own company

A health check uncovers insights of your private books, not a public ticker. Join this list to get notified as soon as we go-live!