
Axon Enterprise, Inc. (AXON) FY2026 Q2 Balance Sheet

Balance Sheet

As of 2026-06-30

Swipe to see the full flow
Axon Enterprise, Inc. (AXON) FY2026 Q2 Balance SheetBalance sheet as of 2026-06-30. The chart shows assets, liabilities and equity at that date.Current liabilities$1.40 BCurrent assets$3.00 BLiabilities$3.81 BAssets$7.48 BNon-current liabilities$2.41 BEquity$3.67 BNon-current assets$4.48 BGross equity(calculated)$3.87 BHOLDINGSASSET CLASSASSETSCLAIM CLASSCLAIM SUB-CLASSCLAIMSAccounts and notes receivable, net of allowance of $4,949 and $4,198 as of June 30, 2026 and December 31, 2025, respectivelyContract assets, netCash and cash equivalentsInventoryPrepaid expensesOther current assetsShort-term investmentsMarketable securitiesGoodwillStrategic investmentsOther long-term assetsDeferred tax assets, netProperty and equipment, netLong-term contract assets, netIntangible assets, netLong-term notes receivable, netCurrent portion of deferred revenueAccrued liabilitiesAccounts payableOther current liabilitiesCustomer depositsLong-term notes payable, netDeferred revenue, net of current portionOther long-term liabilitiesLong-term lease liabilitiesLong-term deferred compensationLiability for unrecognized tax benefitsAdditional paid-in capitalRetained earningsCommon stock, $0.00001 par value; 200,000,000 shares authorized, 101,510,494 shares issued and 81,235,921 shares outstanding as of June 30, 2026, and 200,000,000 shares authorized, 100,444,971 shares issued and 80,211,537 shares outstanding as of December 31, 2025Current assetsNon-current assetsAssetsCurrent liabilitiesNon-current liabilitiesLiabilitiesEquityGross equity (calculated)Treasury stock at cost, 20,274,573 shares and 20,233,434 shares as of June 30, 2026 and December 31, 2025, respectivelyAccumulated other comprehensive lossAccounts and notes receivable, net of allowance of $4,949 and $4,198 as of June 30, 2026 and December 31, 2025, respectivelyAccounts and notes receivable, net$768.64 MCurrent portion of deferred revenueCurrent portion of deferred revenue$670.74 MCurrent liabilitiesCurrent liabilities$1.40 BContract assets, netContract assets, net$750.95 MAccrued liabilitiesAccrued liabilities$423.93 MCurrent assetsCurrent assets$3.00 BCash and cash equivalentsCash and cash equivalents$597.70 MAccounts payableAccounts payable$269.96 MLiabilitiesLiabilities$3.81 BInventoryInventory$486.56 MOther current liabilitiesOther current liabilities$17.13 MPrepaid expensesPrepaid expenses$190.68 MCustomer depositsCustomer deposits$16.48 MAssetsAssets$7.48 BOther current assetsOther current assets$115.35 MLong-term notes payable, netLong-term notes payable, net$1.73 BShort-term investmentsShort-term investments$75.70 MNon-current liabilitiesNon-current liabilities$2.41 BDeferred revenue, net of current portionDeferred revenue, net of current portion$385.66 MMarketable securitiesMarketable securities$19.13 MOther long-term liabilitiesOther long-term liabilities$129.57 MGoodwillGoodwill$1.90 BEquityEquity$3.67 BLong-term lease liabilitiesLong-term lease liabilities$101.66 MNon-current assetsNon-current assets$4.48 BLong-term deferred compensationLong-term deferred compensation$33.09 MStrategic investmentsStrategic investments$853.84 MLiability for unrecognized tax benefitsLiability for unrecognized tax benefits$26.59 MGross equity (calculated)Gross equity(calculated)$3.87 BOther long-term assetsOther long-term assets$457.14 MDeferred tax assets, netDeferred tax assets, net$345.50 MAdditional paid-in capitalAdditional paid-in capital$2.74 BProperty and equipment, netProperty and equipment, net$341.51 MLong-term contract assets, netLong-term contract assets, net$296.46 MRetained earningsRetained earnings$1.14 BIntangible assets, netIntangible assets, net$281.58 MCommon stock, $0.00001 par value; 200,000,000 shares authorized, 101,510,494 shares issued and 81,235,921 shares outstanding as of June 30, 2026, and 200,000,000 shares authorized, 100,444,971 shares issued and 80,211,537 shares outstanding as of December 31, 2025Common stock$1.00 KLong-term notes receivable, netLong-term notes receivable, net$1.60 MTreasury stock at cost, 20,274,573 shares and 20,233,434 shares as of June 30, 2026 and December 31, 2025, respectivelyTreasury stock at cost−$180.16 MAccumulated other comprehensive lossAccumulated other comprehensive loss−$16.42 M
Chart details

Axon Enterprise, Inc. (AXON) FY2026 Q2 Balance Sheet

Balance sheet as of 2026-06-30. The chart shows assets, liabilities and equity at that date.

Assets
7,481,157,000 US dollars
Current assets
3,004,705,000 US dollars
Non-current assets
4,476,452,000 US dollars
Liabilities
3,806,620,000 US dollars
Current liabilities
1,398,237,000 US dollars
Non-current liabilities
2,408,383,000 US dollars
Equity
3,674,537,000 US dollars
Accounts and notes receivable, net of allowance of $4,949 and $4,198 as of June 30, 2026 and December 31, 2025, respectively
768,637,000 US dollars
Contract assets, net
750,950,000 US dollars
Cash and cash equivalents
597,704,000 US dollars
Inventory
486,556,000 US dollars
Prepaid expenses
190,682,000 US dollars
Other current assets
115,347,000 US dollars
Short-term investments
75,703,000 US dollars
Marketable securities
19,126,000 US dollars
Goodwill
1,898,827,000 US dollars
Strategic investments
853,842,000 US dollars
Other long-term assets
457,138,000 US dollars
Deferred tax assets, net
345,500,000 US dollars
Property and equipment, net
341,507,000 US dollars
Long-term contract assets, net
296,458,000 US dollars
Intangible assets, net
281,583,000 US dollars
Long-term notes receivable, net
1,597,000 US dollars
Current portion of deferred revenue
670,740,000 US dollars
Accrued liabilities
423,932,000 US dollars
Accounts payable
269,957,000 US dollars
Other current liabilities
17,131,000 US dollars
Customer deposits
16,477,000 US dollars
Current portion of notes payable, net
0 US dollars
Long-term notes payable, net
1,731,817,000 US dollars
Deferred revenue, net of current portion
385,659,000 US dollars
Other long-term liabilities
129,568,000 US dollars
Long-term lease liabilities
101,658,000 US dollars
Long-term deferred compensation
33,094,000 US dollars
Liability for unrecognized tax benefits
26,587,000 US dollars
Additional paid-in capital
2,735,708,000 US dollars
Retained earnings
1,135,409,000 US dollars
Common stock, $0.00001 par value; 200,000,000 shares authorized, 101,510,494 shares issued and 81,235,921 shares outstanding as of June 30, 2026, and 200,000,000 shares authorized, 100,444,971 shares issued and 80,211,537 shares outstanding as of December 31, 2025
1,000 US dollars
Preferred stock, $0.00001 par value; 25,000,000 shares authorized; no shares issued and outstanding as of June 30, 2026 and December 31, 2025, respectively
0 US dollars
Treasury stock at cost, 20,274,573 shares and 20,233,434 shares as of June 30, 2026 and December 31, 2025, respectively
negative 180,164,000 US dollars
Accumulated other comprehensive loss
negative 16,417,000 US dollars
Gross equity (calculated)
3,871,118,000 US dollars. Net equity plus the magnitudes of its negative contributions equals gross positive equity. The negative contributions enter this reconciliation as add-backs; their filed signs stay negative.

Chart connections

  • Assets equal liabilities plus consolidated equity. Consolidated equity includes noncontrolling interests when reported.
  • Treasury shares and other negative equity contributions reduce equity.
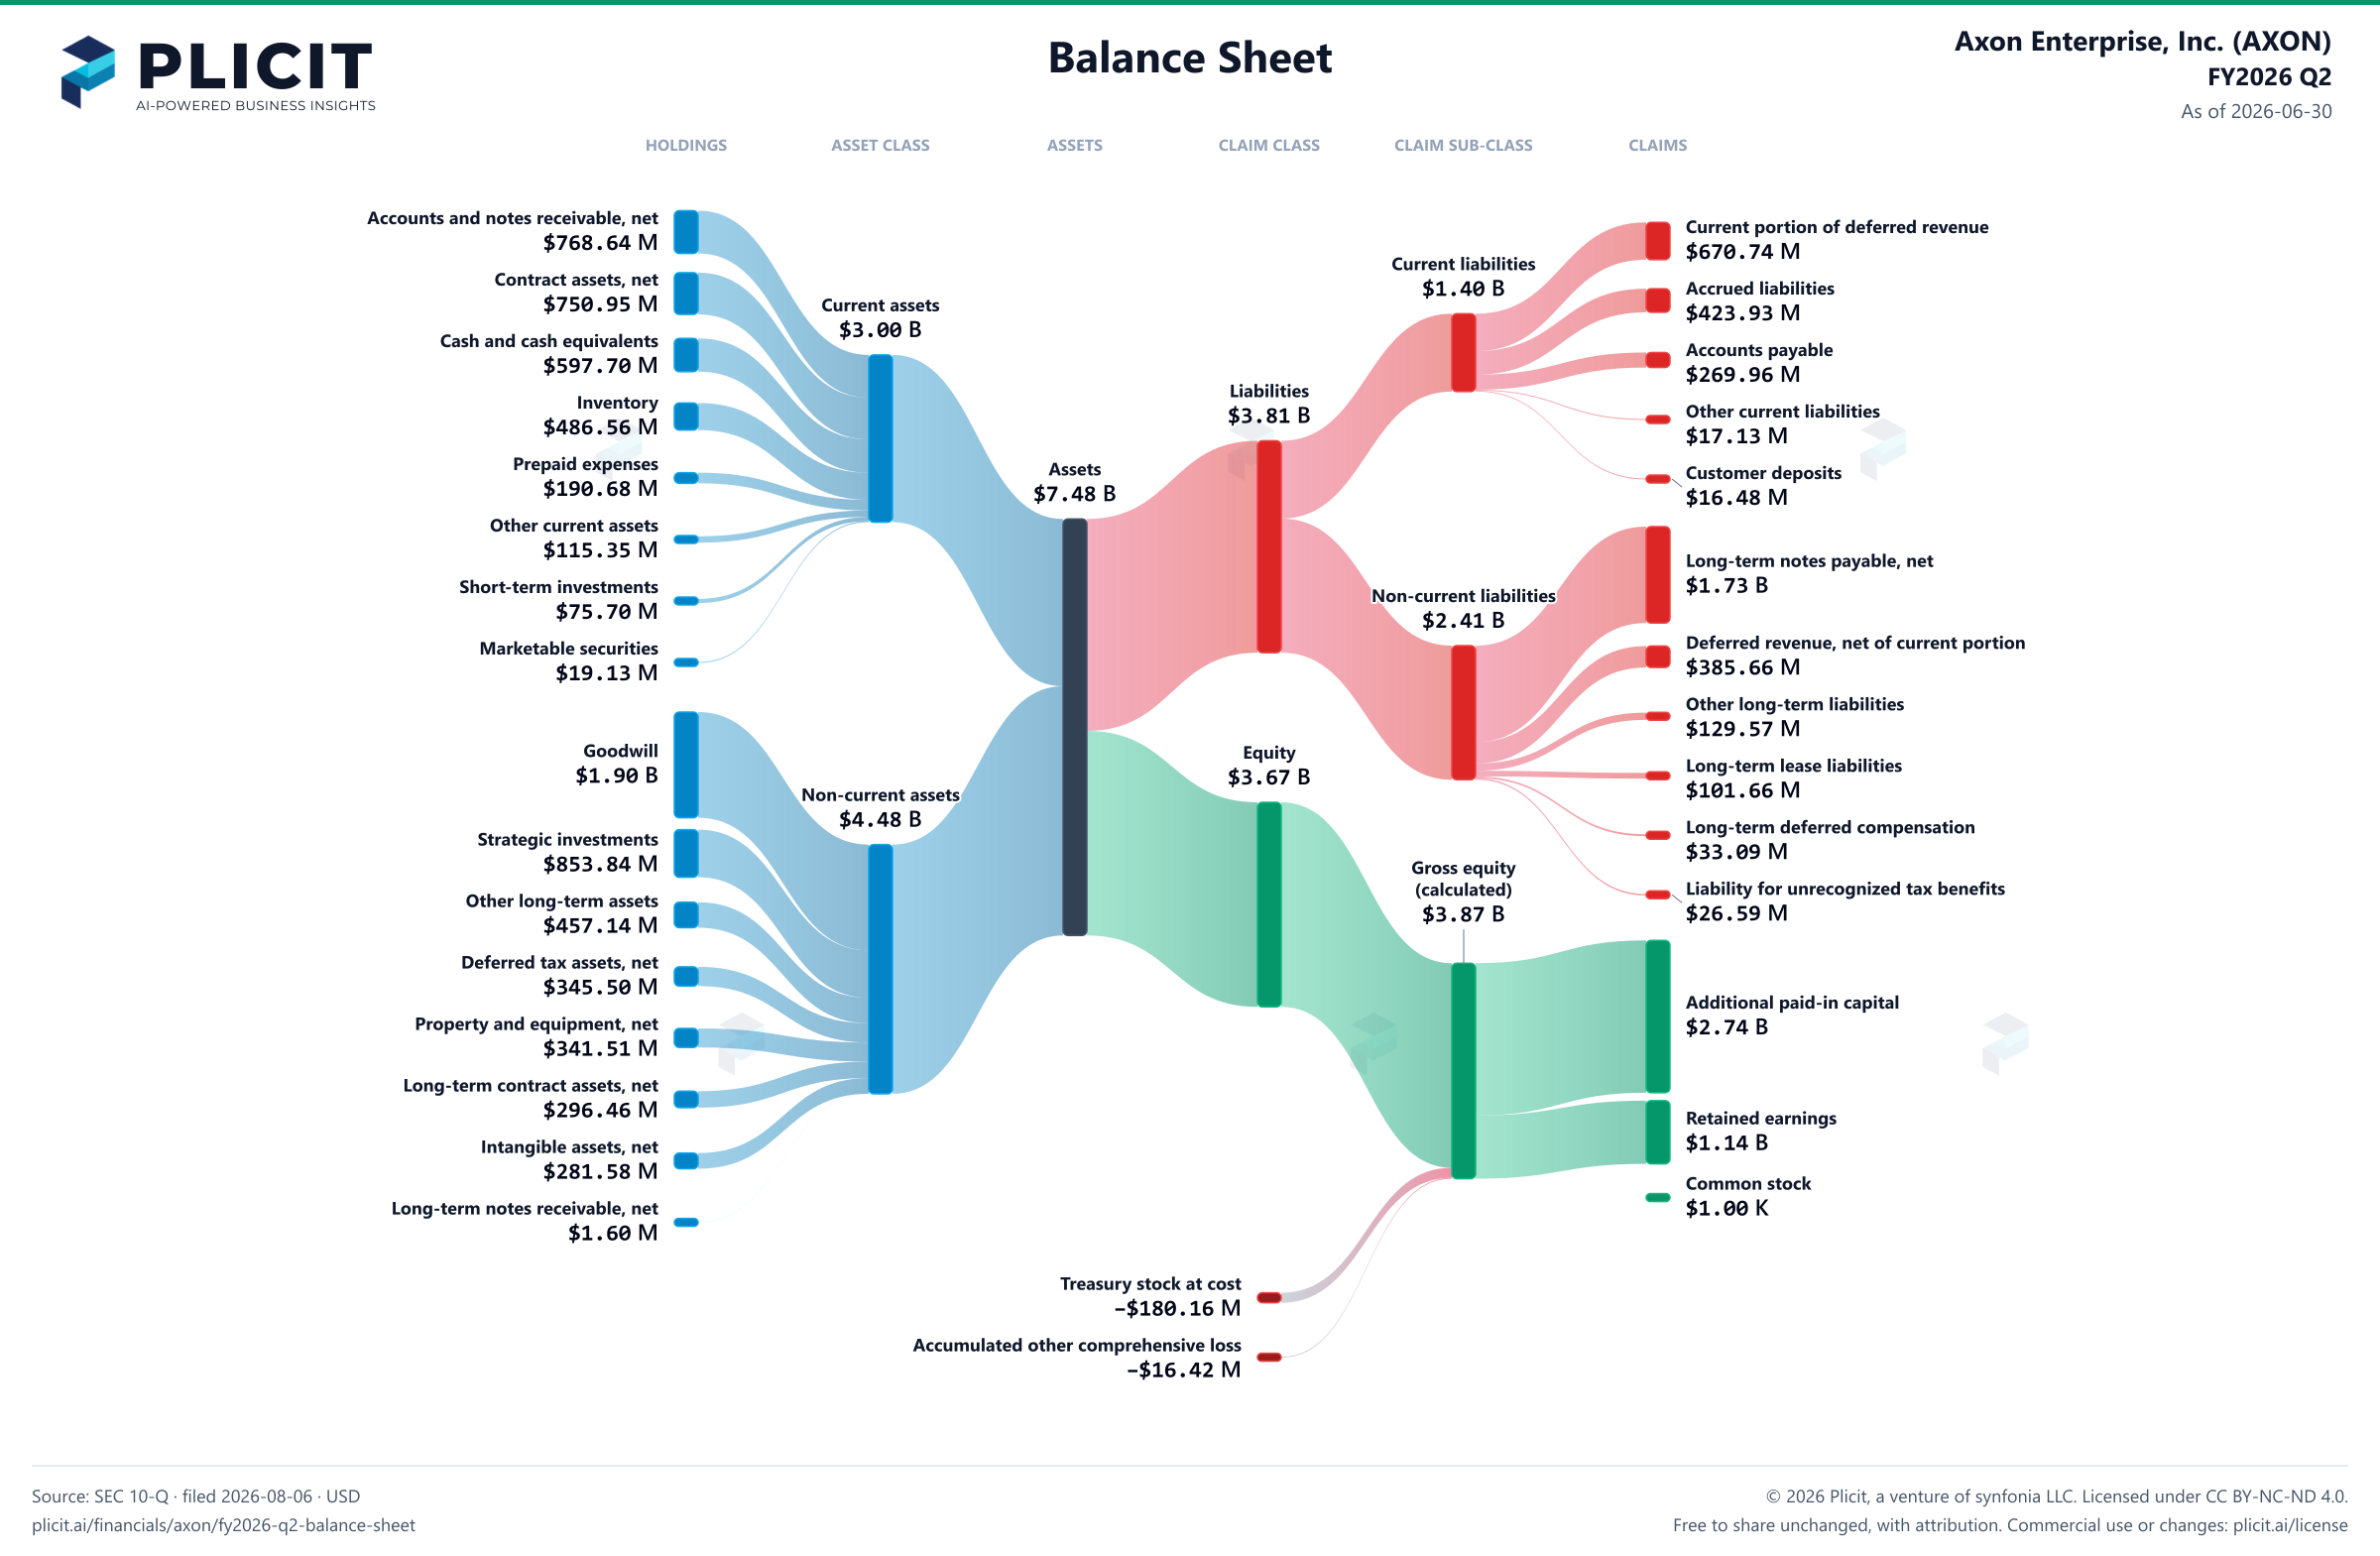
Axon Enterprise, Inc. (AXON) FY2026 Q2 Balance Sheet Sankey chart
Free to share unchanged, with credit to Plicit.ai · CC BY-NC-ND 4.0Download PNG

Newsletter

Get the teardowns by email

Subscribe if you want the public-company teardowns in your inbox when they're released.

Product waitlist

Health Check and Teardown for your own company

A health check uncovers insights of your private books, not a public ticker. Join this list to get notified as soon as we go-live!