
Published · Updated Source: Form 10-K on SEC EDGAR filed (opens in a new tab)

Key Takeaways

  • Domestic sales grew 7.9% to $4.05 B; international sales of $587.50 M barely moved.
  • Domestic sales now make 87.3% of Acuity's revenue, up from 86.4% a year earlier.
  • Domestic growth slowed to 7.9% from 15% the year before, even with QSC in the mix.
  • Domestic holds 71% of Acuity's long-term assets but brings in 87% of its sales.

The Unvarnished Truth

Acuity is a home-market story: 87% of its sales are domestic

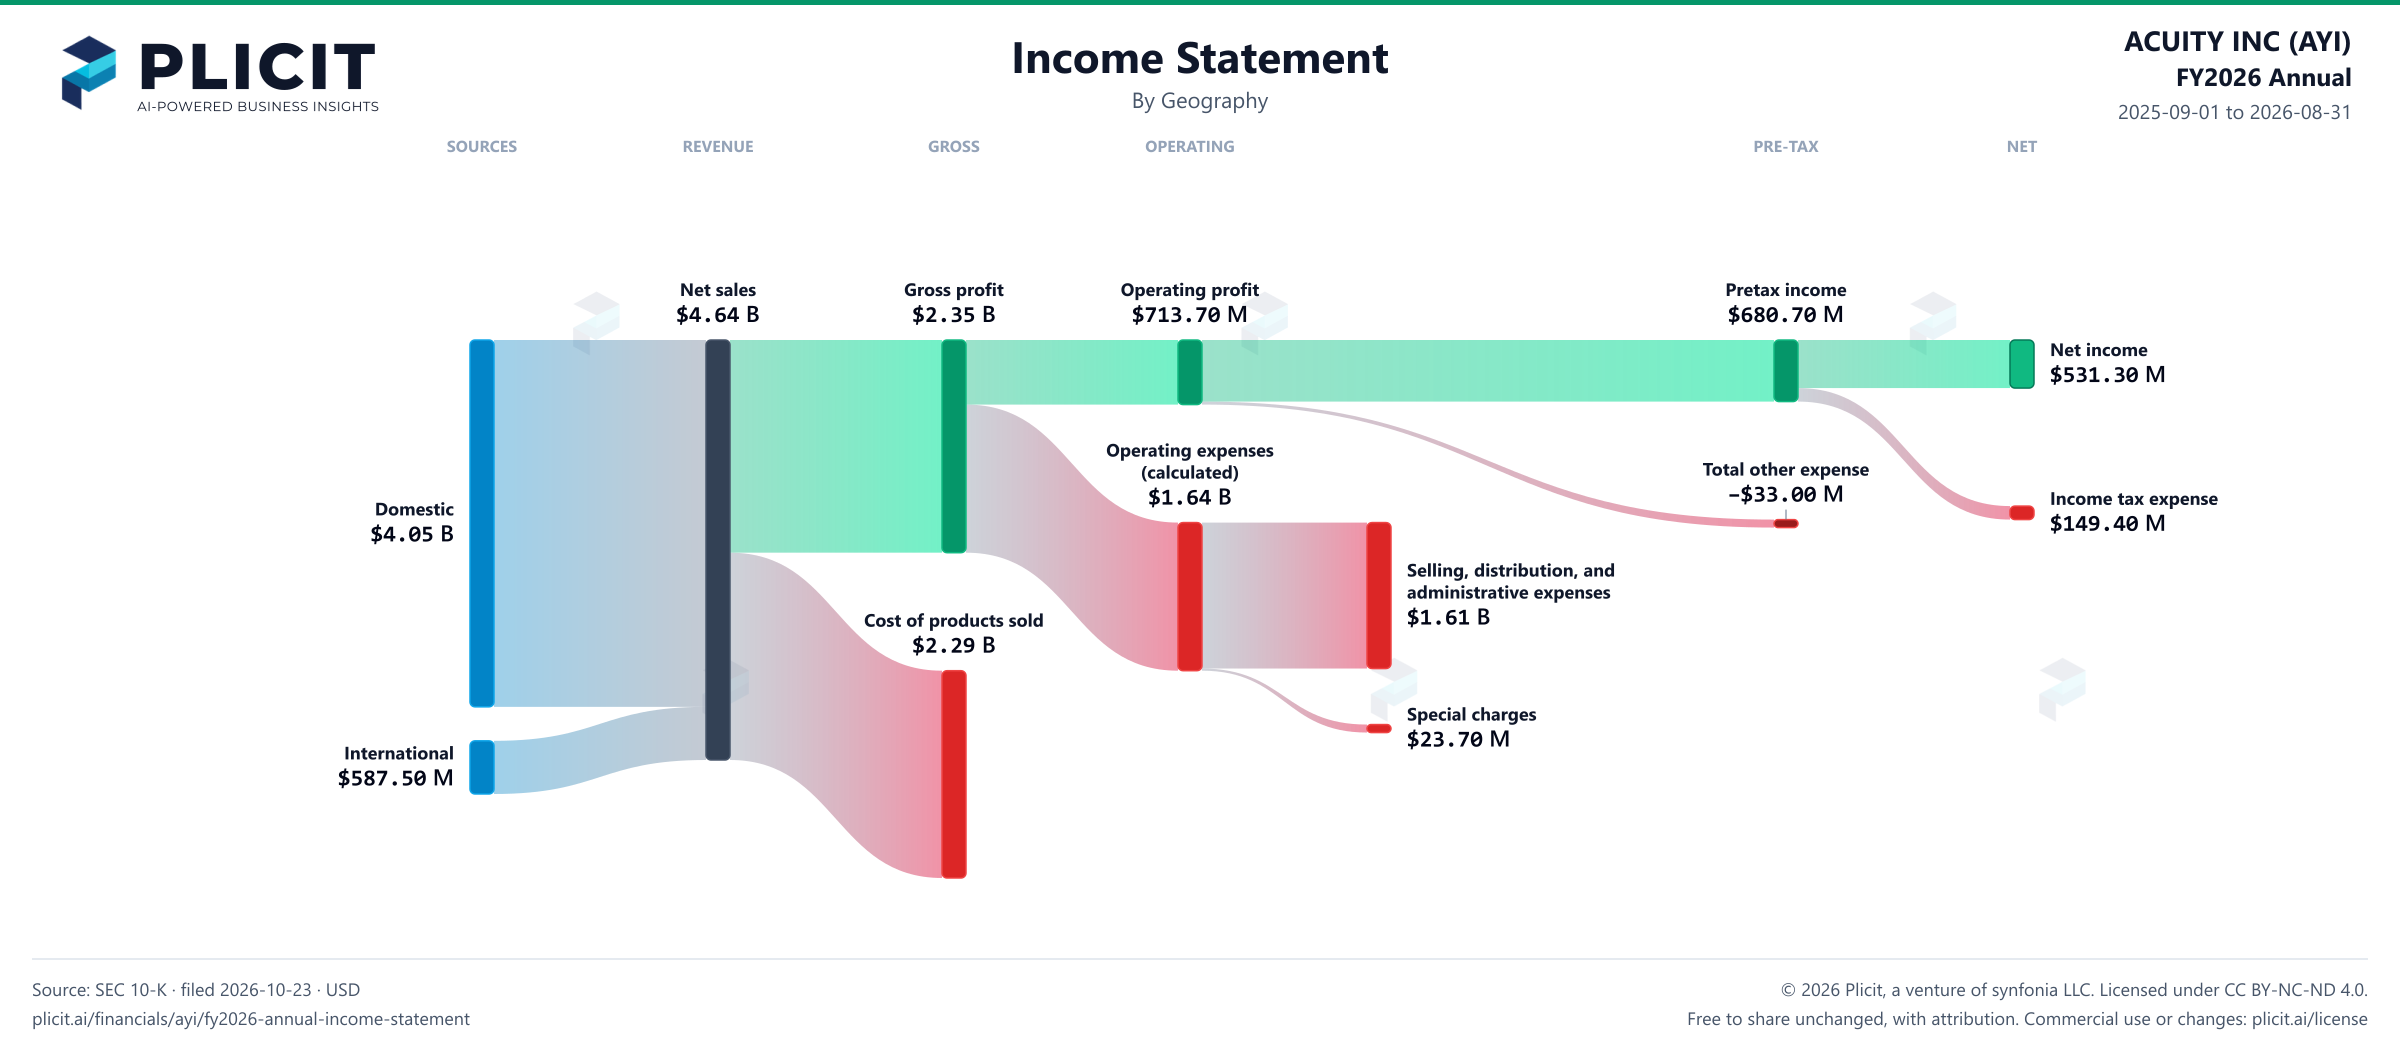
Acuity sold $4.05 B of its $4.64 B of goods at home in the year to August 31, 2026, 87% of the total. International sales were $587.50 M, a shade below $588.90 M a year earlier, while domestic sales rose 7.9%. So all of the year's growth, and then some, came from the home market. Even a full year of QSC, the $1.2 billion audio and video maker bought on January 1, 2025, did not lift that international line.

Follow the growth rates and the trend is cooling. Domestic sales grew 15% the year before, from $3.26 B to $3.76 B, and only 7.9% this year. Management says total sales grew on the QSC acquisition and Distech, offset by lower ABL sales. With ABL, the lighting arm, shrinking 1.0%, the home-market gain leans on AIS. Domestic also holds 71% of Acuity's long-term assets, so its plants and offices sit mostly at home.

For investors, the geographic picture is concentration, not diversification. With 87.3% of revenue at home, the domestic building market weighs heavier than any currency swing. International, at $587.50 M, is 13% of sales and was flat. Domestic growth has also slowed by about half in a year. Watch whether the international line finally moves as QSC's audio, video and control products reach customers abroad. If buying QSC could not lift foreign sales, what will?
2025-09-01 to 2026-08-31

Revenue by Geography

Swipe to see the full flow
ACUITY INC (AYI) FY2026 Annual P&L / Income StatementIncome statement for 2025-09-01 through 2026-08-31. View: Geography. Revenue uses this breakdown; costs and expenses retain the consolidated categories.SOURCESREVENUEGROSSOPERATINGPRE-TAXNETDomesticInternationalNet salesGross profitCost of products soldOperating profitOperating expenses (calculated)Selling, distribution, and administrative expensesSpecial chargesIncome before income taxesTotal other expenseNet incomeIncome tax expenseNet salesNet sales$4.64 BGross profitGross profit$2.35 BOperating profitOperating profit$713.70 MIncome before income taxesPretax income$680.70 MNet incomeNet income$531.30 MOperating expenses (calculated)Operating expenses(calculated)$1.64 BIncome tax expenseIncome tax expense$149.40 MDomesticDomestic$4.05 BTotal other expenseTotal other expense−$33.00 MSelling, distribution, and administrative expensesSelling, distribution, andadministrative expenses$1.61 BCost of products soldCost of products sold$2.29 BSpecial chargesSpecial charges$23.70 MInternationalInternational$587.50 M
Chart details

ACUITY INC (AYI) FY2026 Annual P&L / Income Statement

Income statement for 2025-09-01 through 2026-08-31. View: Geography. Revenue uses this breakdown; costs and expenses retain the consolidated categories.

Net sales
4,641,800,000 US dollars
Cost of products sold
2,291,100,000 US dollars
Gross profit
2,350,700,000 US dollars
Operating expenses (calculated)
1,637,000,000 US dollars
Operating profit
713,700,000 US dollars
Total other expense
negative 33,000,000 US dollars
Income before income taxes
680,700,000 US dollars
Income tax expense
149,400,000 US dollars
Net income
531,300,000 US dollars
Domestic
4,054,300,000 US dollars
International
587,500,000 US dollars
Selling, distribution, and administrative expenses
1,613,300,000 US dollars
Special charges
23,700,000 US dollars

Chart connections

  • Revenue less cost of revenue equals gross profit; gross profit less operating expenses equals operating income.
  • Operating income plus other income or expense equals income before tax. Income before tax less income tax expense or benefit equals net income.
ACUITY INC (AYI) FY2026 Annual Revenue by Geography Sankey chart
Free to share unchanged, with credit to Plicit.ai · CC BY-NC-ND 4.0Download PNG

Intelligent Insights for Investors

How has the mix of Acuity's sales by region shifted?

Toward the home market: Domestic made up 87.3% of revenue this year, against 86.4% a year earlier, while International lost share.

Is growth in Acuity's domestic sales speeding up or slowing down?

Slowing down: Domestic grew 7.9% from a year earlier, after 15% growth the year before.

Intelligent Insights for Suppliers

Where are Acuity's factories, offices and other long-term assets located?

Mostly at home: Domestic holds 71% of Acuity's long-term assets and brings in 87% of its sales this year.

Intelligent Insights for Everyone

Where in the world does Acuity make its sales?

Mostly at home: Domestic sales were $4.05 B of $4.64 B this year, with International the runner-up.

Product waitlist

Health Check and Teardown for your own company

A health check uncovers insights of your private books, not a public ticker. Join this list to get notified as soon as we go-live!