BridgeBio Pharma, Inc. (BBIO) FY2026 Q3 Balance Sheet

Published · Updated Source: Form 10-Q on SEC EDGAR filed (opens in a new tab)

Key Takeaways

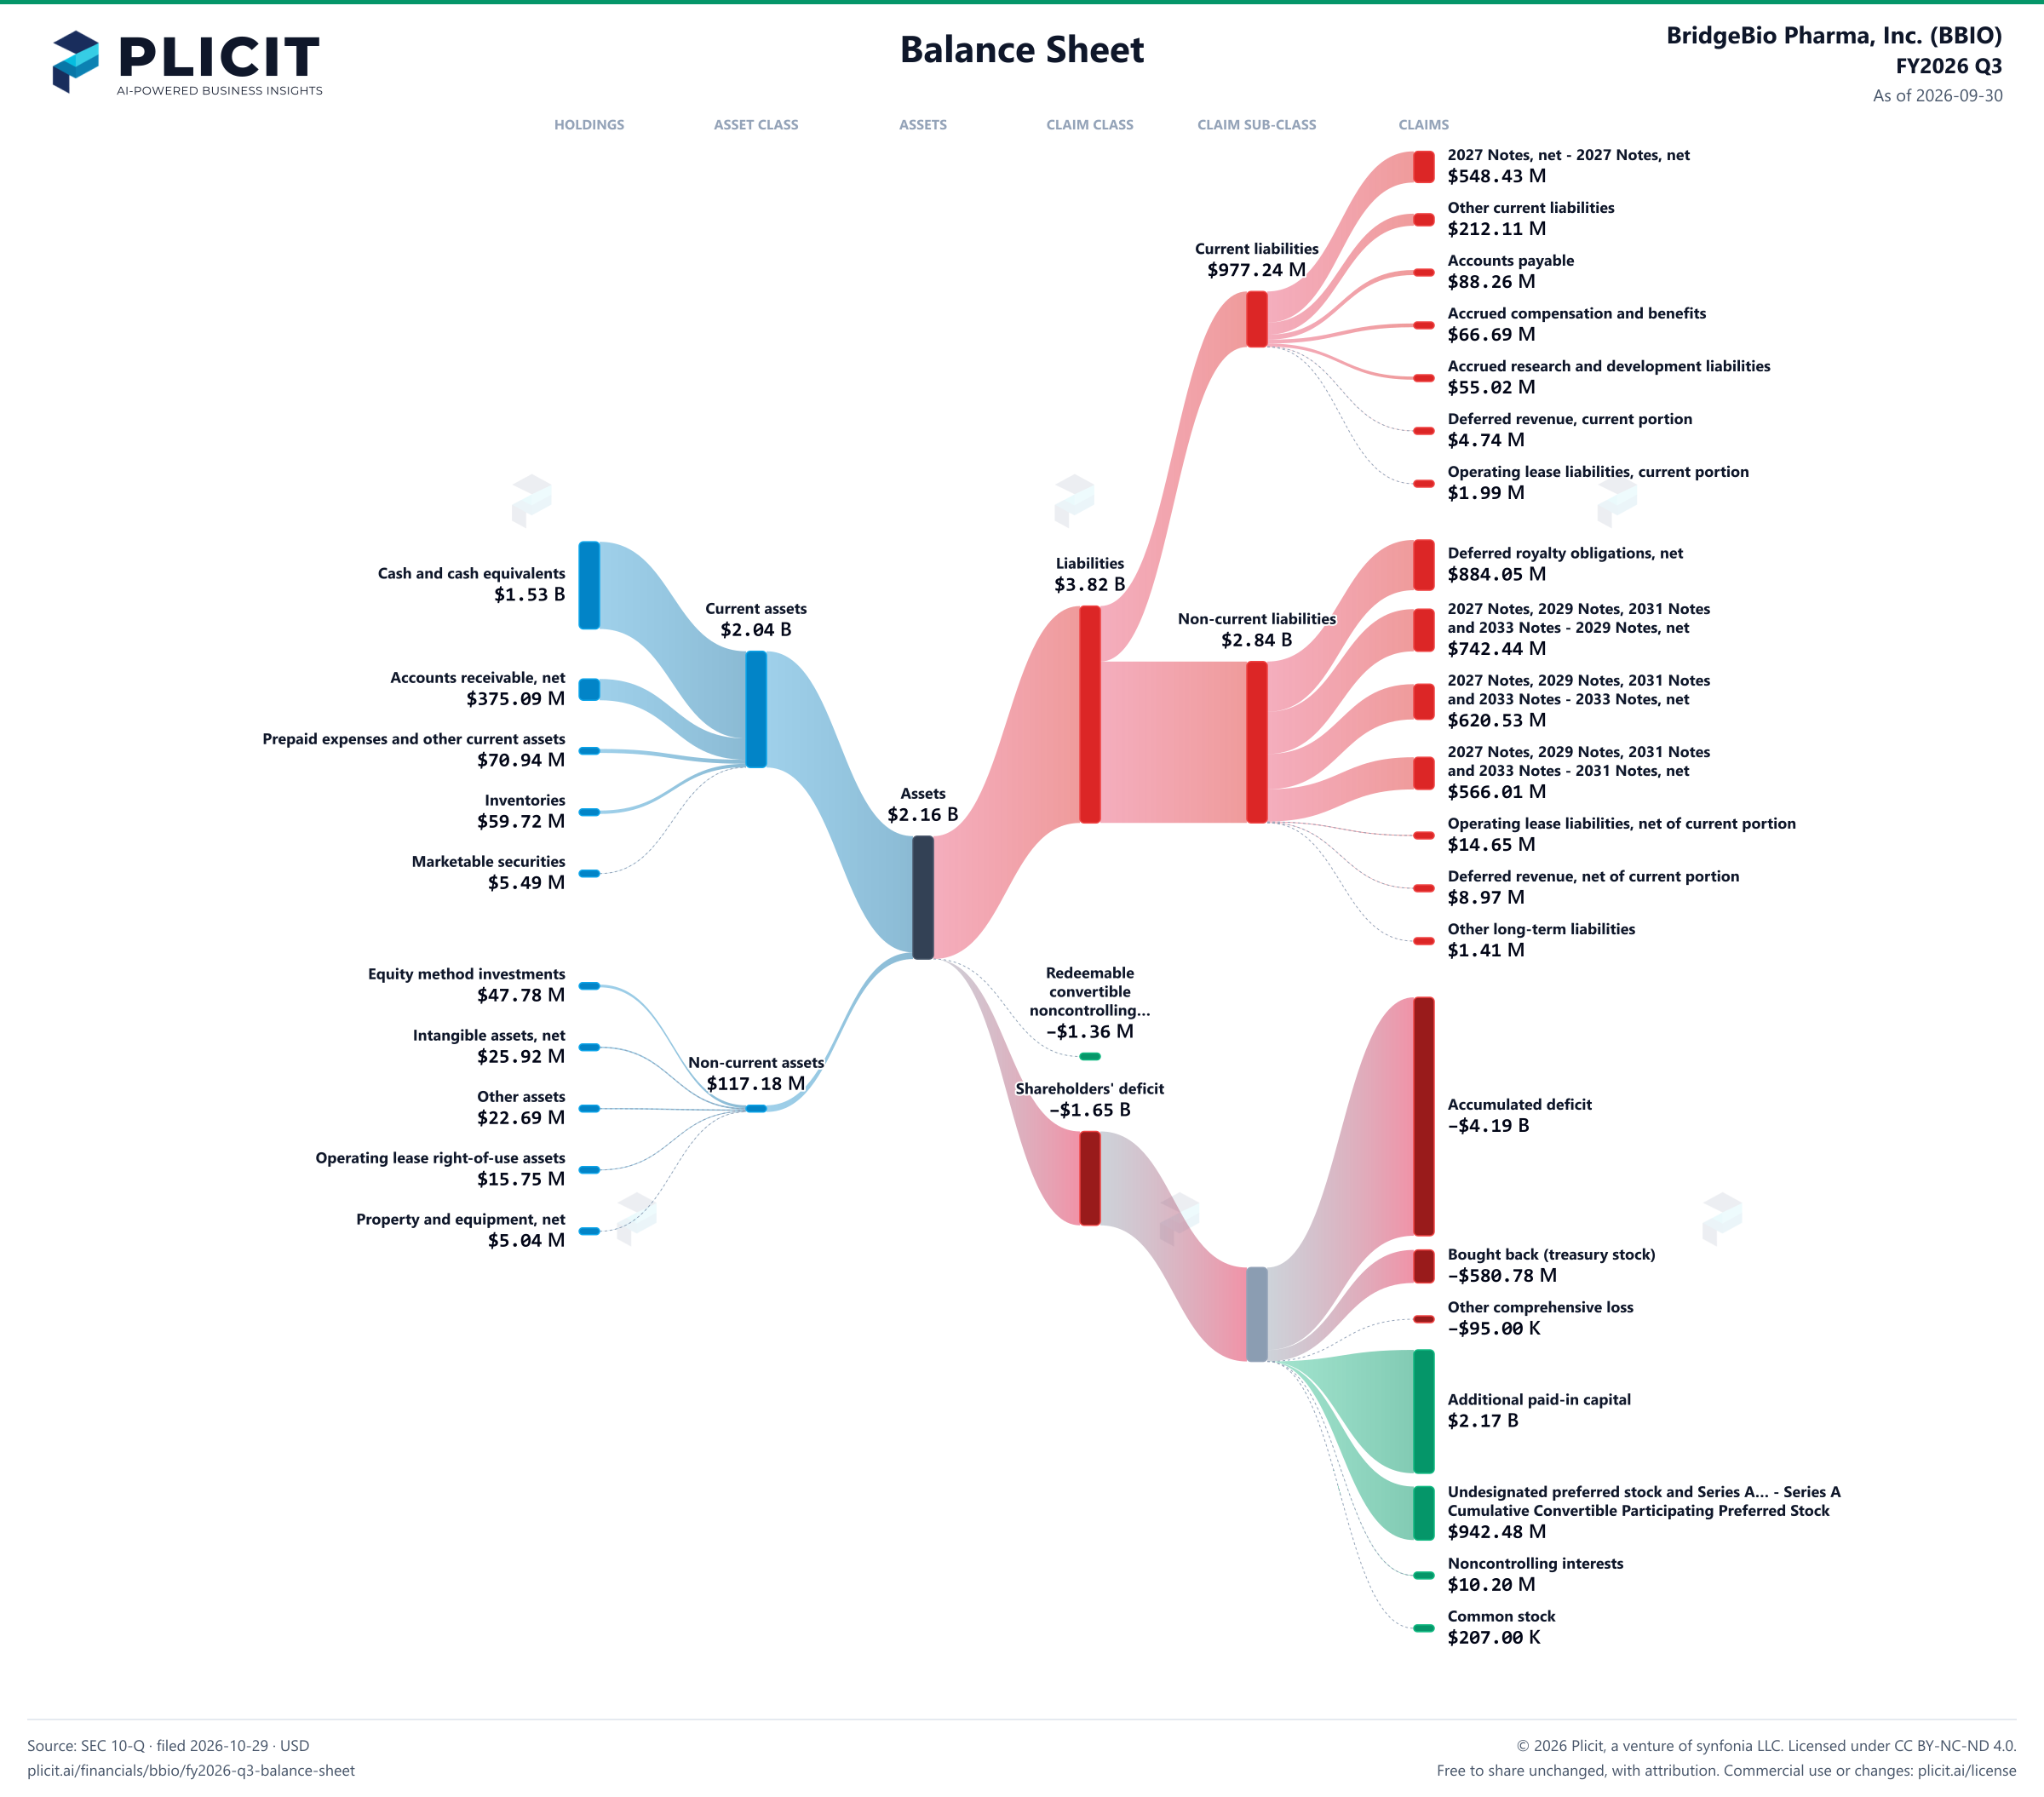
  • Debt reached $2.48 B, up 34% from $1.85 B at the last year-end, against $1.53 B of cash.
  • Liabilities of $3.82 B outweigh $2.16 B of assets, leaving a stockholders' deficit.
  • Cash covers the $588.50 M due within a year about 2.6 times, but the peak year asks $770.72 M.
  • Series A preferred stock of $933.90 M, sold in July, carries a 7% dividend that accrues.

The Unvarnished Truth

BridgeBio's $1.53 B cash pile was raised, not earned

BridgeBio's cash rose from $570.12 M at the last year-end to $1.53 B on September 30, 2026, and the balance sheet looks like a rescue. Look at where the money came from. In the nine months to September 30, operations used $312.55 M, while financing brought in $1.26 B. The largest pieces were $933.90 M of Series A preferred stock sold in July and $632.50 M of new convertible notes. The company also spent $252.50 M buying back its own common stock in the same period.

Why is debt up while equity sits so deep in deficit? Total debt reached $2.48 B, up 34% from $1.85 B at the last year-end, and the notes due within a year, $548.43 M, now sit in current liabilities. The preferred stock is booked as permanent equity, and its 7% dividend accrues whether or not the board declares it. That accrual added $26.29 M to the loss charged to common shareholders this quarter.

What it means: cash of $1.53 B covers the $588.50 M due within a year about 2.6 times, which looks safe. The peak year asks $770.72 M, and the cash is real but borrowed or sold, not earned. Operating cash flow was negative for the nine months, so every new dollar of cash came from a lender or a buyer of its stock. The equity deficit of $1.65 B says the owners' cushion is already gone. Will cash still outrun the debt coming due after another year of operating outflows?

As of 2026-09-30

Balance Sheet

Swipe to see the full flow
BridgeBio Pharma, Inc. (BBIO) FY2026 Q3 Balance SheetBalance sheet as of 2026-09-30. The chart shows assets, liabilities and equity at that date.Current liabilities$977.24 MLiabilities$3.82 BCurrent assets$2.04 BNon-current liabilities$2.84 BAssets$2.16 BRedeemableconvertiblenoncontrolling…−$1.36 MNon-current assets$117.18 MShareholders' deficit−$1.65 BHOLDINGSASSET CLASSASSETSCLAIM CLASSCLAIM SUB-CLASSCLAIMSCash and cash equivalentsAccounts receivable, netPrepaid expenses and other current assetsInventoriesMarketable securitiesEquity method investmentsIntangible assets, netOther assetsOperating lease right-of-use assetsProperty and equipment, net2027 Notes, net - 2027 Notes, netOther current liabilitiesAccounts payableAccrued compensation and benefitsAccrued research and development liabilitiesDeferred revenue, current portionOperating lease liabilities, current portionDeferred royalty obligations, net2027 Notes, 2029 Notes, 2031 Notes and 2033 Notes - 2029 Notes, net2027 Notes, 2029 Notes, 2031 Notes and 2033 Notes - 2033 Notes, net2027 Notes, 2029 Notes, 2031 Notes and 2033 Notes - 2031 Notes, netOperating lease liabilities, net of current portionDeferred revenue, net of current portionOther long-term liabilitiesAccumulated deficitTreasury stock, at cost; 7,597,172 shares as of June 30, 2026; 7,597,172 shares as of December 31, 2025Accumulated other comprehensive income (loss)Additional paid-in capitalUndesignated preferred stock and Series A preferred stock - Series A Cumulative Convertible Participating Preferred StockNoncontrolling interestsCommon stock, $0.001 par value; 500,000,000 shares authorized; 198,759,831 shares issued and 192,633,286 shares outstanding as of June 30, 2026, 202,369,129 shares issued and 194,771,957 shares outstanding as of December 31, 2025Current assetsNon-current assetsAssetsCurrent liabilitiesNon-current liabilitiesLiabilitiesRedeemable convertible noncontrolling interestsShareholders' deficitShareholders' deficit2027 Notes, net - 2027 Notes, net2027 Notes, net - 2027 Notes, net$548.43 MOther current liabilitiesOther current liabilities$212.11 MCurrent liabilitiesCurrent liabilities$977.24 MAccounts payableAccounts payable$88.26 MAccrued compensation and benefitsAccrued compensation and benefits$66.69 MAccrued research and development liabilitiesAccrued research and development liabilities$55.02 MDeferred revenue, current portionDeferred revenue, current portion$4.74 MOperating lease liabilities, current portionOperating lease liabilities, current portion$1.99 MDeferred royalty obligations, netDeferred royalty obligations, net$884.05 MLiabilitiesLiabilities$3.82 BCash and cash equivalentsCash and cash equivalents$1.53 BCurrent assetsCurrent assets$2.04 B2027 Notes, 2029 Notes, 2031 Notes and 2033 Notes - 2029 Notes, net2027 Notes, 2029 Notes, 2031 Notesand 2033 Notes - 2029 Notes, net$742.44 MNon-current liabilitiesNon-current liabilities$2.84 BAccounts receivable, netAccounts receivable, net$375.09 M2027 Notes, 2029 Notes, 2031 Notes and 2033 Notes - 2033 Notes, net2027 Notes, 2029 Notes, 2031 Notesand 2033 Notes - 2033 Notes, net$620.53 MPrepaid expenses and other current assetsPrepaid expenses and other current assets$70.94 M2027 Notes, 2029 Notes, 2031 Notes and 2033 Notes - 2031 Notes, net2027 Notes, 2029 Notes, 2031 Notesand 2033 Notes - 2031 Notes, net$566.01 MAssetsAssets$2.16 BInventoriesInventories$59.72 MOperating lease liabilities, net of current portionOperating lease liabilities, net of current portion$14.65 MMarketable securitiesMarketable securities$5.49 MDeferred revenue, net of current portionDeferred revenue, net of current portion$8.97 MOther long-term liabilitiesOther long-term liabilities$1.41 MRedeemable convertible noncontrolling interestsRedeemableconvertiblenoncontrolling…−$1.36 MEquity method investmentsEquity method investments$47.78 MIntangible assets, netIntangible assets, net$25.92 MNon-current assetsNon-current assets$117.18 MShareholders' deficitShareholders' deficit−$1.65 BOther assetsOther assets$22.69 MAccumulated deficitAccumulated deficit−$4.19 BOperating lease right-of-use assetsOperating lease right-of-use assets$15.75 MProperty and equipment, netProperty and equipment, net$5.04 MTreasury stock, at cost; 7,597,172 shares as of June 30, 2026; 7,597,172 shares as of December 31, 2025Bought back (treasury stock)−$580.78 MAccumulated other comprehensive income (loss)Other comprehensive loss−$95.00 KAdditional paid-in capitalAdditional paid-in capital$2.17 BUndesignated preferred stock and Series A preferred stock - Series A Cumulative Convertible Participating Preferred StockUndesignated preferred stock and Series A… - Series ACumulative Convertible Participating Preferred Stock$942.48 MNoncontrolling interestsNoncontrolling interests$10.20 MCommon stock, $0.001 par value; 500,000,000 shares authorized; 198,759,831 shares issued and 192,633,286 shares outstanding as of June 30, 2026, 202,369,129 shares issued and 194,771,957 shares outstanding as of December 31, 2025Common stock$207.00 K
Chart details

BridgeBio Pharma, Inc. (BBIO) FY2026 Q3 Balance Sheet

Balance sheet as of 2026-09-30. The chart shows assets, liabilities and equity at that date.

Assets
2,161,786,000 US dollars
Current assets
2,044,606,000 US dollars
Non-current assets
117,180,000 US dollars
Liabilities
3,815,291,000 US dollars
Current liabilities
977,237,000 US dollars
Non-current liabilities
2,838,054,000 US dollars
Shareholders' deficit
negative 1,652,142,000 US dollars
Redeemable convertible noncontrolling interests
negative 1,363,000 US dollars
Noncontrolling interest
10,200,000 US dollars. Included in consolidated equity; this amount is not added again.
Cash and cash equivalents
1,533,363,000 US dollars
Accounts receivable, net
375,089,000 US dollars
Prepaid expenses and other current assets
70,944,000 US dollars
Inventories
59,718,000 US dollars
Marketable securities
5,492,000 US dollars
Equity method investments
47,783,000 US dollars
Intangible assets, net
25,923,000 US dollars
Other assets
22,686,000 US dollars
Operating lease right-of-use assets
15,746,000 US dollars
Property and equipment, net
5,042,000 US dollars
2027 Notes, net - 2027 Notes, net
548,430,000 US dollars
Other current liabilities
212,114,000 US dollars
Accounts payable
88,258,000 US dollars
Accrued compensation and benefits
66,686,000 US dollars
Accrued research and development liabilities
55,018,000 US dollars
Deferred revenue, current portion
4,744,000 US dollars
Operating lease liabilities, current portion
1,987,000 US dollars
Deferred royalty obligations, net
884,053,000 US dollars
2027 Notes, 2029 Notes, 2031 Notes and 2033 Notes - 2029 Notes, net
742,437,000 US dollars
2027 Notes, 2029 Notes, 2031 Notes and 2033 Notes - 2033 Notes, net
620,533,000 US dollars
2027 Notes, 2029 Notes, 2031 Notes and 2033 Notes - 2031 Notes, net
566,013,000 US dollars
Operating lease liabilities, net of current portion
14,645,000 US dollars
Deferred revenue, net of current portion
8,968,000 US dollars
Other long-term liabilities
1,405,000 US dollars
2027 Notes, 2029 Notes, 2031 Notes and 2033 Notes - 2027 Notes, net
0 US dollars
Additional paid-in capital
2,170,006,000 US dollars
Undesignated preferred stock and Series A preferred stock - Series A Cumulative Convertible Participating Preferred Stock
942,478,000 US dollars
Common stock, $0.001 par value; 500,000,000 shares authorized; 198,759,831 shares issued and 192,633,286 shares outstanding as of June 30, 2026, 202,369,129 shares issued and 194,771,957 shares outstanding as of December 31, 2025
207,000 US dollars
Undesignated preferred stock and Series A preferred stock - Undesignated Preferred Stock
0 US dollars
Noncontrolling interests
10,200,000 US dollars
Accumulated deficit
negative 4,194,163,000 US dollars
Treasury stock, at cost; 7,597,172 shares as of June 30, 2026; 7,597,172 shares as of December 31, 2025
negative 580,775,000 US dollars
Accumulated other comprehensive income (loss)
negative 95,000 US dollars

Chart connections

  • Assets equal liabilities plus temporary equity plus consolidated equity. Consolidated equity includes noncontrolling interests when reported.
  • Treasury shares and other negative equity contributions reduce equity.
BridgeBio Pharma, Inc. (BBIO) FY2026 Q3 Balance Sheet Sankey chart
Free to share unchanged, with credit to Plicit.ai · CC BY-NC-ND 4.0Download PNG

Intelligent Insights for Investors

How much debt does BridgeBio have?

It owed $2.48 B of debt on September 30, 2026, up 34% on its level at the last year-end. Cash on hand of $1.53 B could pay off only part of it.

Has BridgeBio built up profit over its lifetime or accumulated a deficit?

It has an accumulated deficit of $4.19 B on September 30, 2026, against $3.82 B at the last year-end. A deficit can come from past losses or from dividends and buybacks charged against retained earnings.

Intelligent Insights for Lenders

When does BridgeBio's debt come due?

Mostly in the next few years. The repayment schedule totals $2.63 B, and its largest single year carries $770.72 M. Of the schedule, $588.50 M is due within a year, against $1.53 B of cash on hand.

Intelligent Insights for Employees

Can BridgeBio cover the bills due within a year?

It looks that way. For each dollar due within a year, it held $2.09 in cash and things expected to become cash on September 30, 2026, against $2.77 at the last year-end. Inventory and customer bills count here, so the cover is only as good as how quickly they are sold or collected.

Product waitlist

Health Check and Teardown for your own company

A health check uncovers insights of your private books, not a public ticker. Join this list to get notified as soon as we go-live!