
Blackstone Inc. (BX) FY2024 Annual Balance Sheet
As of 2024-12-31
Balance Sheet
As of 2024-12-31
Swipe to see the full flow
Chart details
Blackstone Inc. (BX) FY2024 Annual Balance Sheet
Balance sheet as of 2024-12-31. The chart shows assets, liabilities and equity at that date.
- Assets
- 43,469,875,000 US dollars
- Liabilities
- 23,974,860,000 US dollars
- Equity
- 18,693,616,000 US dollars
- Redeemable Non-Controlling Interests in Consolidated Entities
- 801,399,000 US dollars
- Noncontrolling interest
- 6,154,943,000 US dollars. Included in consolidated equity; this amount is not added again.
- Investments
- 29,800,566,000 US dollars
- Due from Affiliates
- 5,409,315,000 US dollars
- Deferred Tax Assets
- 2,003,948,000 US dollars
- Cash and Cash Equivalents
- 1,972,140,000 US dollars
- Goodwill
- 1,890,202,000 US dollars
- Other Assets
- 947,859,000 US dollars
- Right-of-Use Assets
- 838,620,000 US dollars
- Accounts Receivable
- 237,930,000 US dollars
- Cash Held by Blackstone Funds and Other
- 204,052,000 US dollars
- Intangible Assets, Net
- 165,243,000 US dollars
- Loans Payable
- 11,320,956,000 US dollars
- Accrued Compensation and Benefits
- 6,087,700,000 US dollars
- Due to Affiliates
- 2,808,148,000 US dollars
- Accounts Payable, Accrued Expenses and Other Liabilities
- 2,792,314,000 US dollars
- Operating Lease Liabilities
- 965,742,000 US dollars
- Additional Paid-in-Capital
- 7,444,561,000 US dollars
- Non-Controlling Interests in Blackstone Holdings
- 4,326,352,000 US dollars
- Retained Earnings
- 808,079,000 US dollars
- Common Stock, $0.00001 par value, 90 billion shares authorized, (731,925,965 shares issued and outstanding as of December 31, 2024; 719,358,114 shares issued and outstanding as of December 31, 2023)
- 7,000 US dollars
- Preferred Stock, Value, Issued - Series I Preferred Stock
- 0 US dollars
- Preferred Stock, Value, Issued - Series II Preferred Stock
- 0 US dollars
- Non-Controlling Interests in Consolidated Entities
- 6,154,943,000 US dollars
- Accumulated Other Comprehensive Loss
- negative 40,326,000 US dollars
- Gross equity (calculated)
- 18,733,942,000 US dollars. Net equity plus the magnitudes of its negative contributions equals gross positive equity. The negative contributions enter this reconciliation as add-backs; their filed signs stay negative.
Chart connections
- Assets equal liabilities plus temporary equity plus consolidated equity. Consolidated equity includes noncontrolling interests when reported.
- Treasury shares and other negative equity contributions reduce equity.
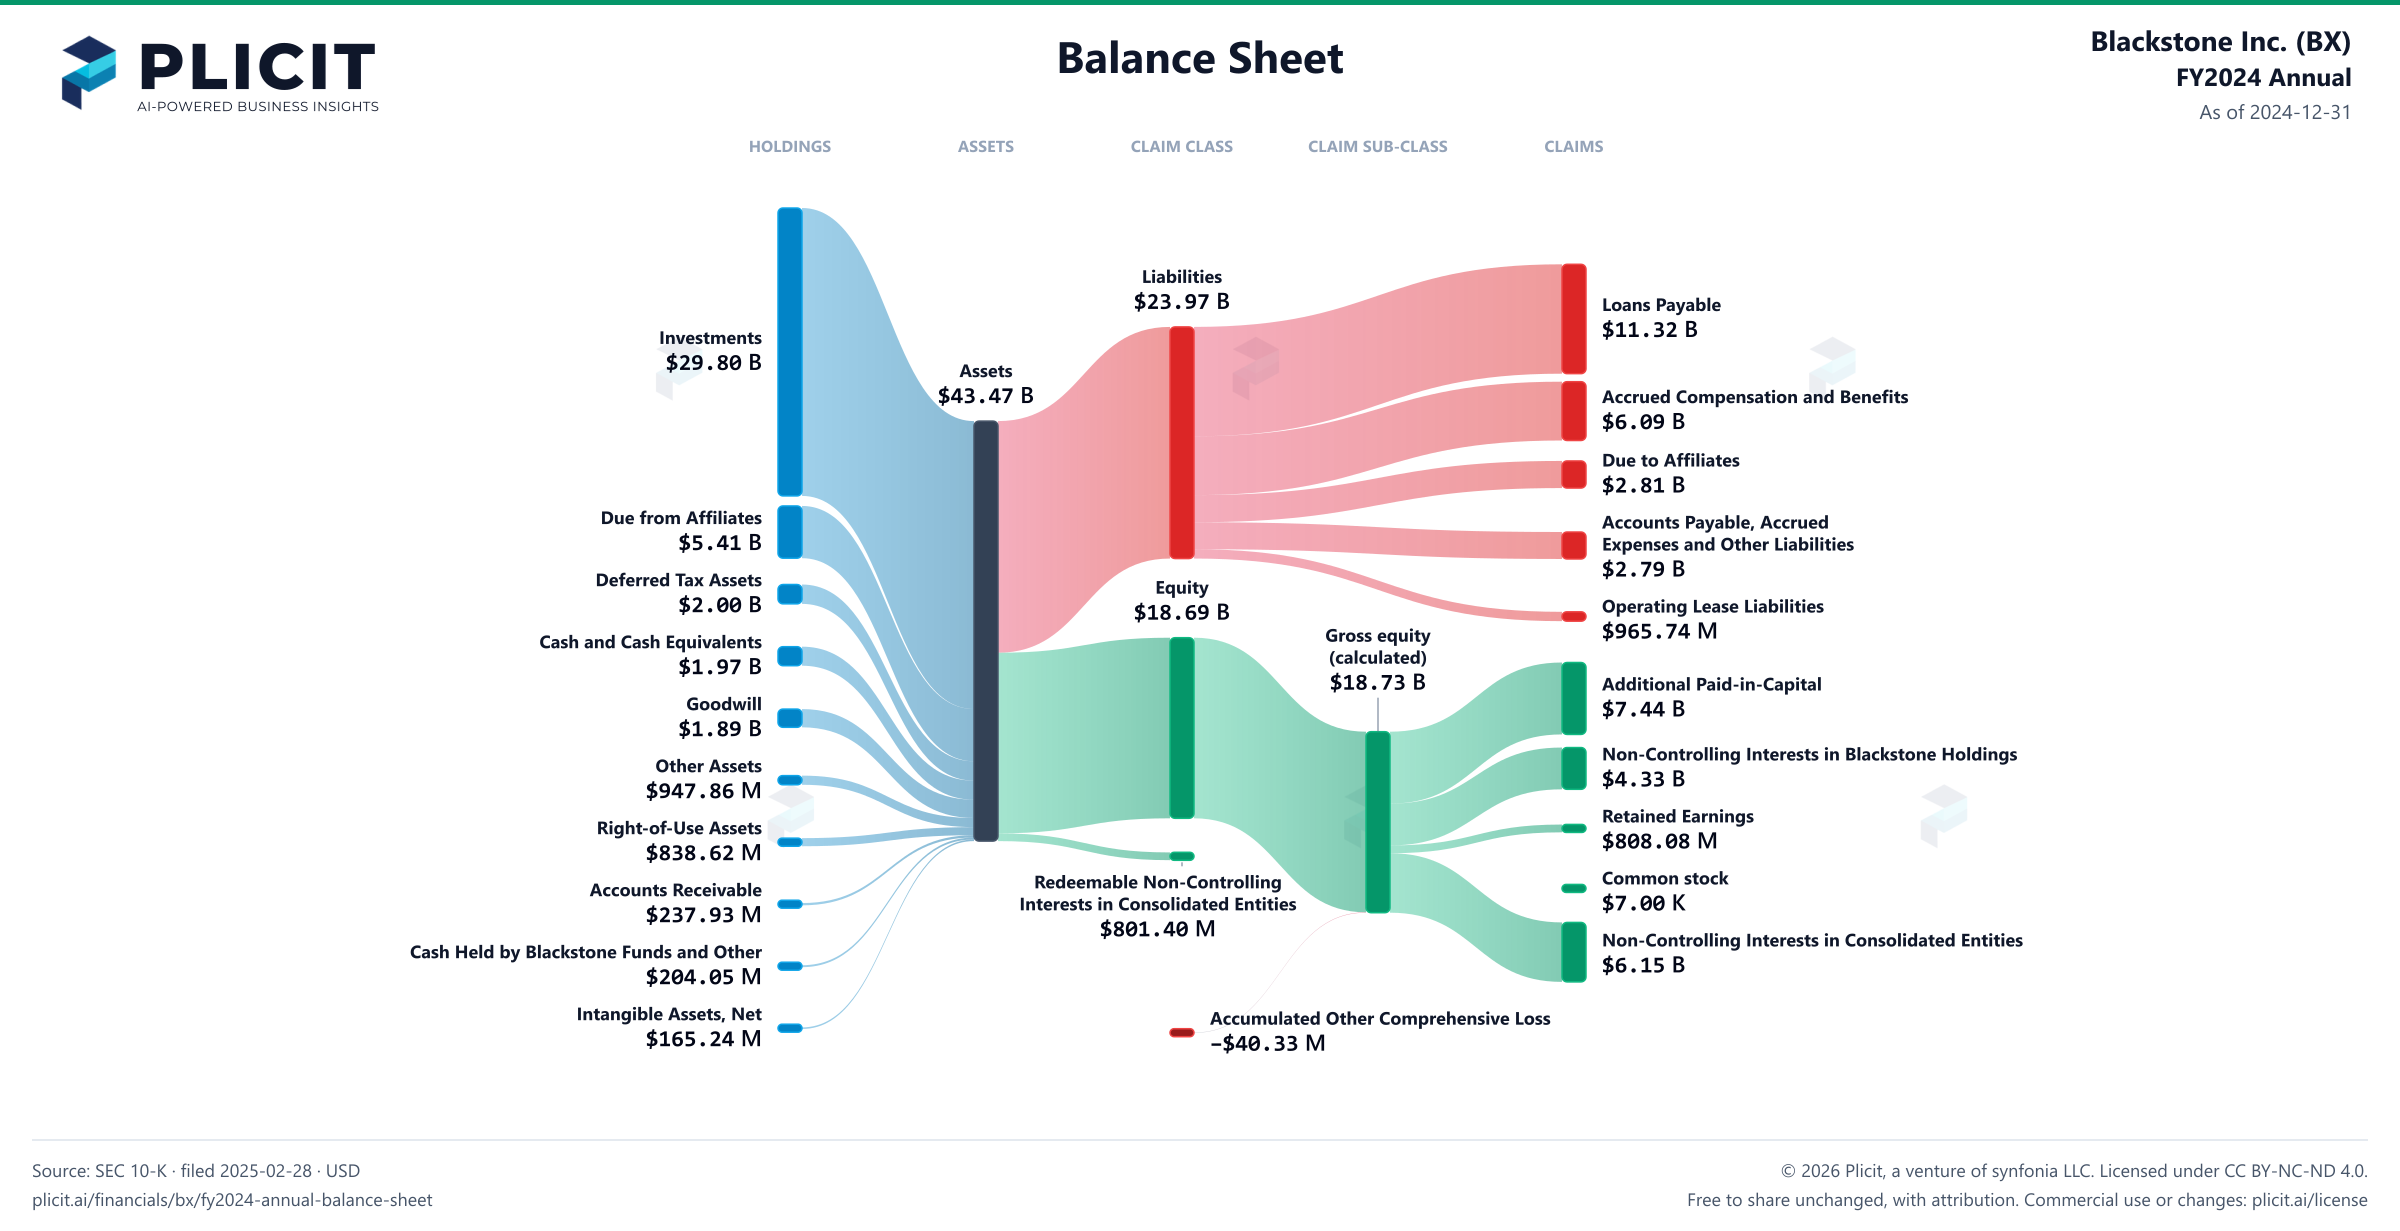
Free to share unchanged, with credit to Plicit.ai · CC BY-NC-ND 4.0Download PNG
Product waitlist
Health Check and Teardown for your own company
A health check uncovers insights of your private books, not a public ticker. Join this list to get notified as soon as we go-live!