
Cboe Global Markets, Inc. (CBOE) FY2026 Q2 P&L / Income Statement

2026-04-01 to 2026-06-30

Swipe to see the full flow
Cboe Global Markets, Inc. (CBOE) FY2026 Q2 P&L / Income StatementIncome statement for 2026-04-01 through 2026-06-30. View: Segments by Contract With Customer, Contract Type. Revenue uses this breakdown; costs and expenses retain the consolidated categories.SOURCESREVENUEGROSSOPERATINGPRE-TAXNETOptions - Transaction and clearing feesNorth American Equities - Transaction and clearing feesNorth American Equities - Regulatory feesEurope and Asia Pacific - Transaction and clearing feesOptions - Access and capacity feesOptions - Market data feesOptions - Regulatory feesNorth American Equities - Access and capacity feesNorth American Equities - Market data feesEurope and Asia Pacific - Other revenueFutures - Transaction and clearing feesGlobal FX - Transaction and clearing feesEurope and Asia Pacific - Access and capacity feesEurope and Asia Pacific - Market data feesFutures - Access and capacity feesGlobal FX - Access and capacity feesFutures - Market data feesNorth American Equities - Other revenueOptions - Other revenueGlobal FX - Market data feesGlobal FX - Other revenueTotal revenuesRevenues less cost of revenuesTotal cost of revenuesOperating incomeTotal operating expensesCompensation and benefitsDepreciation and amortizationTechnology support servicesProfessional fees and outside servicesTravel and promotional expensesFacilities costsOther expensesOther income (expense), net (calculated)Income before income tax provisionNet incomeIncome tax provisionOther income (expense), net (calculated)Other income,net (calculated)$18.70 MIncome before income tax provisionIncome beforeincome tax provision$494.70 MRevenues less cost of revenuesRevenues lesscost of revenues$731.60 MTotal revenuesTotal revenues$1.44 BOperating incomeOperating income$476.00 MNet incomeNet income$353.10 MOptions - Transaction and clearing feesOptions - Transactionand clearing fees$601.40 MTotal operating expensesTotal operatingexpenses$255.60 MIncome tax provisionIncome taxes$141.60 MNorth American Equities - Transaction and clearing feesNorth American Equities -Transaction and clearing fees$321.30 MCompensation and benefitsCompensation and benefits$154.70 MTotal cost of revenuesTotal cost of revenues$711.20 MNorth American Equities - Regulatory feesNorth American Equities- Regulatory fees$122.00 MDepreciation and amortizationDepreciation and amortization$28.10 MTechnology support servicesTechnology support services$26.20 MEurope and Asia Pacific - Transaction and clearing feesEurope and Asia Pacific -Transaction and clearing fees$64.10 MProfessional fees and outside servicesProfessional feesand outside services$22.40 MOptions - Access and capacity feesOptions - Access and capacity fees$54.10 MTravel and promotional expensesTravel and promotional expenses$13.20 MOptions - Market data feesOptions - Market data fees$42.70 MFacilities costsFacilities costs$6.10 MOptions - Regulatory feesOptions - Regulatory fees$42.60 MOther expensesOther expenses$4.90 MNorth American Equities - Access and capacity feesNorth American Equities -Access and capacity fees$40.30 MNorth American Equities - Market data feesNorth American Equities- Market data fees$33.80 MEurope and Asia Pacific - Other revenueEurope and AsiaPacific - Other revenue$29.60 MFutures - Transaction and clearing feesFutures - Transactionand clearing fees$24.70 MGlobal FX - Transaction and clearing feesGlobal FX - Transactionand clearing fees$24.30 MEurope and Asia Pacific - Access and capacity feesEurope and Asia Pacific -Access and capacity fees$12.20 MEurope and Asia Pacific - Market data feesEurope and Asia Pacific- Market data fees$11.90 MFutures - Access and capacity feesFutures - Access and capacity fees$5.80 MGlobal FX - Access and capacity feesGlobal FX - Access and capacity fees$3.20 MFutures - Market data feesFutures - Market data fees$2.90 MNorth American Equities - Other revenueNorth American Equities- Other revenue$2.60 MOptions - Other revenueOptions - Other revenue$2.30 MGlobal FX - Market data feesGlobal FX - Market data fees$500.00 KGlobal FX - Other revenueGlobal FX - Other revenue$500.00 K
Chart details

Cboe Global Markets, Inc. (CBOE) FY2026 Q2 P&L / Income Statement

Income statement for 2026-04-01 through 2026-06-30. View: Segments by Contract With Customer, Contract Type. Revenue uses this breakdown; costs and expenses retain the consolidated categories.

Total revenues
1,442,800,000 US dollars
Total cost of revenues
711,200,000 US dollars
Revenues less cost of revenues
731,600,000 US dollars
Total operating expenses
255,600,000 US dollars
Operating income
476,000,000 US dollars
Other income (expense), net (calculated)
18,700,000 US dollars
Income before income tax provision
494,700,000 US dollars
Income tax provision
141,600,000 US dollars
Net income
353,100,000 US dollars
Europe and Asia Pacific - Access and capacity fees
12,200,000 US dollars
Europe and Asia Pacific - Market data fees
11,900,000 US dollars
Europe and Asia Pacific - Other revenue
29,600,000 US dollars
Europe and Asia Pacific - Regulatory fees
0 US dollars
Europe and Asia Pacific - Transaction and clearing fees
64,100,000 US dollars
Futures - Access and capacity fees
5,800,000 US dollars
Futures - Market data fees
2,900,000 US dollars
Futures - Other revenue
0 US dollars
Futures - Regulatory fees
0 US dollars
Futures - Transaction and clearing fees
24,700,000 US dollars
Global FX - Access and capacity fees
3,200,000 US dollars
Global FX - Market data fees
500,000 US dollars
Global FX - Other revenue
500,000 US dollars
Global FX - Regulatory fees
0 US dollars
Global FX - Transaction and clearing fees
24,300,000 US dollars
North American Equities - Access and capacity fees
40,300,000 US dollars
North American Equities - Market data fees
33,800,000 US dollars
North American Equities - Other revenue
2,600,000 US dollars
North American Equities - Regulatory fees
122,000,000 US dollars
North American Equities - Transaction and clearing fees
321,300,000 US dollars
Options - Access and capacity fees
54,100,000 US dollars
Options - Market data fees
42,700,000 US dollars
Options - Other revenue
2,300,000 US dollars
Options - Regulatory fees
42,600,000 US dollars
Options - Transaction and clearing fees
601,400,000 US dollars
Compensation and benefits
154,700,000 US dollars
Depreciation and amortization
28,100,000 US dollars
Technology support services
26,200,000 US dollars
Professional fees and outside services
22,400,000 US dollars
Travel and promotional expenses
13,200,000 US dollars
Facilities costs
6,100,000 US dollars
Acquisition-related costs
0 US dollars
Other expenses
4,900,000 US dollars
Impairment of assets
0 US dollars

Chart connections

  • Revenue less cost of revenue equals gross profit; gross profit less operating expenses equals operating income.
  • Operating income plus other income or expense equals income before tax. Income before tax less income tax expense or benefit equals net income.
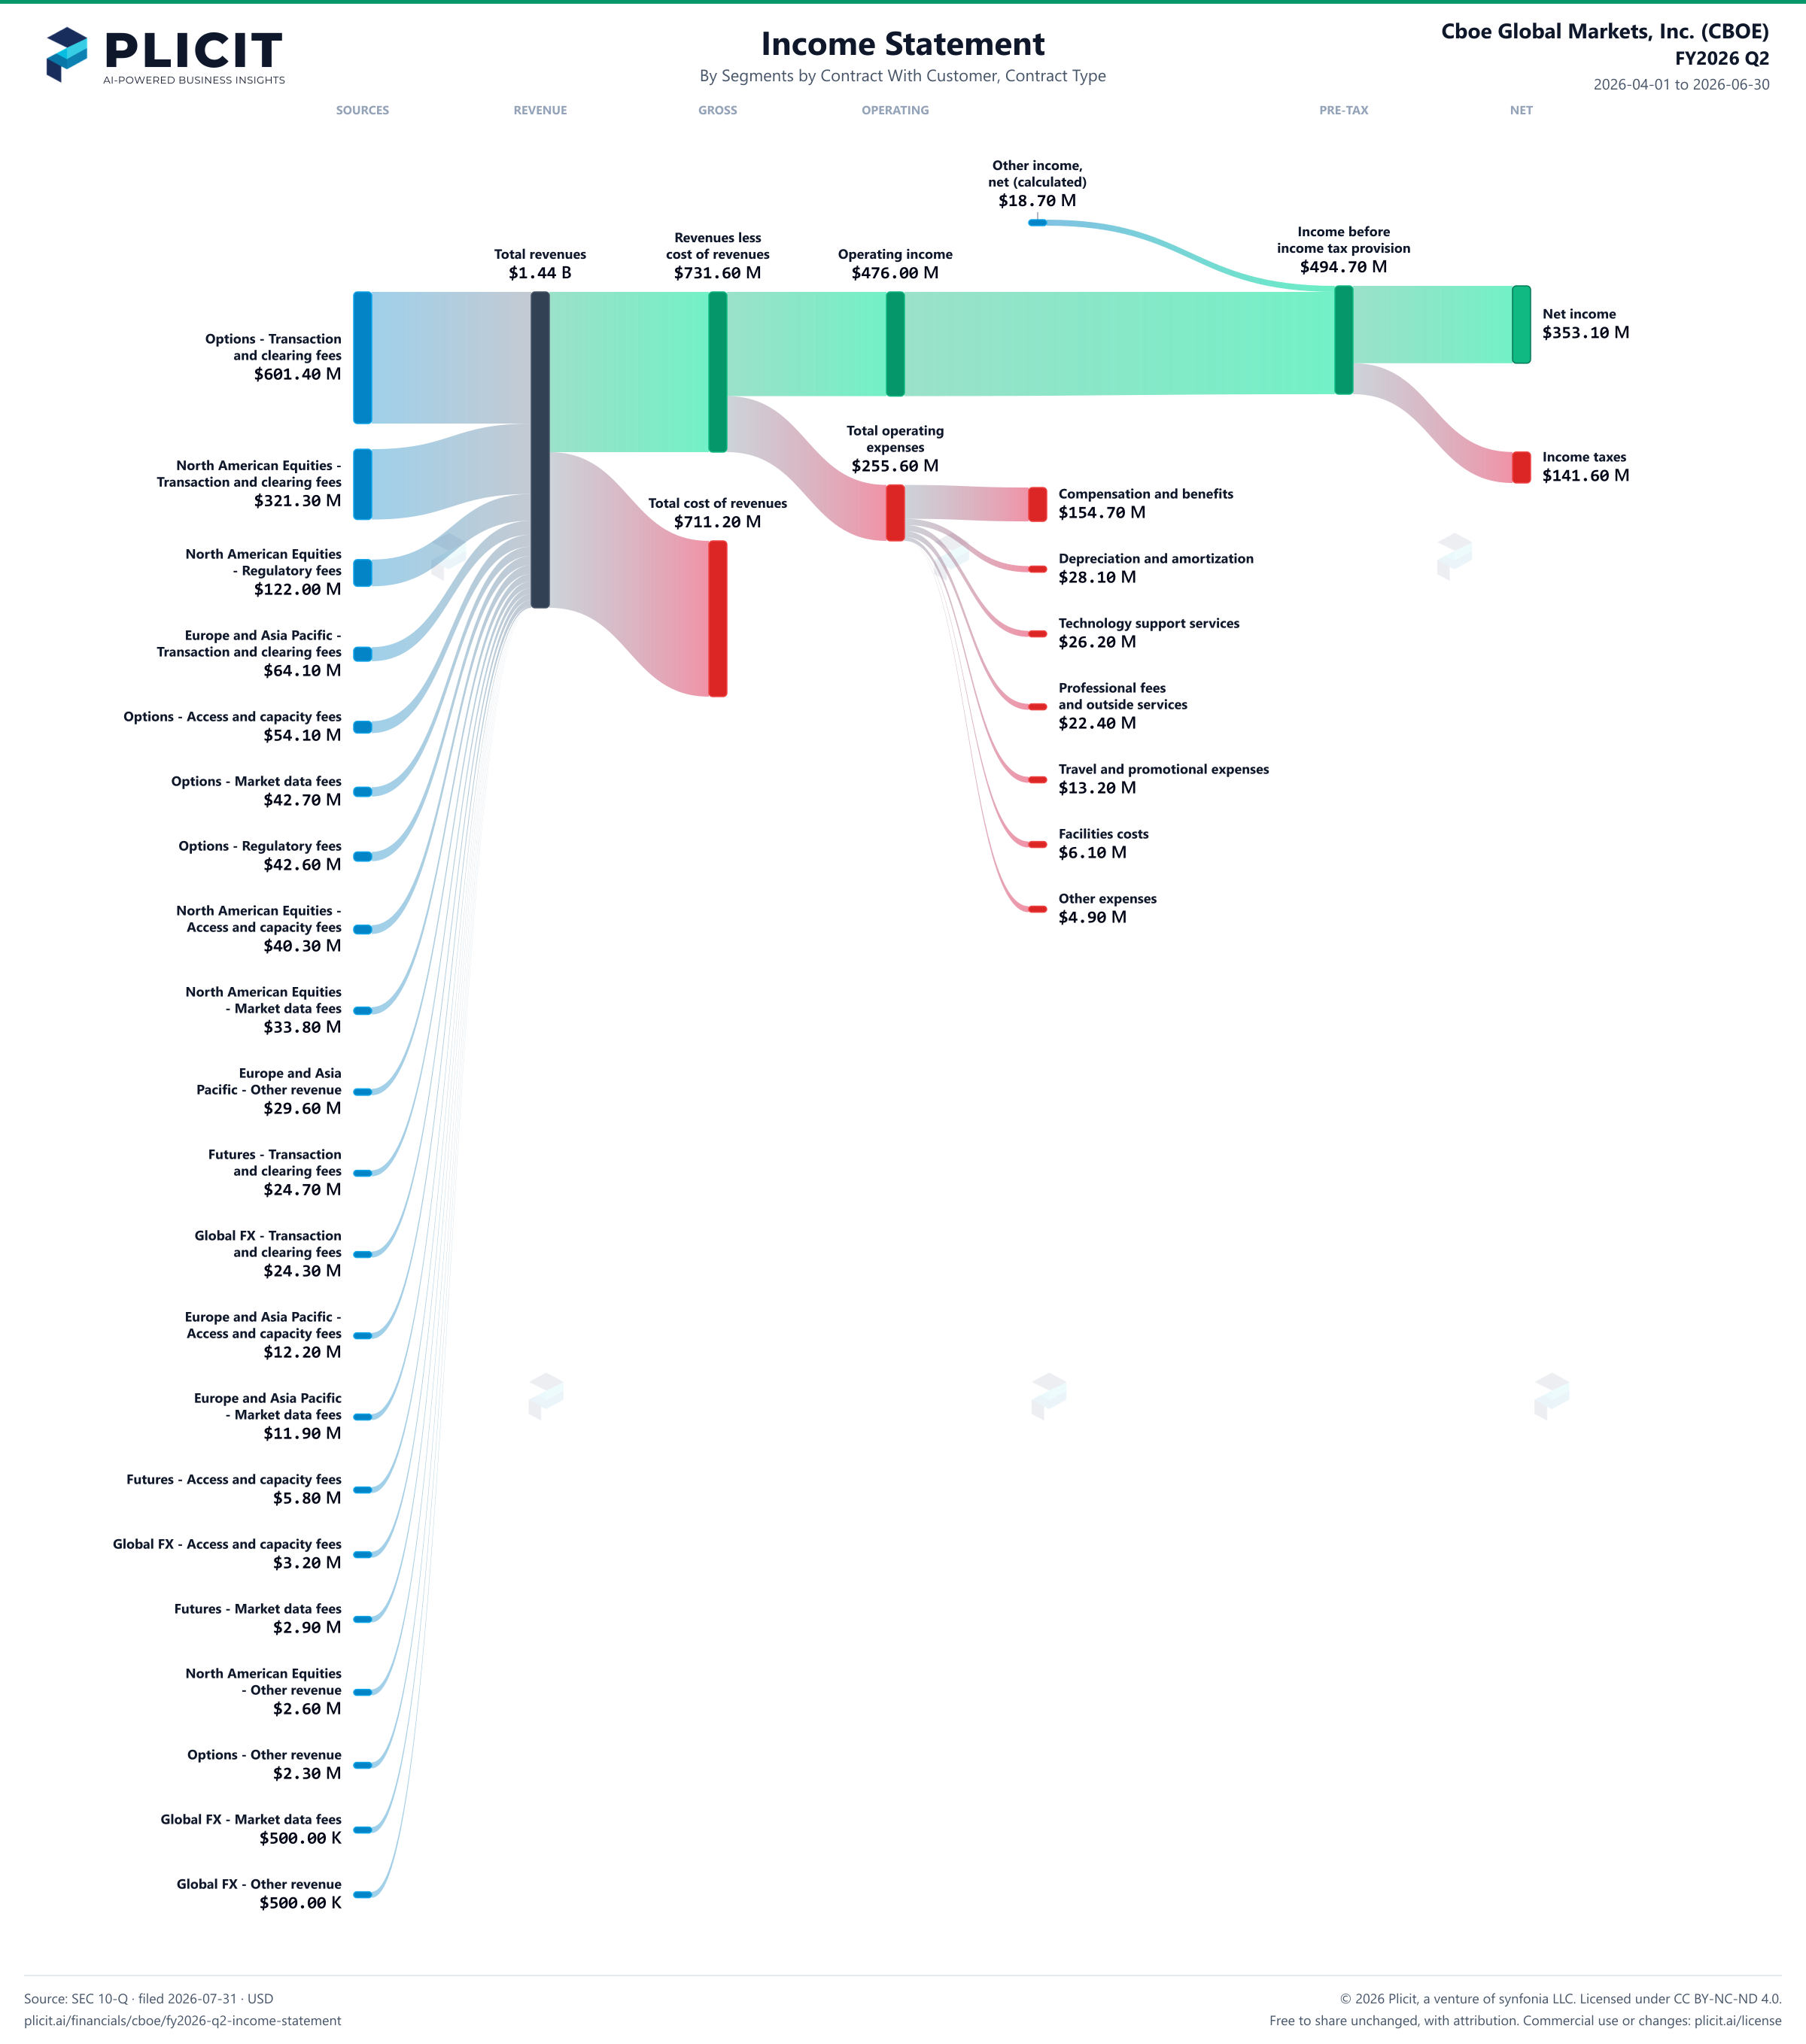
Cboe Global Markets, Inc. (CBOE) FY2026 Q2 Revenue by Business Segment by Contract Type Sankey chart
Free to share unchanged, with credit to Plicit.ai · CC BY-NC-ND 4.0Download PNG

Gross margin

50.7%

Gross profit / revenue

Operating margin

33.0%

Operating profit / revenue

Cash conversion

−142.5%

Operating cash / net income, same period

Newsletter

Get the teardowns by email

Subscribe if you want the public-company teardowns in your inbox when they're released.

Product waitlist

Health Check and Teardown for your own company

A health check uncovers insights of your private books, not a public ticker. Join this list to get notified as soon as we go-live!