
Carnival Corporation (CCL) FY2024 Annual Balance Sheet
As of 2024-11-30
Balance Sheet
As of 2024-11-30
Swipe to see the full flow
Chart details
Carnival Corporation (CCL) FY2024 Annual Balance Sheet
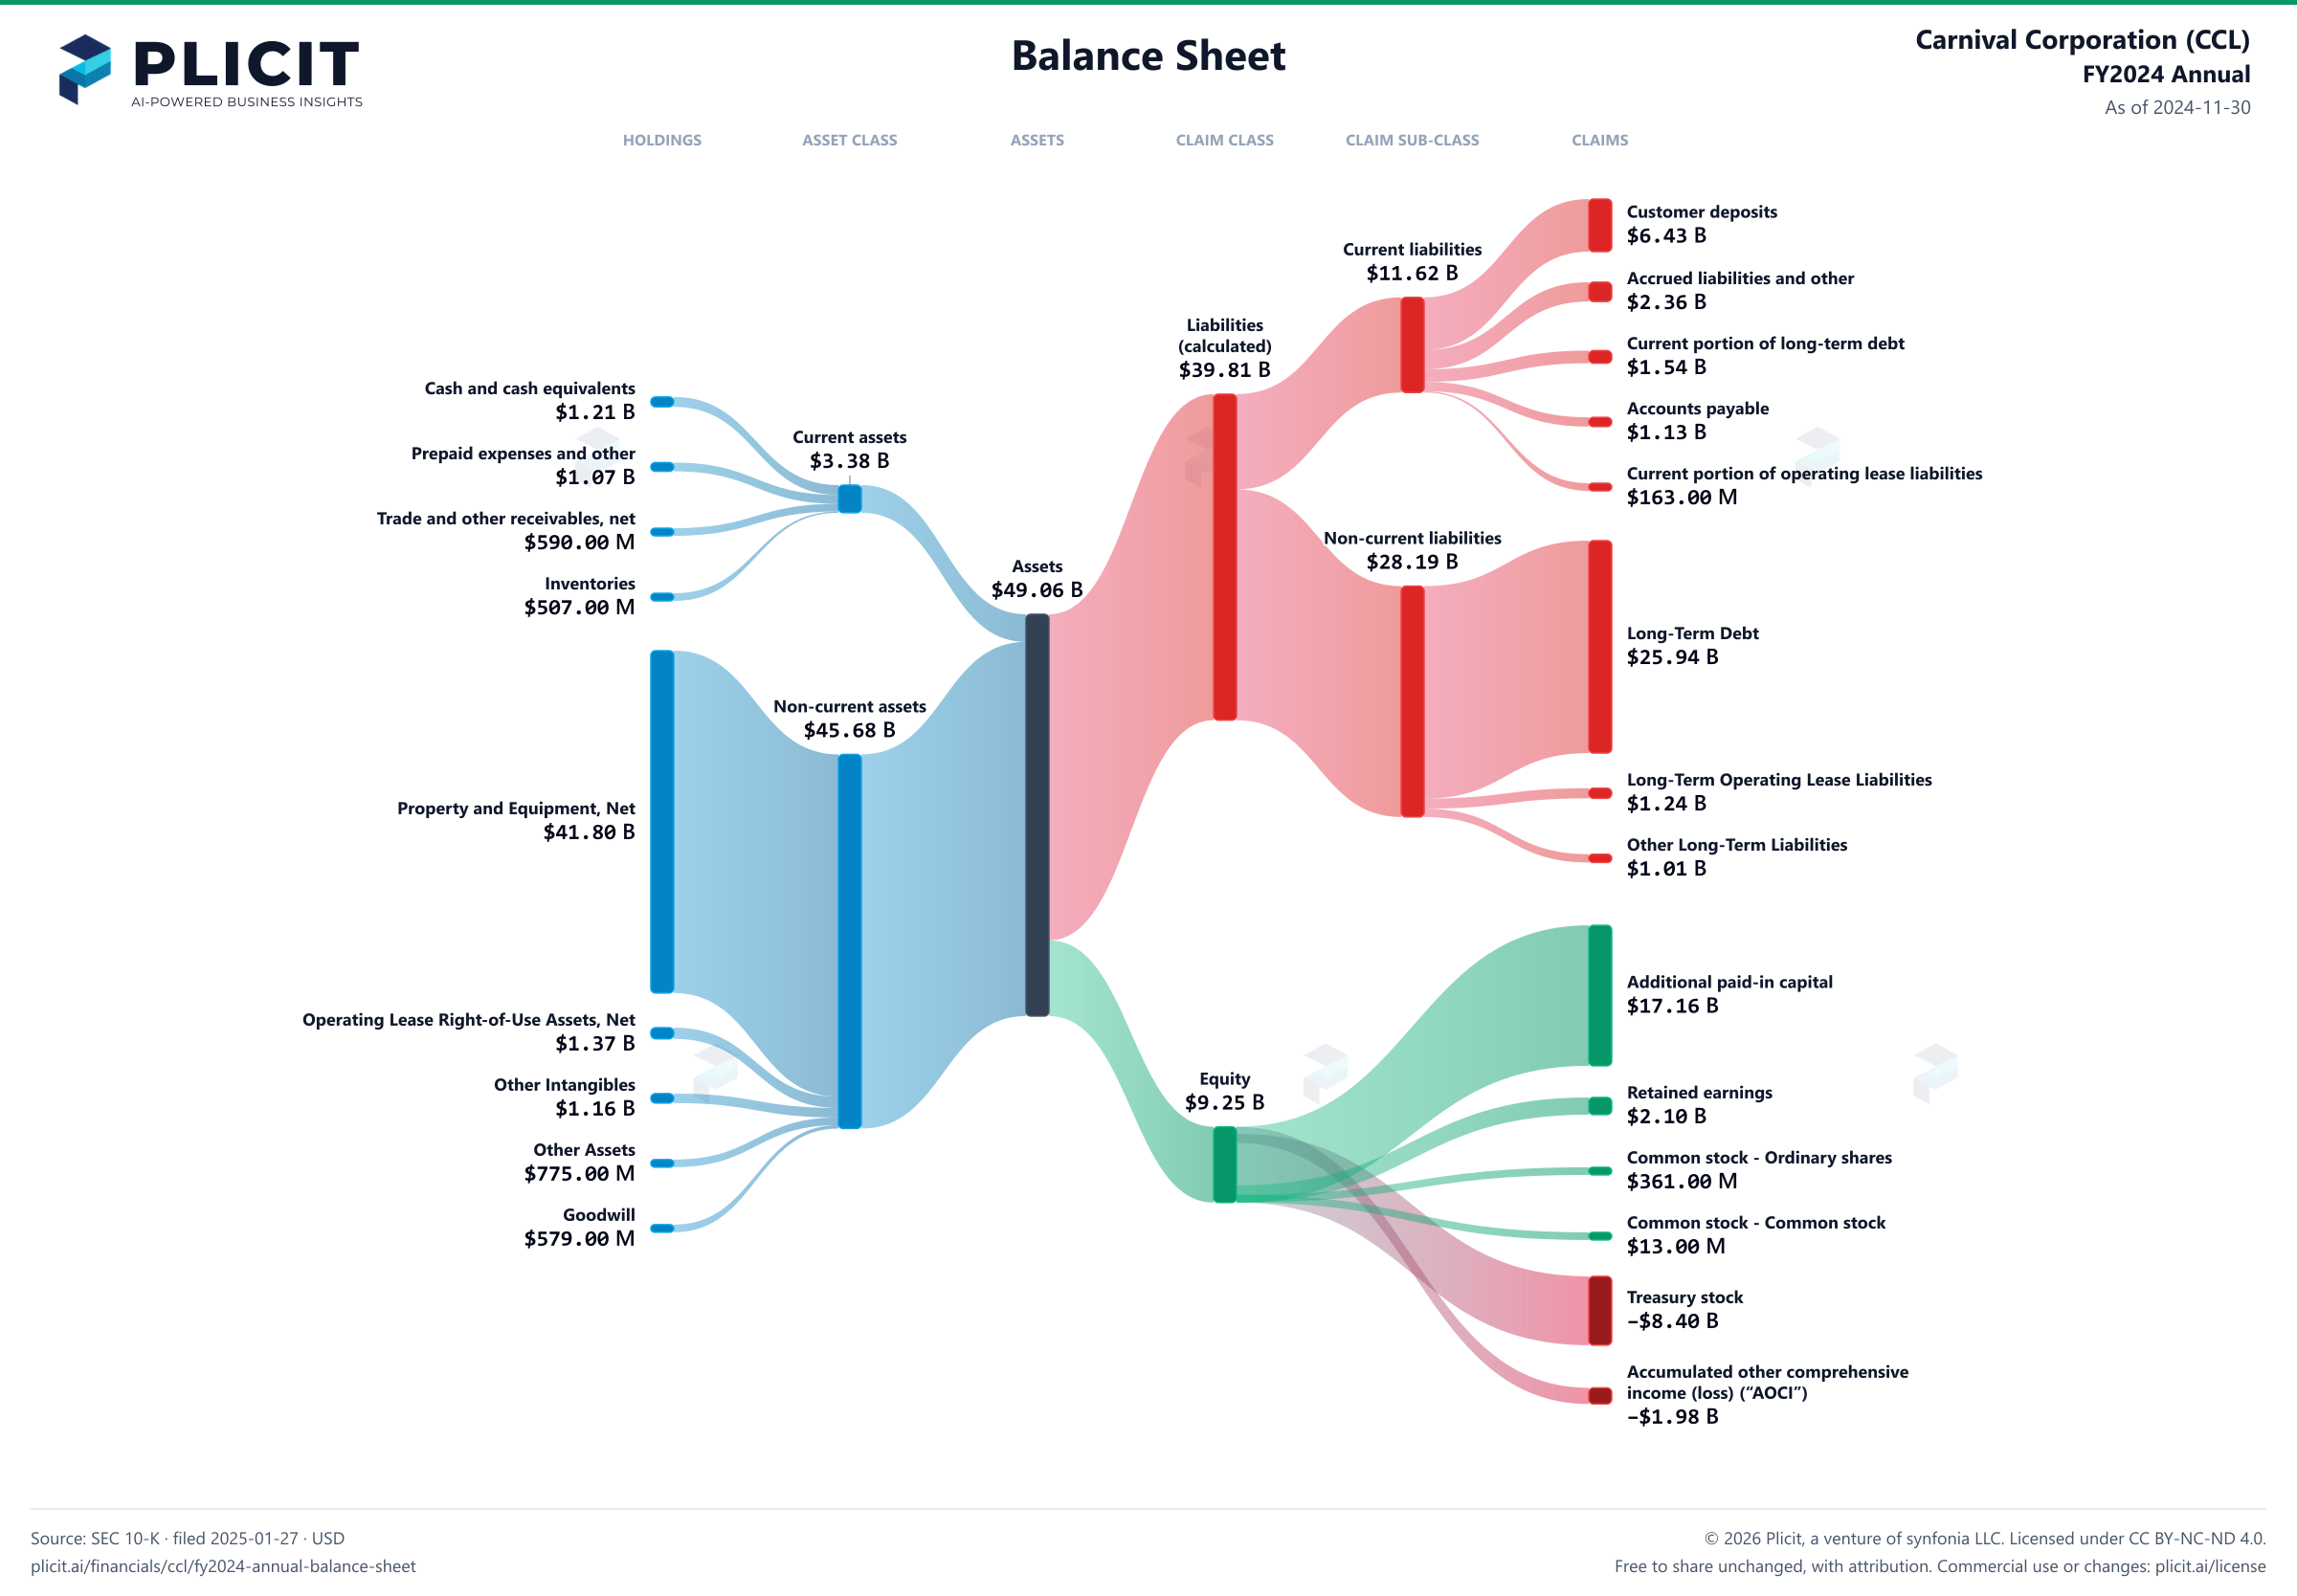
Balance sheet as of 2024-11-30. The chart shows assets, liabilities and equity at that date.
- Assets
- 49,057,000,000 US dollars
- Current assets
- 3,378,000,000 US dollars
- Non-current assets
- 45,679,000,000 US dollars
- Liabilities (calculated)
- 39,806,000,000 US dollars
- Current liabilities
- 11,617,000,000 US dollars
- Non-current liabilities
- 28,189,000,000 US dollars
- Equity
- 9,251,000,000 US dollars
- Cash and cash equivalents
- 1,210,000,000 US dollars
- Prepaid expenses and other
- 1,070,000,000 US dollars
- Trade and other receivables, net
- 590,000,000 US dollars
- Inventories
- 507,000,000 US dollars
- Property and Equipment, Net
- 41,795,000,000 US dollars
- Operating Lease Right-of-Use Assets, Net
- 1,368,000,000 US dollars
- Other Intangibles
- 1,163,000,000 US dollars
- Other Assets
- 775,000,000 US dollars
- Goodwill
- 579,000,000 US dollars
- Customer deposits
- 6,425,000,000 US dollars
- Accrued liabilities and other
- 2,358,000,000 US dollars
- Current portion of long-term debt
- 1,538,000,000 US dollars
- Accounts payable
- 1,133,000,000 US dollars
- Current portion of operating lease liabilities
- 163,000,000 US dollars
- Long-Term Debt
- 25,936,000,000 US dollars
- Long-Term Operating Lease Liabilities
- 1,239,000,000 US dollars
- Other Long-Term Liabilities
- 1,012,000,000 US dollars
- Additional paid-in capital
- 17,155,000,000 US dollars
- Retained earnings
- 2,101,000,000 US dollars
- Common stock - Ordinary shares
- 361,000,000 US dollars
- Common stock - Common stock
- 13,000,000 US dollars
- Treasury stock, 130 shares at 2024 and 2023 of Carnival Corporation and 73 shares at 2024 and 2023 of Carnival plc, at cost
- negative 8,404,000,000 US dollars
- Accumulated other comprehensive income (loss) (“AOCI”)
- negative 1,975,000,000 US dollars
Chart connections
- Assets equal liabilities plus consolidated equity. Consolidated equity includes noncontrolling interests when reported.
- Treasury shares and other negative equity contributions reduce equity.
- The filed current assets lines add up to $3,377.00 M and the current assets total is $3,378.00 M; the $1.00 M difference is within the rounding of the filed amounts.
- The filed non-current assets lines add up to $45,680.00 M and the non-current assets total is $45,679.00 M; the $1.00 M difference is within the rounding of the filed amounts.
- The filed non-current liabilities lines add up to $28,187.00 M and the non-current liabilities total is $28,189.00 M; the $2.00 M difference is within the rounding of the filed amounts.
Free to share unchanged, with credit to Plicit.ai · CC BY-NC-ND 4.0Download PNG
Product waitlist
Health Check and Teardown for your own company
A health check uncovers insights of your private books, not a public ticker. Join this list to get notified as soon as we go-live!