
Carnival Corporation (CCL) FY2026 Q1 Balance Sheet
As of 2026-02-28
Balance Sheet
As of 2026-02-28
Swipe to see the full flow
Chart details
Carnival Corporation (CCL) FY2026 Q1 Balance Sheet
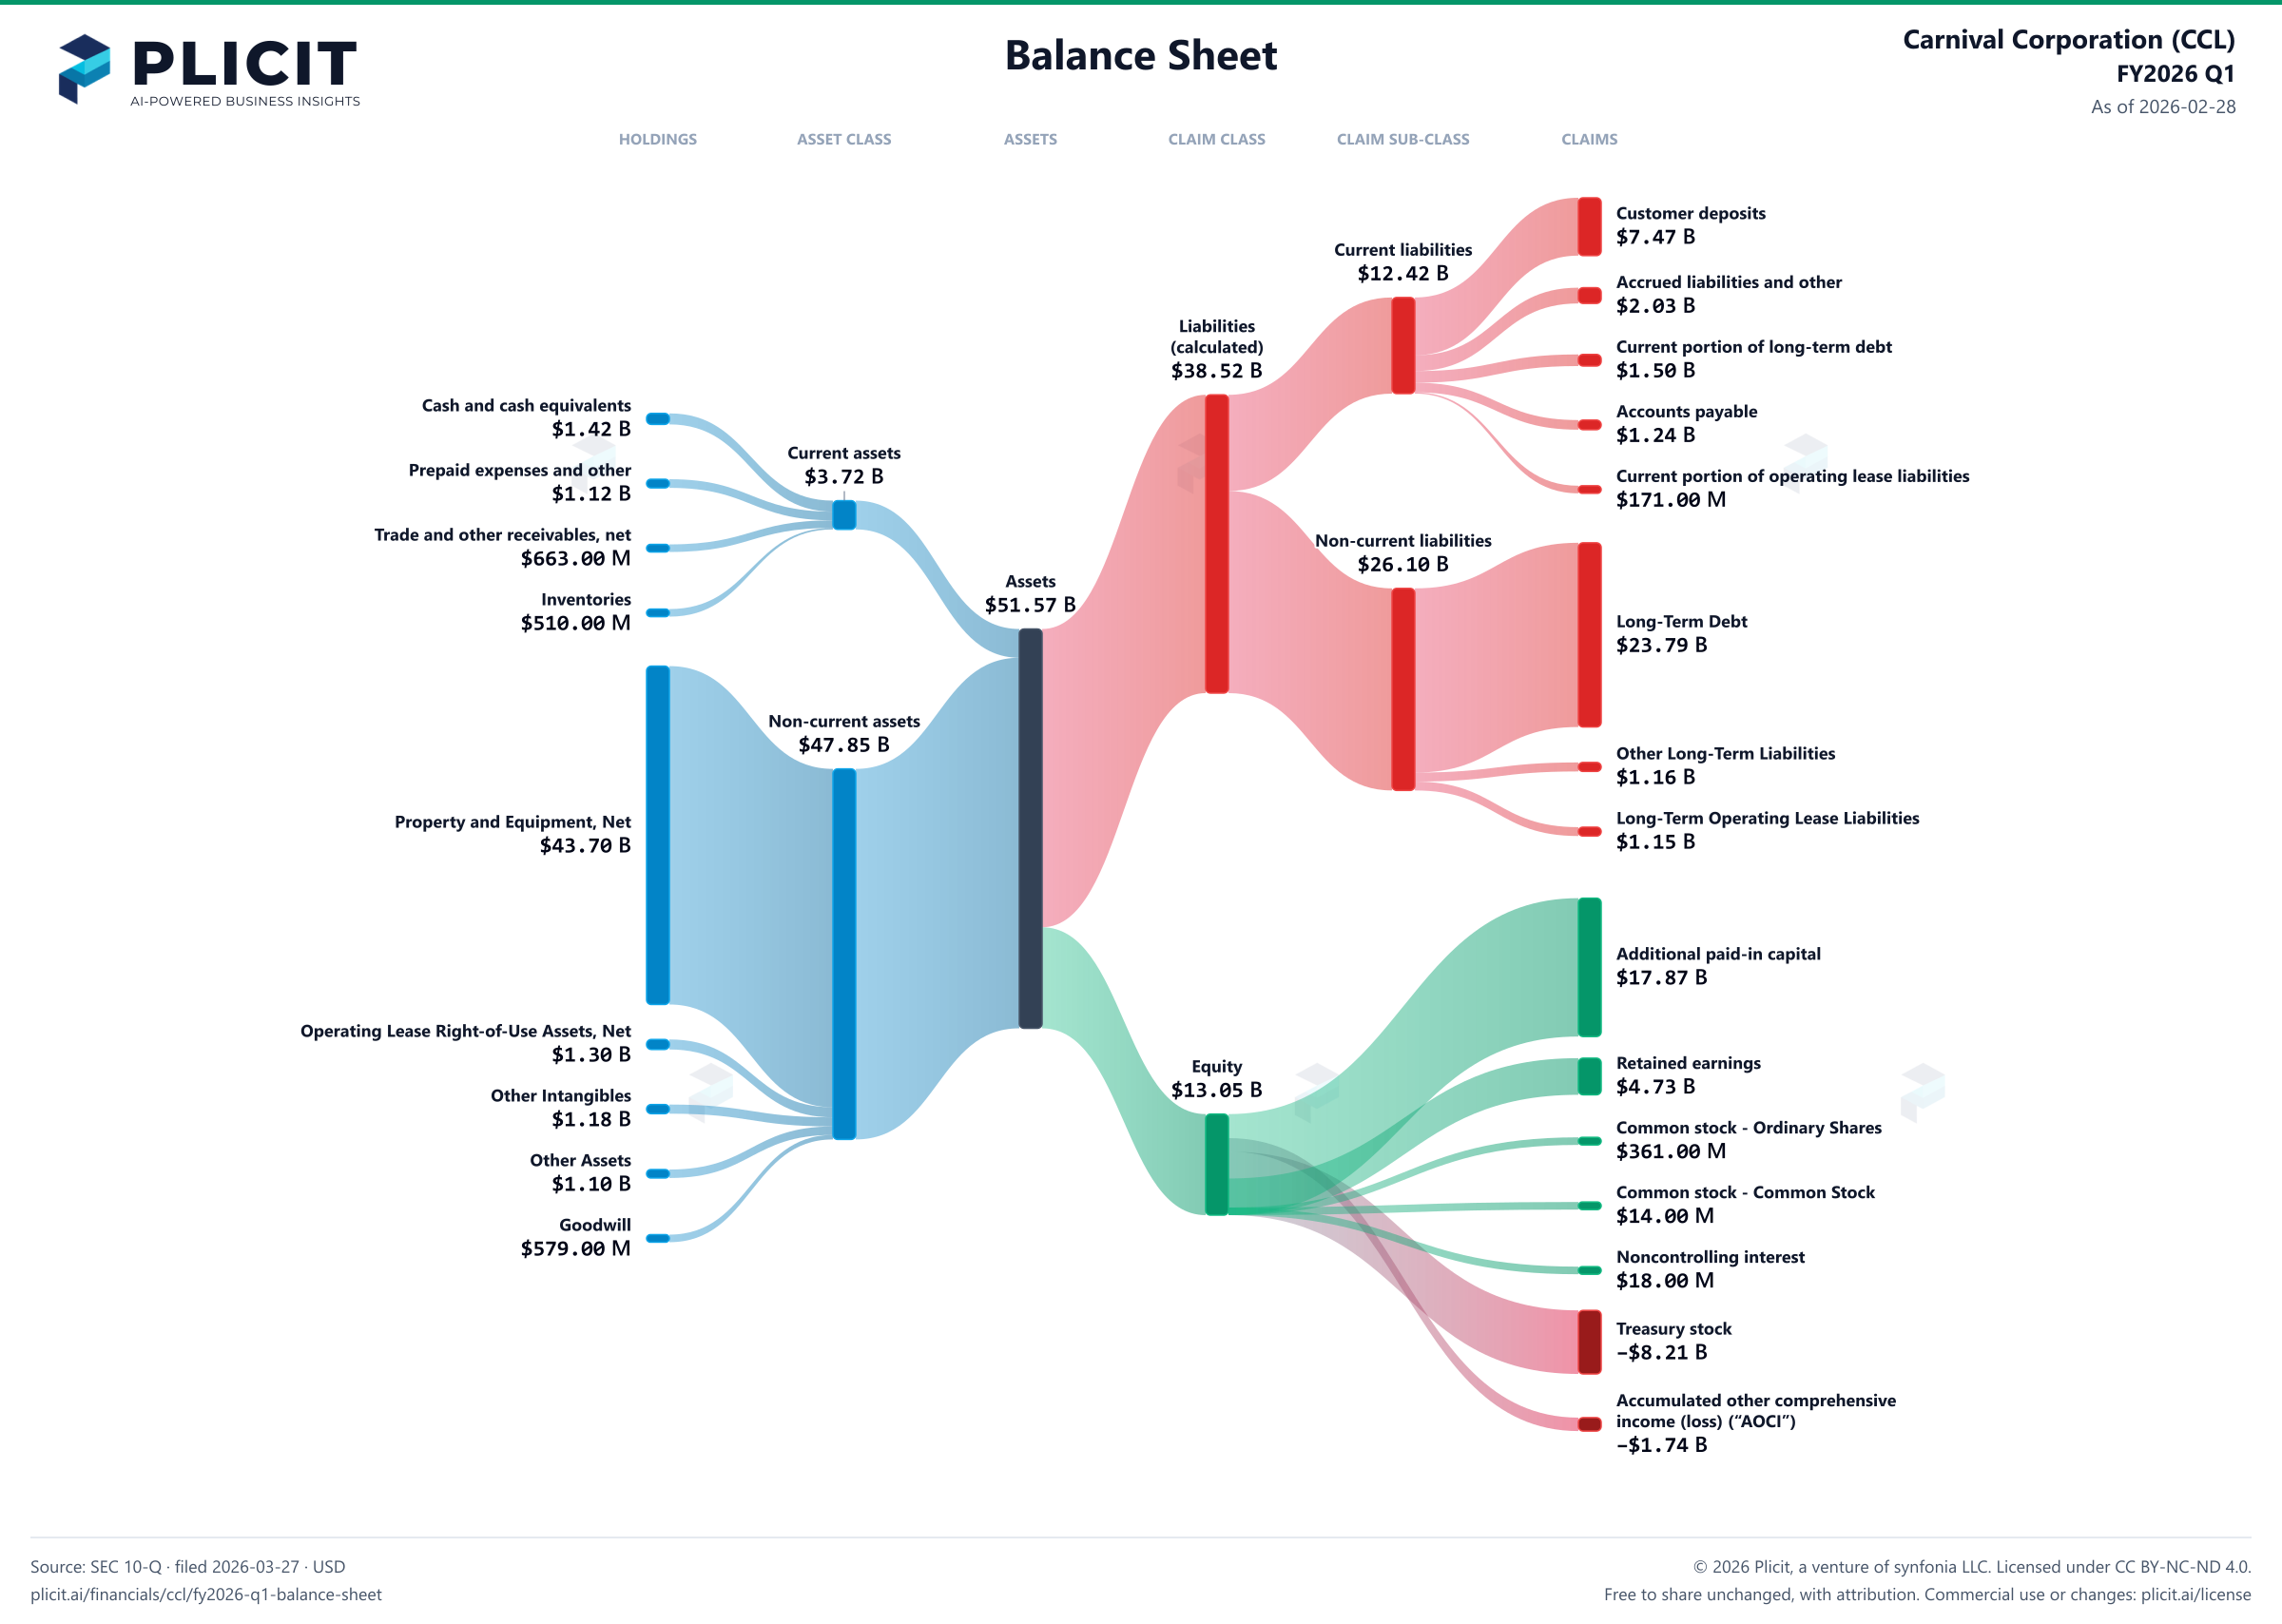
Balance sheet as of 2026-02-28. The chart shows assets, liabilities and equity at that date.
- Assets
- 51,567,000,000 US dollars
- Current assets
- 3,716,000,000 US dollars
- Non-current assets
- 47,851,000,000 US dollars
- Liabilities (calculated)
- 38,518,000,000 US dollars
- Current liabilities
- 12,420,000,000 US dollars
- Non-current liabilities
- 26,098,000,000 US dollars
- Equity
- 13,049,000,000 US dollars
- Noncontrolling interest
- 18,000,000 US dollars. Included in consolidated equity; this amount is not added again.
- Cash and cash equivalents
- 1,424,000,000 US dollars
- Prepaid expenses and other
- 1,120,000,000 US dollars
- Trade and other receivables, net
- 663,000,000 US dollars
- Inventories
- 510,000,000 US dollars
- Property and Equipment, Net
- 43,700,000,000 US dollars
- Operating Lease Right-of-Use Assets, Net
- 1,295,000,000 US dollars
- Other Intangibles
- 1,181,000,000 US dollars
- Other Assets
- 1,095,000,000 US dollars
- Goodwill
- 579,000,000 US dollars
- Customer deposits
- 7,472,000,000 US dollars
- Accrued liabilities and other
- 2,034,000,000 US dollars
- Current portion of long-term debt
- 1,502,000,000 US dollars
- Accounts payable
- 1,242,000,000 US dollars
- Current portion of operating lease liabilities
- 171,000,000 US dollars
- Long-Term Debt
- 23,788,000,000 US dollars
- Other Long-Term Liabilities
- 1,164,000,000 US dollars
- Long-Term Operating Lease Liabilities
- 1,146,000,000 US dollars
- Additional paid-in capital
- 17,871,000,000 US dollars
- Retained earnings
- 4,733,000,000 US dollars
- Common stock - Ordinary Shares
- 361,000,000 US dollars
- Common stock - Common Stock
- 14,000,000 US dollars
- Noncontrolling interest
- 18,000,000 US dollars
- Treasury stock, 128 shares at 2026 and 131 shares at 2025 of Carnival Corporation and 71 shares at 2026 and 72 shares at 2025 of Carnival plc, at cost
- negative 8,210,000,000 US dollars
- Accumulated other comprehensive income (loss) (“AOCI”)
- negative 1,738,000,000 US dollars
Chart connections
- Assets equal liabilities plus consolidated equity. Consolidated equity includes noncontrolling interests when reported.
- Treasury shares and other negative equity contributions reduce equity.
- The filed current assets lines add up to $3,717.00 M and the current assets total is $3,716.00 M; the $1.00 M difference is within the rounding of the filed amounts.
- The filed non-current assets lines add up to $47,850.00 M and the non-current assets total is $47,851.00 M; the $1.00 M difference is within the rounding of the filed amounts.
- The filed current liabilities lines add up to $12,421.00 M and the current liabilities total is $12,420.00 M; the $1.00 M difference is within the rounding of the filed amounts.
Free to share unchanged, with credit to Plicit.ai · CC BY-NC-ND 4.0Download PNG
Product waitlist
Health Check and Teardown for your own company
A health check uncovers insights of your private books, not a public ticker. Join this list to get notified as soon as we go-live!