
Carnival Corporation (CCL) FY2024 Annual P&L / Income Statement
2023-12-01 to 2024-11-30
Revenue by Geography
2023-12-01 to 2024-11-30
Swipe to see the full flow
Chart details
Carnival Corporation (CCL) FY2024 Annual P&L / Income Statement
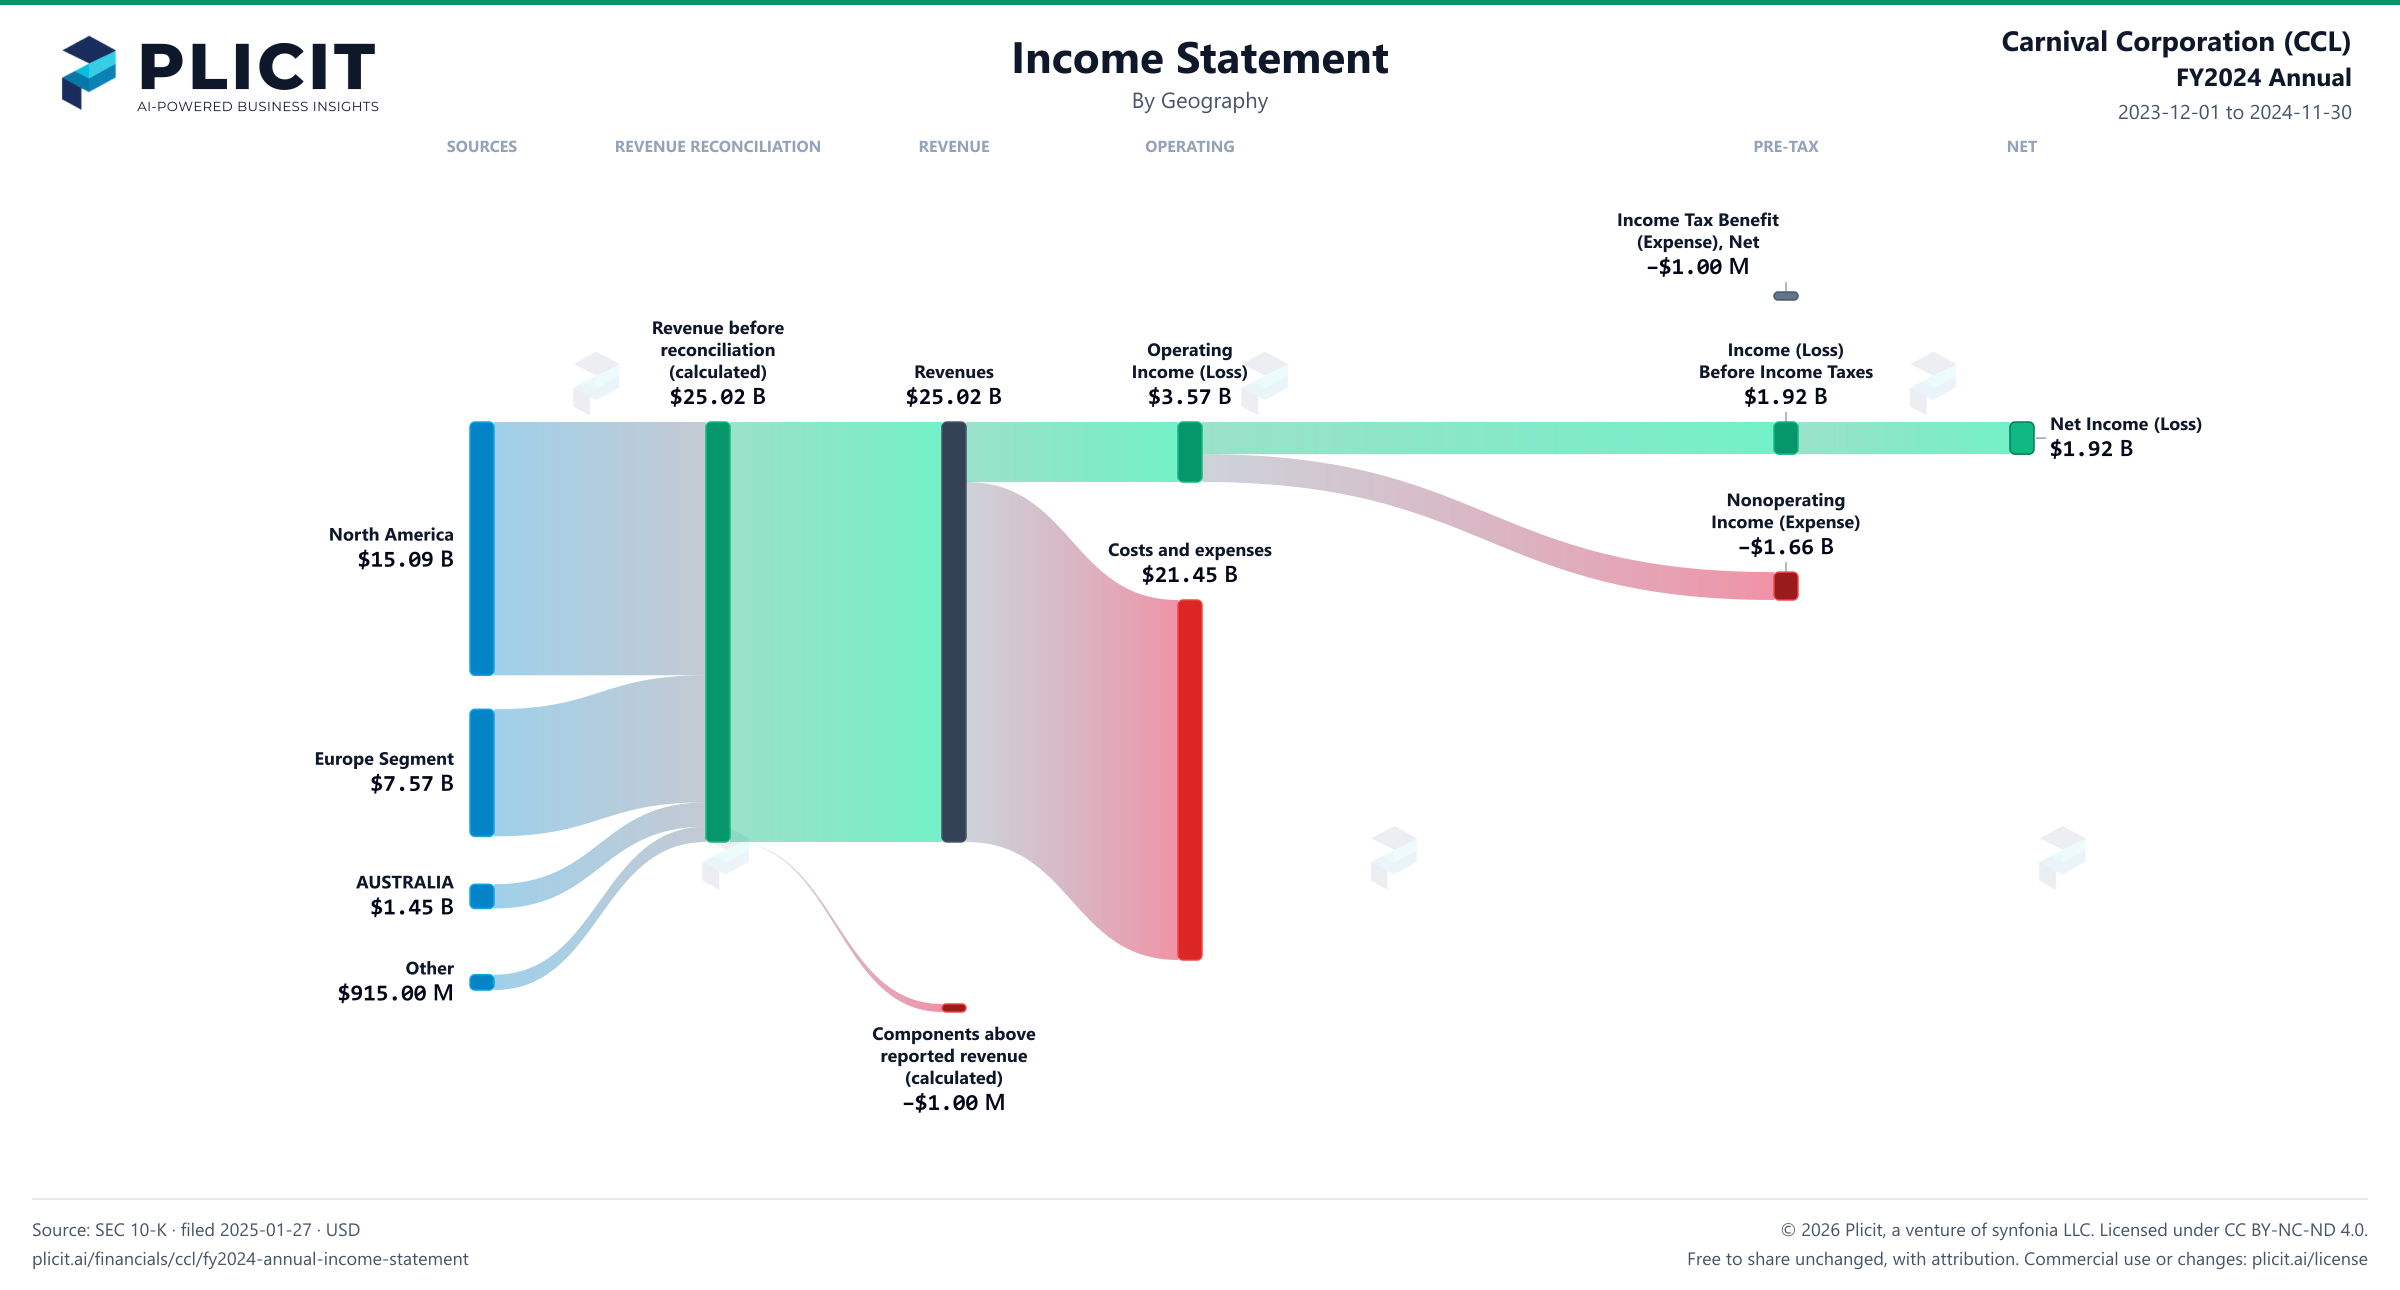
Income statement for 2023-12-01 through 2024-11-30. View: Geography. Revenue uses this breakdown; costs and expenses retain the consolidated categories.
- Revenues
- 25,021,000,000 US dollars
- Costs and expenses
- 21,447,000,000 US dollars
- Operating Income (Loss)
- 3,574,000,000 US dollars
- Nonoperating Income (Expense)
- negative 1,659,000,000 US dollars
- Income (Loss) Before Income Taxes
- 1,915,000,000 US dollars
- Income Tax Benefit (Expense), Net
- negative 1,000,000 US dollars
- Net Income (Loss)
- 1,916,000,000 US dollars
- North America
- 15,089,000,000 US dollars
- Europe Segment
- 7,573,000,000 US dollars
- AUSTRALIA
- 1,445,000,000 US dollars
- Other
- 915,000,000 US dollars
- Selling and administrative
- 3,252,000,000 US dollars. Source detail retained; this breakdown has not reconciled exactly and is not drawn.
- Depreciation and amortization
- 2,557,000,000 US dollars. Source detail retained; this breakdown has not reconciled exactly and is not drawn.
- Onboard and other
- 2,678,000,000 US dollars. Source detail retained; this breakdown has not reconciled exactly and is not drawn.
- Payroll and related
- 2,464,000,000 US dollars. Source detail retained; this breakdown has not reconciled exactly and is not drawn.
- Other operating
- 3,801,000,000 US dollars. Source detail retained; this breakdown has not reconciled exactly and is not drawn.
- Ship and other impairments
- 0 US dollars. Source detail retained; this breakdown has not reconciled exactly and is not drawn.
- Commissions, transportation and other
- 3,232,000,000 US dollars. Source detail retained; this breakdown has not reconciled exactly and is not drawn.
- Food
- 1,457,000,000 US dollars. Source detail retained; this breakdown has not reconciled exactly and is not drawn.
- Fuel
- 2,007,000,000 US dollars. Source detail retained; this breakdown has not reconciled exactly and is not drawn.
- Revenue before reconciliation (calculated)
- 25,022,000,000 US dollars. Sum of the reported revenue categories before the separately reported reconciliation.
- Components above reported revenue (calculated)
- negative 1,000,000 US dollars. The disclosed components add up to more than reported revenue; this is the difference, calculated, not a reported item.
Chart connections
- Revenue minus operating expenses equals operating income.
- Operating income plus other income or expense equals income before tax. Income before tax less income tax expense or benefit equals net income.
- Reported revenue categories plus the separately reported signed reconciliation equals consolidated revenue.
Free to share unchanged, with credit to Plicit.ai · CC BY-NC-ND 4.0Download PNG
Operating margin
14.3%
Operating profit / revenue
Cash conversion
309.1%
Operating cash / net income, same period
Product waitlist
Health Check and Teardown for your own company
A health check uncovers insights of your private books, not a public ticker. Join this list to get notified as soon as we go-live!