
CUMMINS INC. (CMI) FY2026 Q2 P&L / Income Statement

Revenue by Business Segment by Product and Service

2026-04-01 to 2026-06-30

Swipe to see the full flow
CUMMINS INC. (CMI) FY2026 Q2 P&L / Income StatementIncome statement for 2026-04-01 through 2026-06-30. View: Segments by Product and Service. Revenue uses this breakdown; costs and expenses retain the consolidated categories.SOURCESREVENUE RECONCILIATIONREVENUEGROSSOPERATINGPRE-TAXNETDistribution - Power generationComponents - Drivetrain and braking systemsDistribution - PartsComponents - Emission solutionsEngine - Medium-duty truck and busPower Systems - Power generationEngine - Heavy-duty truckEngine - Light-duty automotiveDistribution - ServiceDistribution - EnginesEngine - Off-highwayComponents - Components and softwarePower Systems - IndustrialPower Systems - Generator technologiesAcceleraComponents - Automated transmissionsNET SALES (Notes 1 and 2)Revenue before reconciliation (calculated)Components above reported revenue (calculated)GROSS MARGINCost of salesOPERATING INCOMEOperating costs, net of other operating items (calculated)Selling, general and administrative expensesResearch, development and engineering expensesEquity, royalty and interest income from investees (Note 4)Other operating expense, net (Note 14)Other income (expense), net (calculated)INCOME BEFORE INCOME TAXESCONSOLIDATED NET INCOMEIncome tax expense (Note 5)Other income (expense), net (calculated)Other income,net (calculated)$14.00 MRevenue before reconciliation (calculated)Revenue beforereconciliation(calculated)$9.46 BINCOME BEFORE INCOME TAXESINCOME BEFOREINCOME TAXES$1.29 BNET SALES (Notes 1 and 2)NET SALES(Notes 1 and 2)$9.46 BGROSS MARGINGROSS MARGIN$2.47 BOPERATING INCOMEOPERATING INCOME$1.28 BCONSOLIDATED NET INCOMECONSOLIDATEDNET INCOME$968.00 MDistribution - Power generationDistribution - Power generation$1.38 BOperating costs, net of other operating items (calculated)Operating costs,net (calculated)$1.19 BComponents - Drivetrain and braking systemsComponents - Drivetrainand braking systems$1.12 BIncome tax expense (Note 5)Income taxexpense (Note 5)$325.00 MCost of salesCost of sales$6.99 BSelling, general and administrative expensesSelling, general andadministrative expenses$893.00 MDistribution - PartsDistribution - Parts$1.08 BResearch, development and engineering expensesResearch, developmentand engineering expenses$385.00 MComponents - Emission solutionsComponents - Emission solutions$853.00 MEquity, royalty and interest income from investees (Note 4)Equity, royalty and interestincome from investees (Note 4)−$154.00 MEngine - Medium-duty truck and busEngine - Medium-duty truck and bus$772.00 MPower Systems - Power generationPower Systems - Power generation$744.00 MOther operating expense, net (Note 14)Other operatingexpense, net (Note 14)$62.00 MEngine - Heavy-duty truckEngine - Heavy-duty truck$739.00 MComponents above reported revenue (calculated)Components abovereported revenue(calculated)−$5.00 MEngine - Light-duty automotiveEngine - Light-duty automotive$490.00 MDistribution - ServiceDistribution - Service$470.00 MDistribution - EnginesDistribution - Engines$395.00 MEngine - Off-highwayEngine - Off-highway$348.00 MComponents - Components and softwareComponents -Components and software$335.00 MPower Systems - IndustrialPower Systems - Industrial$298.00 MPower Systems - Generator technologiesPower Systems -Generator technologies$175.00 MAcceleraAccelera$145.00 MComponents - Automated transmissionsComponents - Automatedtransmissions$124.00 M
Chart details

CUMMINS INC. (CMI) FY2026 Q2 P&L / Income Statement

Income statement for 2026-04-01 through 2026-06-30. View: Segments by Product and Service. Revenue uses this breakdown; costs and expenses retain the consolidated categories.

NET SALES (Notes 1 and 2)
9,457,000,000 US dollars
Cost of sales
6,992,000,000 US dollars
GROSS MARGIN
2,465,000,000 US dollars
Operating costs, net of other operating items (calculated)
1,186,000,000 US dollars
OPERATING INCOME
1,279,000,000 US dollars
Other income (expense), net (calculated)
14,000,000 US dollars
INCOME BEFORE INCOME TAXES
1,293,000,000 US dollars
Income tax expense (Note 5)
325,000,000 US dollars
CONSOLIDATED NET INCOME
968,000,000 US dollars
Accelera
145,000,000 US dollars
Components - Automated transmissions
124,000,000 US dollars
Components - Components and software
335,000,000 US dollars
Components - Drivetrain and braking systems
1,119,000,000 US dollars
Components - Emission solutions
853,000,000 US dollars
Distribution - Power generation
1,377,000,000 US dollars
Distribution - Engines
395,000,000 US dollars
Distribution - Parts
1,078,000,000 US dollars
Distribution - Service
470,000,000 US dollars
Engine - Heavy-duty truck
739,000,000 US dollars
Engine - Light-duty automotive
490,000,000 US dollars
Engine - Medium-duty truck and bus
772,000,000 US dollars
Engine - Off-highway
348,000,000 US dollars
Power Systems - Generator technologies
175,000,000 US dollars
Power Systems - Industrial
298,000,000 US dollars
Power Systems - Power generation
744,000,000 US dollars
Selling, general and administrative expenses
893,000,000 US dollars
Research, development and engineering expenses
385,000,000 US dollars
Equity, royalty and interest income from investees (Note 4)
negative 154,000,000 US dollars
Other operating expense, net (Note 14)
62,000,000 US dollars
Revenue before reconciliation (calculated)
9,462,000,000 US dollars. Sum of the reported revenue categories before the separately reported reconciliation.
Components above reported revenue (calculated)
negative 5,000,000 US dollars. The disclosed components add up to more than reported revenue; this is the difference, calculated, not a reported item.

Chart connections

  • Revenue less cost of revenue equals gross profit; gross profit less operating expenses equals operating income.
  • Operating income plus other income or expense equals income before tax. Income before tax less income tax expense or benefit equals net income.
  • Reported revenue categories plus the separately reported signed reconciliation equals consolidated revenue.
  • Of which attributable to CUMMINS INC.: $932.00 M; to noncontrolling interests: $36.00 M.
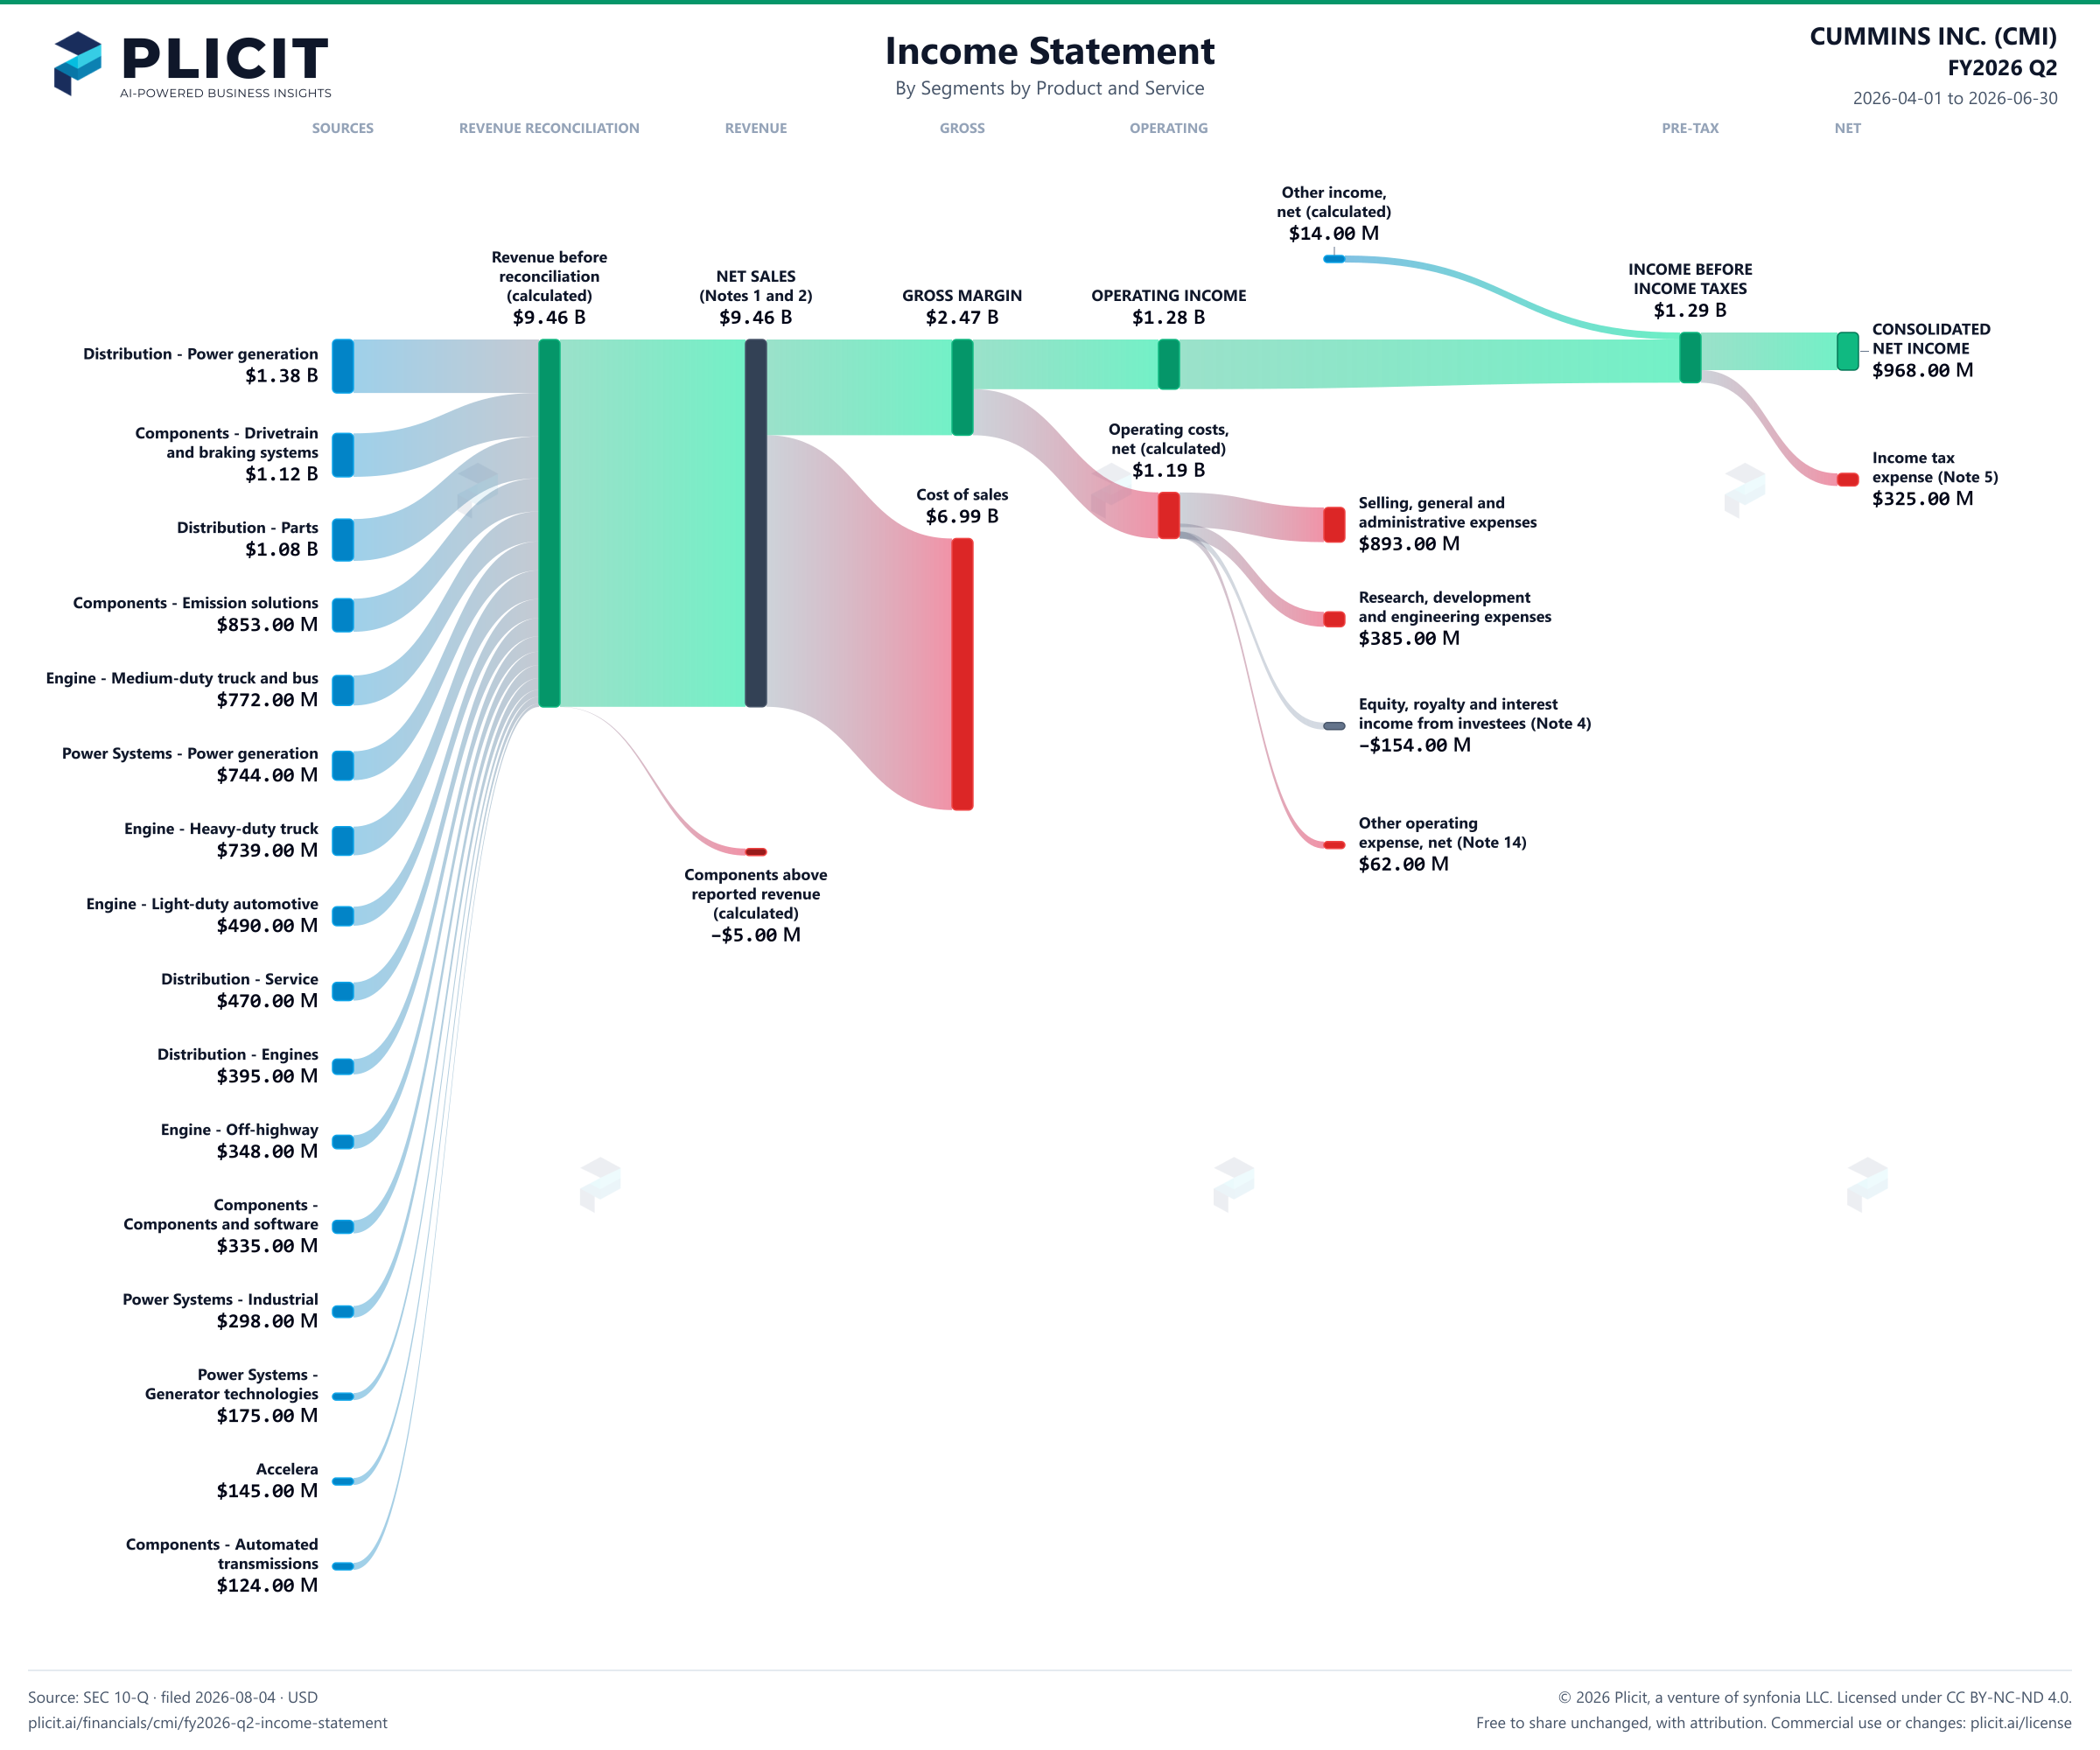
CUMMINS INC. (CMI) FY2026 Q2 P&L / Income Statement Sankey chart, Segments by Product and Service view
Free to share unchanged, with credit to Plicit.ai · CC BY-NC-ND 4.0Download PNG

Gross margin

26.1%

Gross profit / revenue

Operating margin

13.5%

Operating profit / revenue

Cash conversion

154.9%

Operating cash / net income, same period

Newsletter

Get the teardowns by email

Subscribe if you want the public-company teardowns in your inbox when they're released.

Product waitlist

Health Check and Teardown for your own company

A health check uncovers insights of your private books, not a public ticker. Join this list to get notified as soon as we go-live!