CENTENE CORPORATION (CNC) FY2026 Q3 Statement of Cash Flows

Published · Updated Source: Form 10-Q on SEC EDGAR filed (opens in a new tab)

Key Takeaways

  • Operating cash was negative $3.67 B in the quarter, while Centene lost $65.00 M.
  • Pass-through balances fell about $2.87 B, roughly 78% of the quarter's outflow.
  • Capital spending of $194.00 M ran 1.4 times depreciation of $138.00 M this quarter.
  • Nine months of operating cash still total $4.29 B after the quarter's drain.

The Unvarnished Truth

State money passing through explains most of Centene's $3.67 B burn

Centene's operating cash flow came in at minus $3.67 B in the third quarter, a stretch in which it also lost $65.00 M. A loss and a cash burn together usually mean the business stopped turning profit into cash. Management offers another explanation. It says state money held for pass-through payments went out during the quarter, which contributed to a quarter-to-date operating cash use of $3,669 million. That is a claim the numbers can check, so check it, starting with the notes.

The notes let us test that story. Pass-through payments from state partners stood at about $4.50 B on June 30, 2026, and at about $1.64 B on September 30, 2026. The drop of about $2.87 B is roughly 78% of the quarter's outflow. That leaves about $0.80 B that the timing explanation does not reach. Pass-through timing alone explains most of the swing. Earlier, a $970.00 M receivable sale had been booked as operating cash, which flatters the first half, not the quarter.

The next test is in the fourth quarter. The filing says the $1.64 B still in payables will be passed through to recipients mainly in that quarter, so operating cash should fall again unless new state money arrives. The receivable program still allows $3.25 B more in sales, which could refill cash without fixing the cause. The next quarterly report will show which way it went. Will the fourth quarter refill operating cash, or does it only pay out what timing borrowed?

2026-07-01 to 2026-09-30

Statement of Cash Flows

Swipe to see the full flow
CENTENE CORPORATION cash flow reconciliation, Jul 1, 2026 through Sep 30, 2026One connected Sankey reconciles operating, investing and financing net cash flows through a shared cash pool, from beginning cash to ending cash. Ribbons flow left to right on one dollar scale. Activity totals are dark gray; beginning and ending cash are blue. Cash basis for beginning and ending balances and net cash change: Cash and cash equivalents. Intermediate calculation bars are lighter gray. Net income is green for profit and red for loss. Identified asset purchases, sales and maturities are blue in either cash direction. Orange marks positive customer-advance and deferred-revenue changes that add to operating cash in the reconciliation. These are net changes, not gross customer receipts. Negative changes are neutral reconciliation adjustments; they do not by themselves identify cash payments. Purple identifies capital transactions such as borrowing, repayments, share issuance and dividends. Free cash flow is a separate comparison, not an added cash flow. Read chart description and values below for full signed amounts, including zero items.Sales and maturities of investments → investing reconciliation: $2,290,000,000.00Divestiture proceeds, net of divested cash → investing reconciliation: $3,000,000.00investing reconciliation → Net cash from investing activities: $916,000,000.00investing reconciliation → Purchases of investments: $1,183,000,000.00investing reconciliation → Capital expenditures: $194,000,000.00Proceeds from common stock issuances → financing reconciliation: $8,000,000.00financing reconciliation → Payments and repurchases of long-term debt: $568,000,000.00financing reconciliation → Common stock repurchases: $24,000,000.00Net cash used in operating activities → operating reconciliation: $3,669,000,000.00Medical claims liabilities → operating reconciliation: $1,292,000,000.00Other assets → operating reconciliation: $891,000,000.00Depreciation and amortization → operating reconciliation: $299,000,000.00Other operating activities, net → operating reconciliation: $131,000,000.00Deferred income taxes → operating reconciliation: $69,000,000.00Stock compensation expense → operating reconciliation: $52,000,000.00(Gain) loss on divestitures, net → operating reconciliation: $15,000,000.00operating reconciliation → Net earnings (loss): $65,000,000.00operating reconciliation → Accounts payable and accrued expenses: $3,071,000,000.00operating reconciliation → Premium and trade receivables: $2,256,000,000.00operating reconciliation → Other long-term liabilities: $999,000,000.00operating reconciliation → Unearned revenue: $26,000,000.00operating reconciliation → (Gain) loss on debt extinguishment: $1,000,000.00Net cash used in financing activities → financing reconciliation: $584,000,000.00Beginning cash: Cash and cash equivalents → Cash sources and uses: $24,151,000,000.00Net cash from investing activities → Cash sources and uses: $916,000,000.00Cash sources and uses → Difference in the filed cash totals (calculated): $114,000,000.00Cash sources and uses → Ending cash: Cash and cash equivalents: $20,700,000,000.00Cash sources and uses → Net cash used in financing activities: $584,000,000.00Cash sources and uses → Net cash used in operating activities: $3,669,000,000.00Net earnings (loss): -$65,000,000.00Net earnings (loss)−$65.00 MDepreciation and amortization: $299,000,000.00Depreciation & amortization+$299.00 MStock compensation expense: $52,000,000.00Stock-based compensation+$52.00 MImpairment: $0.00Deferred income taxes: $69,000,000.00Deferred income taxes+$69.00 M(Gain) loss on divestitures, net: $15,000,000.00Business sale gain & loss+$15.00 MPremium and trade receivables: -$2,256,000,000.00Premiums receivable−$2.26 BOther assets: $891,000,000.00Other operating assets+$891.00 MMedical claims liabilities: $1,292,000,000.00Health insurance liabilities+$1.29 BUnearned revenue: -$26,000,000.00Deferred revenue−$26.00 MAccounts payable and accrued expenses: -$3,071,000,000.00Payables & accrued liabilities−$3.07 BOther long-term liabilities: -$999,000,000.00Other noncurrent liabilities−$999.00 MOther operating activities, net: $131,000,000.00Other operating, net+$131.00 M(Gain) loss on debt extinguishment: -$1,000,000.00Debt extinguishment gain & loss−$1.00 MNet cash used in operating activities: -$3,669,000,000.00. Cash required to fund net payments.Operating cash−$3.67 Boperating reconciliation: $6,418,000,000.00Proceeds from long-term debt: $0.00Payments and repurchases of long-term debt: -$568,000,000.00Long-term debt repaid−$568.00 MCommon stock repurchases: -$24,000,000.00Common stock repurchases−$24.00 MProceeds from common stock issuances: $8,000,000.00Common stock issued+$8.00 MOther financing activities, net: $0.00Purchase of noncontrolling interest: $0.00Net cash used in financing activities: -$584,000,000.00. Cash required to fund net payments.Financing cash−$584.00 Mfinancing reconciliation: $592,000,000.00Capital expenditures: -$194,000,000.00PP&E purchases−$194.00 MPurchases of investments: -$1,183,000,000.00Investment purchases−$1.18 BSales and maturities of investments: $2,290,000,000.00Investment sales & maturities+$2.29 BDivestiture proceeds, net of divested cash: $3,000,000.00Business sales, net of cash+$3.00 MNet cash from investing activities: $916,000,000.00Investing cash+$916.00 Minvesting reconciliation: $2,293,000,000.00Cash sources and uses: $25,067,000,000.00Beginning cash: Cash and cash equivalents: $24,151,000,000.00Beginning cash$24.15 BEnding cash: Cash and cash equivalents: $20,700,000,000.00Ending cash$20.70 BDifference in the filed cash totals (calculated): -$114,000,000.00Filer's cash difference(calculated)−$114.00 MCASH RECONCILIATIONInvestingflowsFinancingflowsOperatingflowsNet loss −$65.00M − net operating adjustments $3.60B = operating cash −$3.67BFree cash flow−$3.86 BOperating cash − cash spent on PP&ECash flow / Net incomeNot meaningfulOperating cash flow ÷ net incomeNet cash change−$3.45 BEnding cash − beginning cash
Chart details

CENTENE CORPORATION cash flow reconciliation, Jul 1, 2026 through Sep 30, 2026

Cash flows for Jul 1, 2026 through Sep 30, 2026. Cash basis: Cash and cash equivalents. Beginning cash: Jun 30, 2026. Ending cash: Sep 30, 2026. Beginning and ending cash are dated balances. Positive cash flows add cash; negative cash flows reduce it.

Beginning cash on Jun 30, 2026
24,151,000,000 US dollars. Beginning cash: Cash and cash equivalents
Operating activities
negative 3,669,000,000 US dollars. Net cash used.
Net earnings (loss)
negative 65,000,000 US dollars
Depreciation and amortization
299,000,000 US dollars
Stock compensation expense
52,000,000 US dollars
Impairment
0 US dollars
Deferred income taxes
69,000,000 US dollars
(Gain) loss on divestitures, net
15,000,000 US dollars
Premium and trade receivables
negative 2,256,000,000 US dollars
Other assets
891,000,000 US dollars
Medical claims liabilities
1,292,000,000 US dollars
Unearned revenue
negative 26,000,000 US dollars
Accounts payable and accrued expenses
negative 3,071,000,000 US dollars
Other long-term liabilities
negative 999,000,000 US dollars
Other operating activities, net
131,000,000 US dollars
(Gain) loss on debt extinguishment
negative 1,000,000 US dollars
Investing activities
916,000,000 US dollars. Net cash provided.
Capital expenditures
negative 194,000,000 US dollars
Purchases of investments
negative 1,183,000,000 US dollars
Sales and maturities of investments
2,290,000,000 US dollars
Divestiture proceeds, net of divested cash
3,000,000 US dollars
Financing activities
negative 584,000,000 US dollars. Net cash used.
Proceeds from long-term debt
0 US dollars
Payments and repurchases of long-term debt
negative 568,000,000 US dollars
Common stock repurchases
negative 24,000,000 US dollars
Proceeds from common stock issuances
8,000,000 US dollars
Other financing activities, net
0 US dollars
Purchase of noncontrolling interest
0 US dollars
Operating adjustment reconciliation
6,418,000,000 US dollars. Intermediate calculation joining the operating reconciliation branches. Its gross amount includes any portion of net income routed through this junction. It is not an additional cash source or use.
financing gross reconciliation
592,000,000 US dollars. Gross amount at the activity's junction before offsetting its receipts and deductions. It is not an additional cash source or use.
investing gross reconciliation
2,293,000,000 US dollars. Gross amount at the activity's junction before offsetting its receipts and deductions. It is not an additional cash source or use.
Exchange-rate effect
0 US dollars
Difference in the filed cash totals (calculated)
negative 114,000,000 US dollars. Out of cash; drawn as the small gray flow above ending cash.
Ending cash on Sep 30, 2026
20,700,000,000 US dollars. Ending cash: Cash and cash equivalents
Cash sources and uses
25,067,000,000 US dollars. Opening cash plus net sources, equal to net uses plus ending cash.
Net cash change
negative 3,451,000,000 US dollars. Ending cash minus beginning cash.
Cash flow / Net income
Not meaningful. Operating cash flow divided by reconciliation net income for the same period. The ratio is not meaningful when net income is zero or negative.
Operating cash flow
negative 3,669,000,000 US dollars. Operating cash flow used in the free cash flow calculation.
Cash purchases of property, plant and equipment
194,000,000 US dollars. These cash purchases are already included in investing activities above.
Free cash flow
negative 3,863,000,000 US dollars. A supplemental measure; finance-lease payments are excluded from this definition.

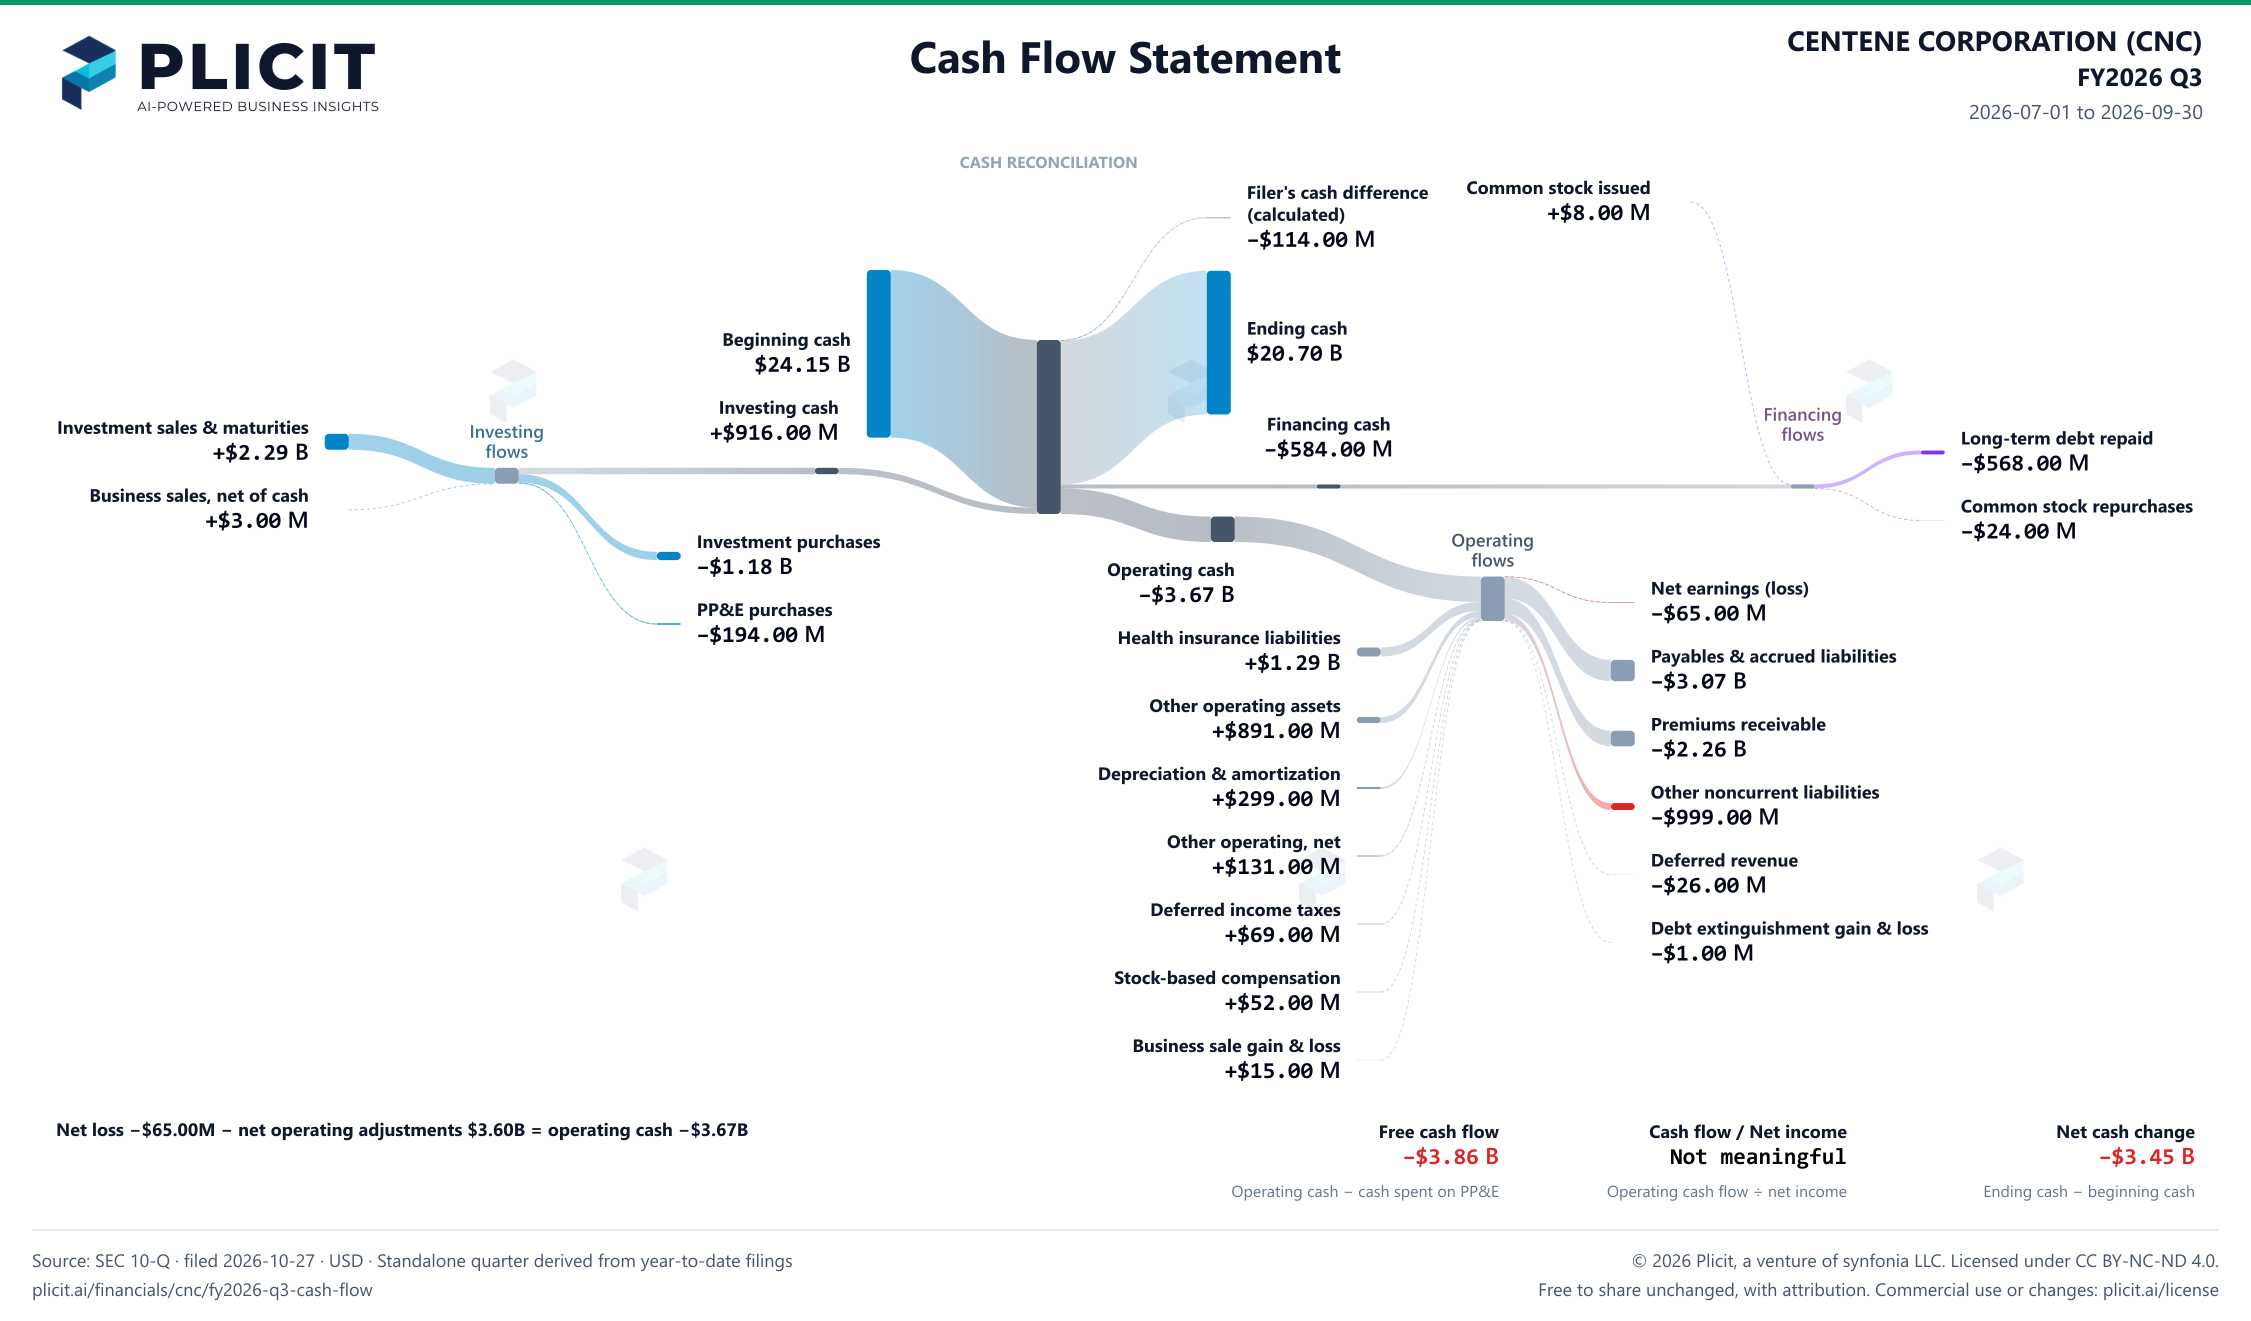
Chart connections

  • Beginning cash plus operating, investing and financing cash flows plus the exchange-rate effect equals ending cash. Negative amounts reduce cash.
  • Financing contributions meet at a reconciliation junction before connecting to the net cash total.
  • Investing contributions meet at a reconciliation junction before connecting to the net cash total.
  • Operating reconciliation adjustments are not all independent cash receipts.
  • Net loss −$65.00M − net operating adjustments $3.60B = operating cash −$3.67B. The loss reduces the earnings basis of the reconciliation; it is not a cash payment. The signed loss remains a deduction at the operating reconciliation junction.
  • Each activity has one net cash bar connected to the shared cash pool. Positive activity totals enter the pool; negative activity totals leave the pool to fund that activity's net payments. The central pool does not assign a particular funding source to a particular payment.
  • The intermediate calculation bars include both sides of the displayed activity breakdowns; they are not additional cash flows.
  • The filer's reported cash figures differ by $114.00 M: its ending cash less its beginning cash does not equal its reported net change in cash. The chart shows the difference as its own calculated flow; no reported amount has been adjusted.
  • Operating cash flow minus cash purchases of property, plant and equipment equals free cash flow: negative 3,669,000,000 US dollars minus 194,000,000 US dollars equals negative 3,863,000,000 US dollars.
  • The filer's reported cash figures differ by $114.00 M: its ending cash less its beginning cash does not equal its reported net change in cash. The chart shows the difference as its own calculated flow; no reported amount has been adjusted.
CENTENE CORPORATION (CNC) FY2026 Q3 Statement of Cash Flows Sankey chart
Free to share unchanged, with credit to Plicit.ai · CC BY-NC-ND 4.0Download PNG

Intelligent Insights for Investors

Why is Centene's cash from operations different from its profit?

Both were negative this quarter: a loss of $65.00 M, and operations used $3.67 B of cash. The biggest single difference was payables and accrued liabilities, which took away cash. Management ties the quarter's cash use to state pass-through timing.

How much cash did Centene have left after investing in its business?

Nothing was left: investment outran cash from the business by $3.86 B this quarter. It spent $194.00 M on property and equipment, the buildings, machines and computers that last for years. The gap had to come from savings, borrowing or other sources.

Did Centene start burning cash, or stop?

Started burning cash: after property and equipment spending, operations left a shortfall of $3.86 B this quarter, against about $1.15 B left over a year earlier. The change came from lower cash from operations.

Are Centene's buybacks actually reducing its share count?

No program buybacks ran this quarter: the filing says it made no repurchases under its stock repurchase program in the third quarter. The $24.00 M in the quarter's repurchase line ties to 353 thousand shares that employees gave back to pay taxes. Its average diluted share count was still up 0.6% from a year earlier, at 494 million shares.

Intelligent Insights for Lenders

Is Centene borrowing more or paying down debt?

Paying down debt: it repaid a net $568.00 M this quarter, against a net $1.00 M repaid a year earlier. Over nine months the filing shows $1.87 B of debt payments and repurchases and no new long-term debt proceeds this year.

Intelligent Insights for Everyone

Where did Centene's cash go this period?

The biggest checks it wrote this quarter were for investment purchases, $1.18 B, and debt repayment, $568.00 M. Those came out of investing and financing, the two places where money moves with investors and lenders.

Product waitlist

Health Check and Teardown for your own company

A health check uncovers insights of your private books, not a public ticker. Join this list to get notified as soon as we go-live!