
CARPENTER TECHNOLOGY CORPORATION (CRS) FY2027 Q1 Balance Sheet

Published · Updated Source: Form 10-Q on SEC EDGAR filed (opens in a new tab)

Key Takeaways

  • Cash fell from $393.30 M to $159.50 M in one quarter, a drop of 59% that the debt did not match.
  • Cash covers only 23% of the $691.00 M of debt, and the debt barely moved over the quarter.
  • Shareholders' equity of $2.18 B outweighs the $1.56 B of liabilities, so the owners fund more than lenders.
  • Property, plant and equipment is the biggest asset at $1.54 B, 41% of everything the company owns.

The Unvarnished Truth

Carpenter Technology's cash fell 59% in one quarter

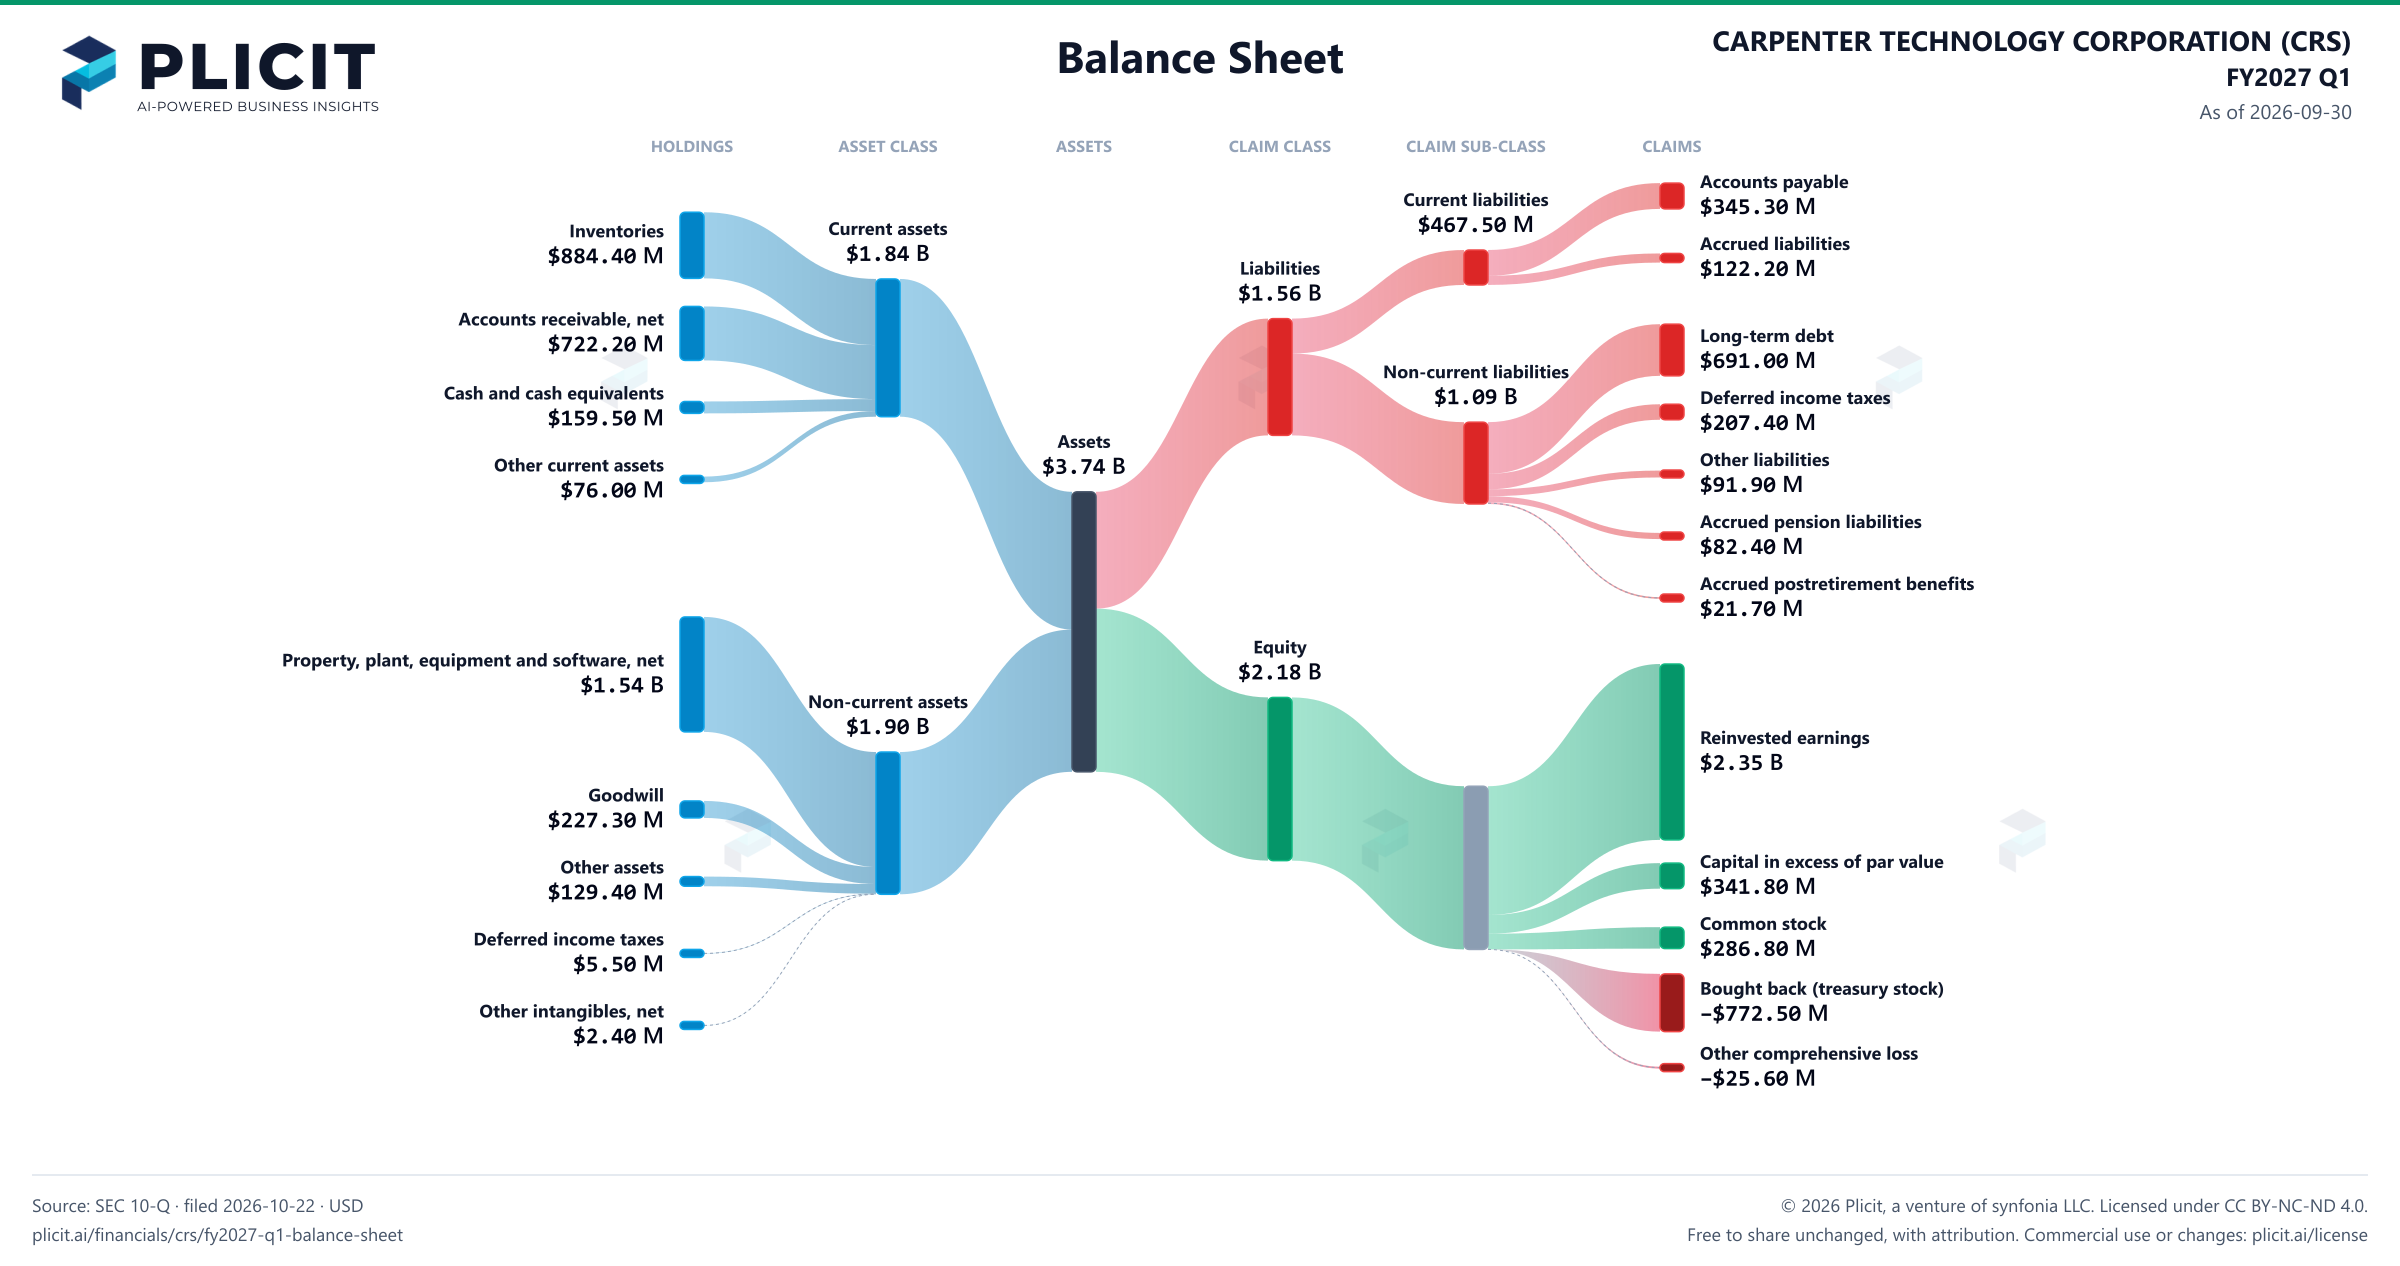
Carpenter Technology's bank balance fell 59% in a single quarter. It stood at $159.50 M on September 30, 2026, down from $393.30 M on June 30, 2026. Against $691.00 M of debt, that cash covers only 23%, and the debt itself barely moved, up $0.30 M. So the money that left did not come from borrowing, and the cash flow statement shows where it went. Owners still look well covered on paper, with $2.18 B of equity against $1.56 B of liabilities, which is why the drop is easy to miss.

Why does a company with this much equity run so thin on cash? The answer sits in what it owns. Property, plant and equipment is its largest asset at $1.54 B, and inventories add $884.40 M more, together 65% of its $3.74 B of assets. Plant does not turn back into cash quickly, and inventory has to be sold first, so the squeeze is about timing rather than solvency. Its current assets of $1.84 B cover its bills due within a year: for each dollar due, it holds $3.94 in cash and assets that should turn into cash soon.

The balance sheet says the company is not in trouble yet, and it says little about how fast cash is leaving. Retained earnings rose 7% to $2.35 B, so the profit built up over its life is still on the books. What it does not show is the pace of spending, which only the cash flow statement reveals, and that is the next page to read. Watch the cash line next quarter: if the plant keeps absorbing money at this pace, how long before the company has to borrow again?
As of 2026-09-30

Balance Sheet

Swipe to see the full flow
CARPENTER TECHNOLOGY CORPORATION (CRS) FY2027 Q1 Balance SheetBalance sheet as of 2026-09-30. The chart shows assets, liabilities and equity at that date.Current liabilities$467.50 MCurrent assets$1.84 BLiabilities$1.56 BNon-current liabilities$1.09 BAssets$3.74 BEquity$2.18 BNon-current assets$1.90 BHOLDINGSASSET CLASSASSETSCLAIM CLASSCLAIM SUB-CLASSCLAIMSInventoriesAccounts receivable, netCash and cash equivalentsOther current assetsProperty, plant, equipment and software, netGoodwillOther assetsDeferred income taxesOther intangibles, netAccounts payableAccrued liabilitiesLong-term debtDeferred income taxesOther liabilitiesAccrued pension liabilitiesAccrued postretirement benefitsReinvested earningsCapital in excess of par valueCommon stock — authorized 100,000,000 shares; issued 57,365,948 shares at September 30, 2026 and 57,359,343 shares at June 30, 2026; outstanding 49,530,926 shares at September 30, 2026 and 49,606,583 shares at June 30, 2026Common stock in treasury (7,835,022 shares and 7,752,760 shares at September 30, 2026 and June 30, 2026, respectively), at costAccumulated other comprehensive lossCurrent assetsNon-current assetsAssetsCurrent liabilitiesNon-current liabilitiesLiabilitiesEquityEquityAccounts payableAccounts payable$345.30 MCurrent liabilitiesCurrent liabilities$467.50 MCurrent assetsCurrent assets$1.84 BInventoriesInventories$884.40 MAccrued liabilitiesAccrued liabilities$122.20 MLiabilitiesLiabilities$1.56 BAccounts receivable, netAccounts receivable, net$722.20 MLong-term debtLong-term debt$691.00 MNon-current liabilitiesNon-current liabilities$1.09 BCash and cash equivalentsCash and cash equivalents$159.50 MDeferred income taxesDeferred income taxes$207.40 MAssetsAssets$3.74 BOther liabilitiesOther liabilities$91.90 MOther current assetsOther current assets$76.00 MAccrued pension liabilitiesAccrued pension liabilities$82.40 MAccrued postretirement benefitsAccrued postretirement benefits$21.70 MEquityEquity$2.18 BProperty, plant, equipment and software, netProperty, plant, equipment and software, net$1.54 BNon-current assetsNon-current assets$1.90 BReinvested earningsReinvested earnings$2.35 BGoodwillGoodwill$227.30 MCapital in excess of par valueCapital in excess of par value$341.80 MOther assetsOther assets$129.40 MCommon stock — authorized 100,000,000 shares; issued 57,365,948 shares at September 30, 2026 and 57,359,343 shares at June 30, 2026; outstanding 49,530,926 shares at September 30, 2026 and 49,606,583 shares at June 30, 2026Common stock$286.80 MDeferred income taxesDeferred income taxes$5.50 MCommon stock in treasury (7,835,022 shares and 7,752,760 shares at September 30, 2026 and June 30, 2026, respectively), at costBought back (treasury stock)−$772.50 MOther intangibles, netOther intangibles, net$2.40 MAccumulated other comprehensive lossOther comprehensive loss−$25.60 M
Chart details

CARPENTER TECHNOLOGY CORPORATION (CRS) FY2027 Q1 Balance Sheet

Balance sheet as of 2026-09-30. The chart shows assets, liabilities and equity at that date.

Assets
3,744,700,000 US dollars
Current assets
1,842,100,000 US dollars
Non-current assets
1,902,600,000 US dollars
Liabilities
1,561,900,000 US dollars
Current liabilities
467,500,000 US dollars
Non-current liabilities
1,094,400,000 US dollars
Equity
2,182,800,000 US dollars
Inventories
884,400,000 US dollars
Accounts receivable, net
722,200,000 US dollars
Cash and cash equivalents
159,500,000 US dollars
Other current assets
76,000,000 US dollars
Property, plant, equipment and software, net
1,538,000,000 US dollars
Goodwill
227,300,000 US dollars
Other assets
129,400,000 US dollars
Deferred income taxes
5,500,000 US dollars
Other intangibles, net
2,400,000 US dollars
Accounts payable
345,300,000 US dollars
Accrued liabilities
122,200,000 US dollars
Long-term debt
691,000,000 US dollars
Deferred income taxes
207,400,000 US dollars
Other liabilities
91,900,000 US dollars
Accrued pension liabilities
82,400,000 US dollars
Accrued postretirement benefits
21,700,000 US dollars
Reinvested earnings
2,352,300,000 US dollars
Capital in excess of par value
341,800,000 US dollars
Common stock — authorized 100,000,000 shares; issued 57,365,948 shares at September 30, 2026 and 57,359,343 shares at June 30, 2026; outstanding 49,530,926 shares at September 30, 2026 and 49,606,583 shares at June 30, 2026
286,800,000 US dollars
Common stock in treasury (7,835,022 shares and 7,752,760 shares at September 30, 2026 and June 30, 2026, respectively), at cost
negative 772,500,000 US dollars
Accumulated other comprehensive loss
negative 25,600,000 US dollars

Chart connections

  • Assets equal liabilities plus consolidated equity. Consolidated equity includes noncontrolling interests when reported.
  • Treasury shares and other negative equity contributions reduce equity.
CARPENTER TECHNOLOGY CORPORATION (CRS) FY2027 Q1 Balance Sheet Sankey chart
Free to share unchanged, with credit to Plicit.ai · CC BY-NC-ND 4.0Download PNG

Intelligent Insights for Investors

How much debt does Carpenter Technology have?

Carpenter Technology owed $691.00 M in debt on September 30, 2026, and held $159.50 M in cash, enough for 23% of it. The debt barely moved from $690.70 M at June 30, 2026.

How much cash does Carpenter Technology have on hand?

Its bank balance stood at $159.50 M on September 30, 2026, down 59% from $393.30 M at June 30, 2026. Against $467.50 M of current liabilities (bills, wages, taxes and loan payments due within a year), that cash covers 34%, and the rest must come from incoming cash or other assets.

Is Carpenter Technology funded more by what it owes or by its owners?

Owners fund more of the company than lenders do: shareholders' equity was $2.18 B on September 30, 2026, against $1.56 B of liabilities, everything it owes to lenders, suppliers, employees and others. For every dollar it owes, the owners' stake is $1.40.

Has Carpenter Technology built up profit over its lifetime or accumulated a deficit?

Profit kept in the business over its life, called retained earnings, stood at $2.35 B on September 30, 2026, up 7% from $2.20 B at June 30, 2026.

Intelligent Insights for Lenders

Can Carpenter Technology cover the bills due within a year?

Carpenter Technology held $3.94 in current assets for every dollar of current liabilities on September 30, 2026, which looks comfortable. That cover is only as good as how quickly inventory sells, and inventory alone is 48% of its current assets.

Intelligent Insights for Suppliers

What does Carpenter Technology owe, and to whom?

Lenders are owed the most: $691.00 M, or 44% of the $1.56 B total owed on September 30, 2026. Suppliers come next at $345.30 M, or 22%.

Product waitlist

Health Check and Teardown for your own company

A health check uncovers insights of your private books, not a public ticker. Join this list to get notified as soon as we go-live!