
CSX CORPORATION (CSX) FY2025 Annual Balance Sheet

Balance Sheet

As of 2025-12-31

Swipe to see the full flow
CSX CORPORATION (CSX) FY2025 Annual Balance SheetBalance sheet as of 2025-12-31. The chart shows assets, liabilities and equity at that date.Current liabilities$3.13 BCurrent assets$2.55 BLiabilities$30.52 BAssets$43.68 BNon-current liabilities$27.39 BNon-current assets$41.13 BEquity$13.16 BGross equity(calculated)$13.37 BHOLDINGSASSET CLASSASSETSCLAIM CLASSCLAIM SUB-CLASSCLAIMSAccounts Receivable - Net (Note 11)Cash and Cash EquivalentsMaterials and SuppliesOther Current AssetsShort-term InvestmentsProperties - Net (Note 6)Investment in Affiliates and Other Companies (Note 15)Other Long-term AssetsRight of Use Lease Asset (Note 7)Goodwill and Other Intangible Assets - Net (Note 18)Accounts PayableCurrent Maturities of Long-term Debt (Note 10)Labor and Fringe Benefits PayableOther Current LiabilitiesCasualty, Environmental and Other Reserves (Note 5)Interest PayableIncome and Other Taxes PayableLong-term Debt (Note 10)Deferred Income Taxes - Net (Note 12)Other Long-term LiabilitiesLong-term Lease Liability (Note 7)Casualty, Environmental and Other Reserves (Note 5)Retained EarningsCommon Stock, $1 Par Value (Note 3)Other CapitalNon-controlling Minority InterestCurrent assetsNon-current assetsAssetsCurrent liabilitiesNon-current liabilitiesLiabilitiesEquityGross equity (calculated)Accumulated Other Comprehensive Loss (Note 16)Accounts PayableAccounts Payable$1.15 BCurrent Maturities of Long-term Debt (Note 10)Current Maturities of Long-term Debt (Note 10)$708.00 MLabor and Fringe Benefits PayableLabor and Fringe Benefits Payable$532.00 MCurrent liabilitiesCurrent liabilities$3.13 BAccounts Receivable - Net (Note 11)Accounts Receivable - Net (Note 11)$1.30 BOther Current LiabilitiesOther Current Liabilities$272.00 MCash and Cash EquivalentsCash and Cash Equivalents$670.00 MCurrent assetsCurrent assets$2.55 BCasualty, Environmental and Other Reserves (Note 5)Casualty, Environmental and Other Reserves (Note 5)$184.00 MMaterials and SuppliesMaterials and Supplies$390.00 MLiabilitiesLiabilities$30.52 BInterest PayableInterest Payable$170.00 MOther Current AssetsOther Current Assets$187.00 MAssetsAssets$43.68 BIncome and Other Taxes PayableIncome and Other Taxes Payable$118.00 MShort-term InvestmentsShort-term Investments$5.00 MNon-current liabilitiesNon-current liabilities$27.39 BNon-current assetsNon-current assets$41.13 BLong-term Debt (Note 10)Long-term Debt (Note 10)$18.17 BProperties - Net (Note 6)Properties - Net (Note 6)$36.81 BDeferred Income Taxes - Net (Note 12)Deferred Income Taxes - Net (Note 12)$7.91 BEquityEquity$13.16 BOther Long-term LiabilitiesOther Long-term Liabilities$536.00 MLong-term Lease Liability (Note 7)Long-term Lease Liability (Note 7)$479.00 MInvestment in Affiliates and Other Companies (Note 15)Investment in Affiliates and Other Companies (Note 15)$2.63 BCasualty, Environmental and Other Reserves (Note 5)Casualty, Environmental and Other Reserves (Note 5)$295.00 MGross equity (calculated)Gross equity(calculated)$13.37 BOther Long-term AssetsOther Long-term Assets$956.00 MRetained EarningsRetained Earnings$10.56 BRight of Use Lease Asset (Note 7)Right of Use Lease Asset (Note 7)$464.00 MCommon Stock, $1 Par Value (Note 3)Common Stock, $1 Par Value (Note 3)$1.86 BGoodwill and Other Intangible Assets - Net (Note 18)Goodwill and Other Intangible Assets - Net (Note 18)$267.00 MOther CapitalOther Capital$948.00 MNon-controlling Minority InterestNon-controlling Minority Interest$5.00 MAccumulated Other Comprehensive Loss (Note 16)Accumulated Other Comprehensive Loss (Note 16)−$213.00 M
Chart details

CSX CORPORATION (CSX) FY2025 Annual Balance Sheet

Balance sheet as of 2025-12-31. The chart shows assets, liabilities and equity at that date.

Assets
43,682,000,000 US dollars
Current assets
2,550,000,000 US dollars
Non-current assets
41,132,000,000 US dollars
Liabilities
30,522,000,000 US dollars
Current liabilities
3,133,000,000 US dollars
Non-current liabilities
27,389,000,000 US dollars
Equity
13,160,000,000 US dollars
Noncontrolling interest
5,000,000 US dollars. Included in consolidated equity; this amount is not added again.
Properties
53,816,000,000 US dollars. Part of Properties - Net (Note 6), drawn as one net amount.
Accumulated Depreciation
negative 17,005,000,000 US dollars. Part of Properties - Net (Note 6), drawn as one net amount.
Accounts Receivable - Net (Note 11)
1,298,000,000 US dollars
Cash and Cash Equivalents
670,000,000 US dollars
Materials and Supplies
390,000,000 US dollars
Other Current Assets
187,000,000 US dollars
Short-term Investments
5,000,000 US dollars
Properties - Net (Note 6)
36,811,000,000 US dollars
Investment in Affiliates and Other Companies (Note 15)
2,634,000,000 US dollars
Other Long-term Assets
956,000,000 US dollars
Right of Use Lease Asset (Note 7)
464,000,000 US dollars
Goodwill and Other Intangible Assets - Net (Note 18)
267,000,000 US dollars
Accounts Payable
1,149,000,000 US dollars
Current Maturities of Long-term Debt (Note 10)
708,000,000 US dollars
Labor and Fringe Benefits Payable
532,000,000 US dollars
Other Current Liabilities
272,000,000 US dollars
Casualty, Environmental and Other Reserves (Note 5)
184,000,000 US dollars
Interest Payable
170,000,000 US dollars
Income and Other Taxes Payable
118,000,000 US dollars
Long-term Debt (Note 10)
18,165,000,000 US dollars
Deferred Income Taxes - Net (Note 12)
7,914,000,000 US dollars
Other Long-term Liabilities
536,000,000 US dollars
Long-term Lease Liability (Note 7)
479,000,000 US dollars
Casualty, Environmental and Other Reserves (Note 5)
295,000,000 US dollars
Retained Earnings
10,560,000,000 US dollars
Common Stock, $1 Par Value (Note 3)
1,860,000,000 US dollars
Other Capital
948,000,000 US dollars
Non-controlling Minority Interest
5,000,000 US dollars
Accumulated Other Comprehensive Loss (Note 16)
negative 213,000,000 US dollars
Gross equity (calculated)
13,373,000,000 US dollars. Net equity plus the magnitudes of its negative contributions equals gross positive equity. The negative contributions enter this reconciliation as add-backs; their filed signs stay negative.

Chart connections

  • Assets equal liabilities plus consolidated equity. Consolidated equity includes noncontrolling interests when reported.
  • Treasury shares and other negative equity contributions reduce equity.
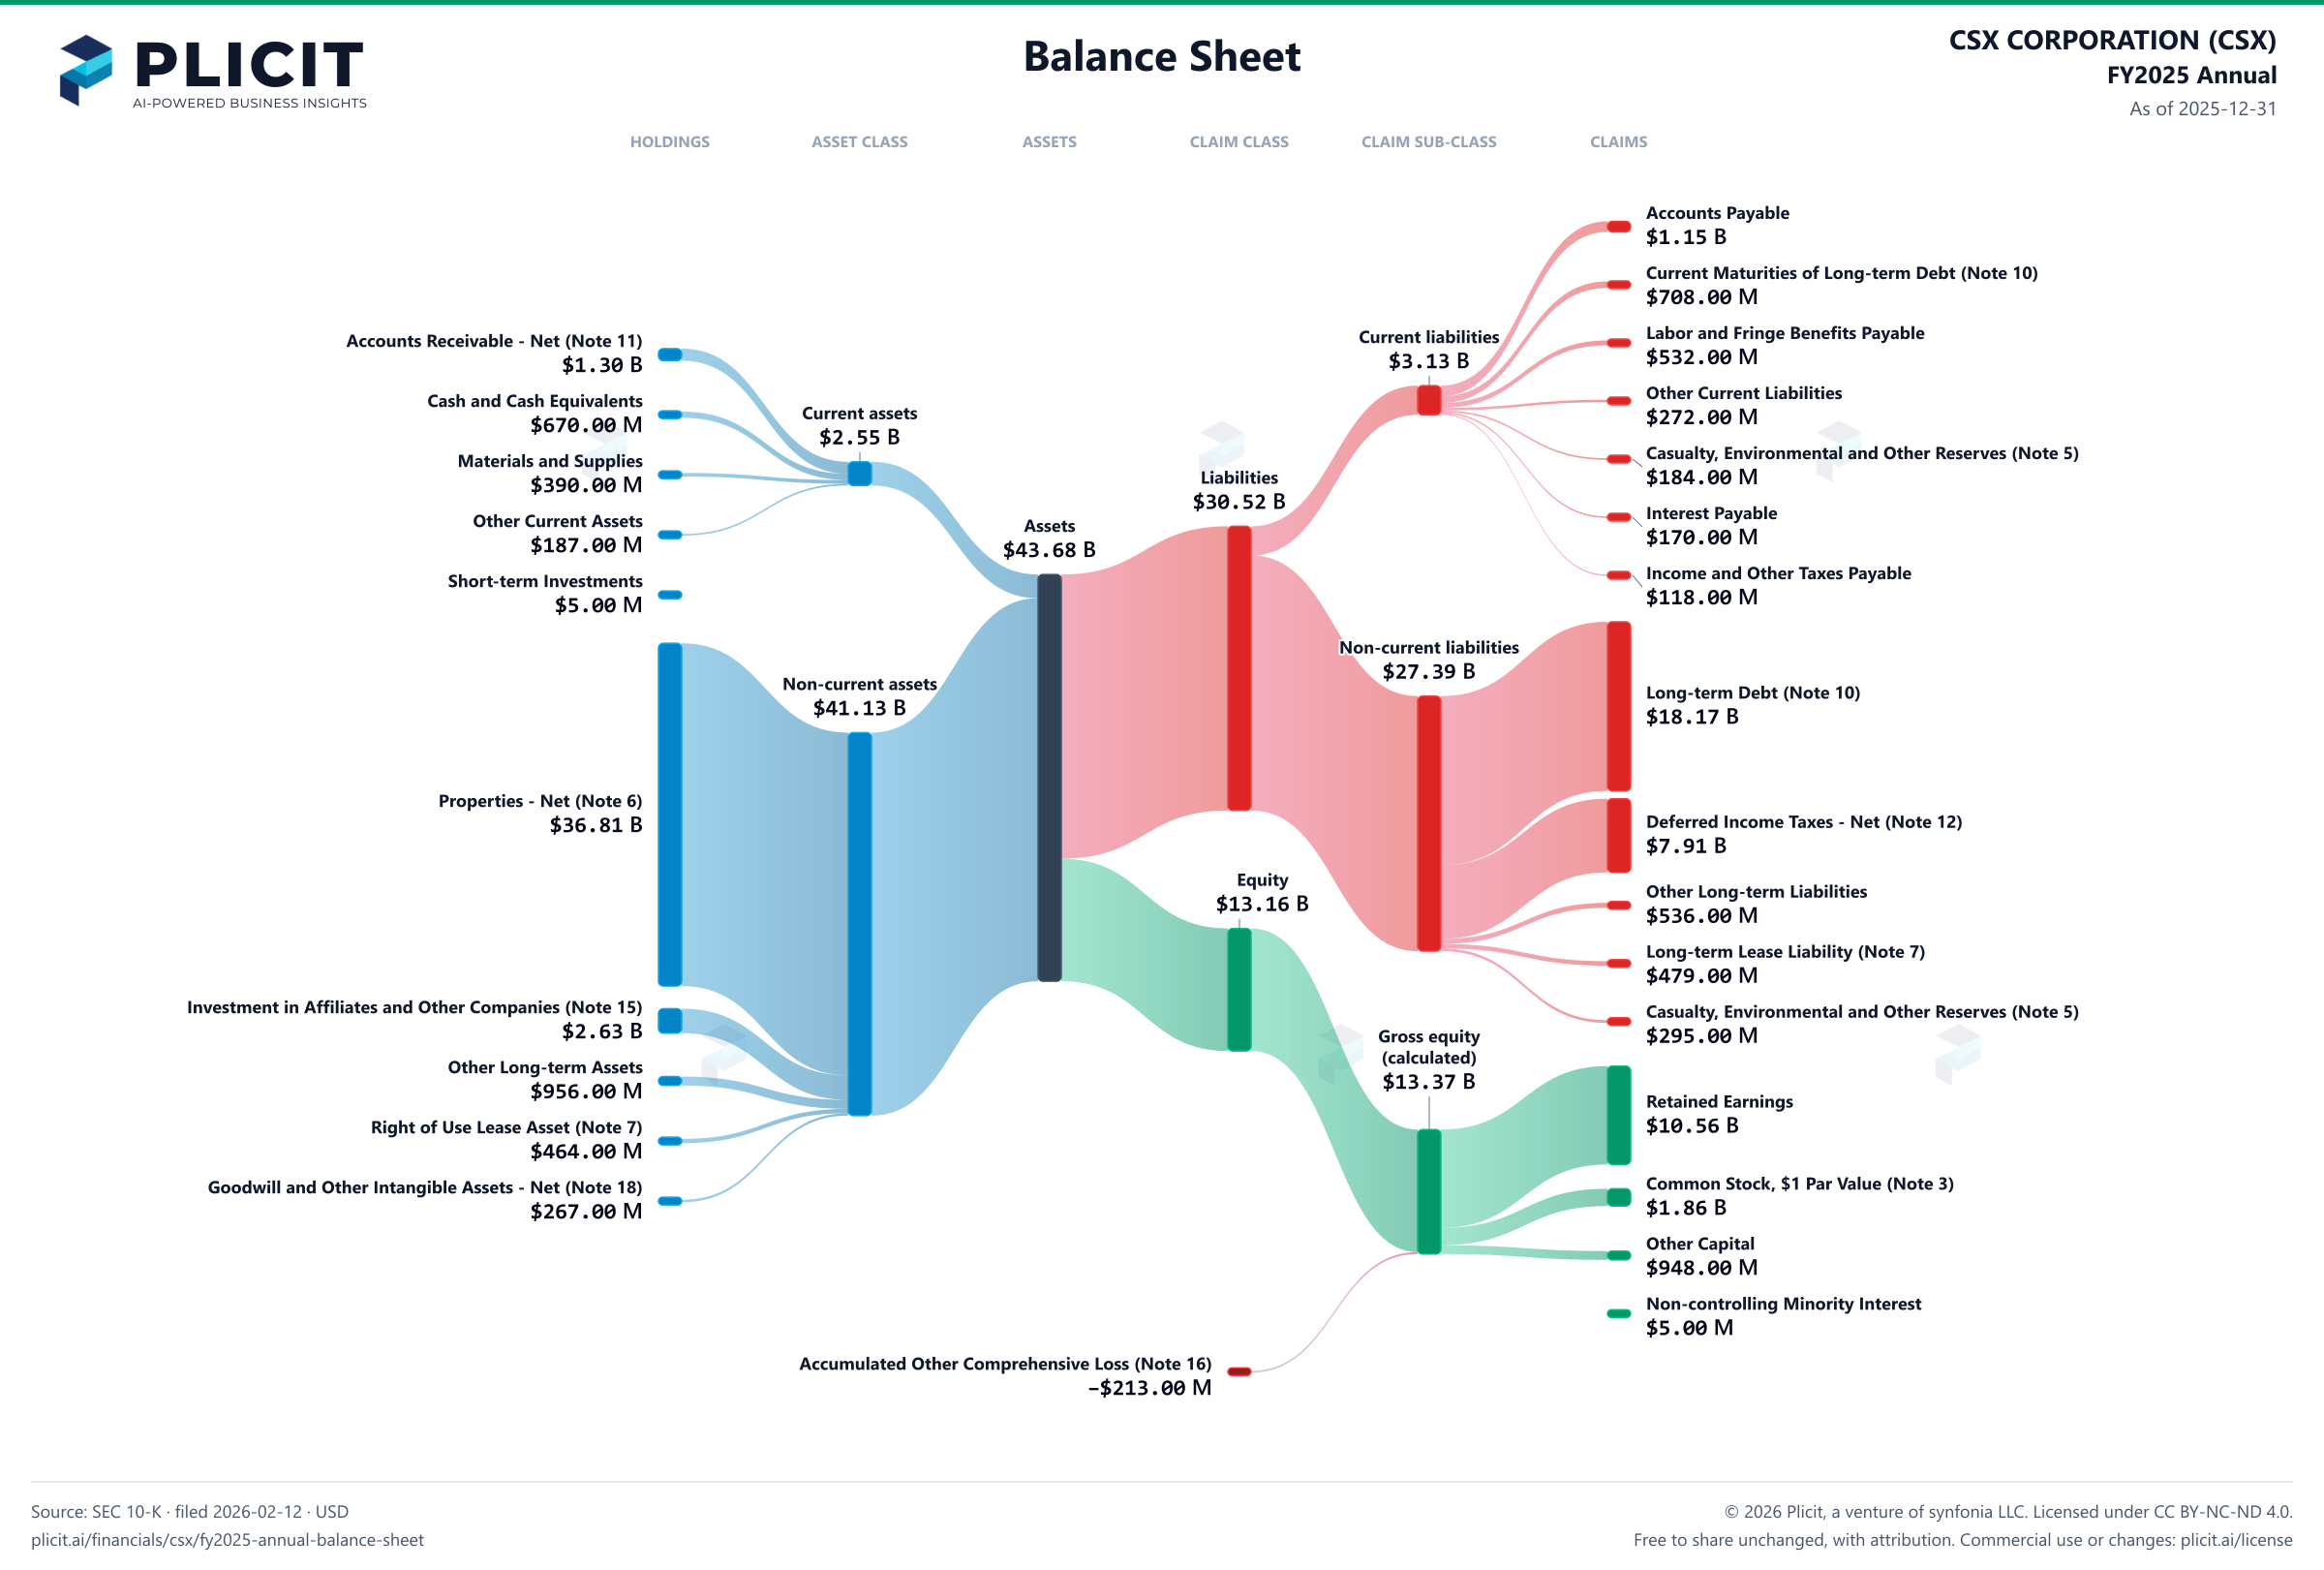
CSX CORPORATION (CSX) FY2025 Annual Balance Sheet Sankey chart
Free to share unchanged, with credit to Plicit.ai · CC BY-NC-ND 4.0Download PNG

Newsletter

Get the teardowns by email

Subscribe if you want the public-company teardowns in your inbox when they're released.

Product waitlist

Health Check and Teardown for your own company

A health check uncovers insights of your private books, not a public ticker. Join this list to get notified as soon as we go-live!