
CSX CORPORATION (CSX) FY2026 Q2 Balance Sheet
As of 2026-06-30
Balance Sheet
As of 2026-06-30
Swipe to see the full flow
Chart details
CSX CORPORATION (CSX) FY2026 Q2 Balance Sheet
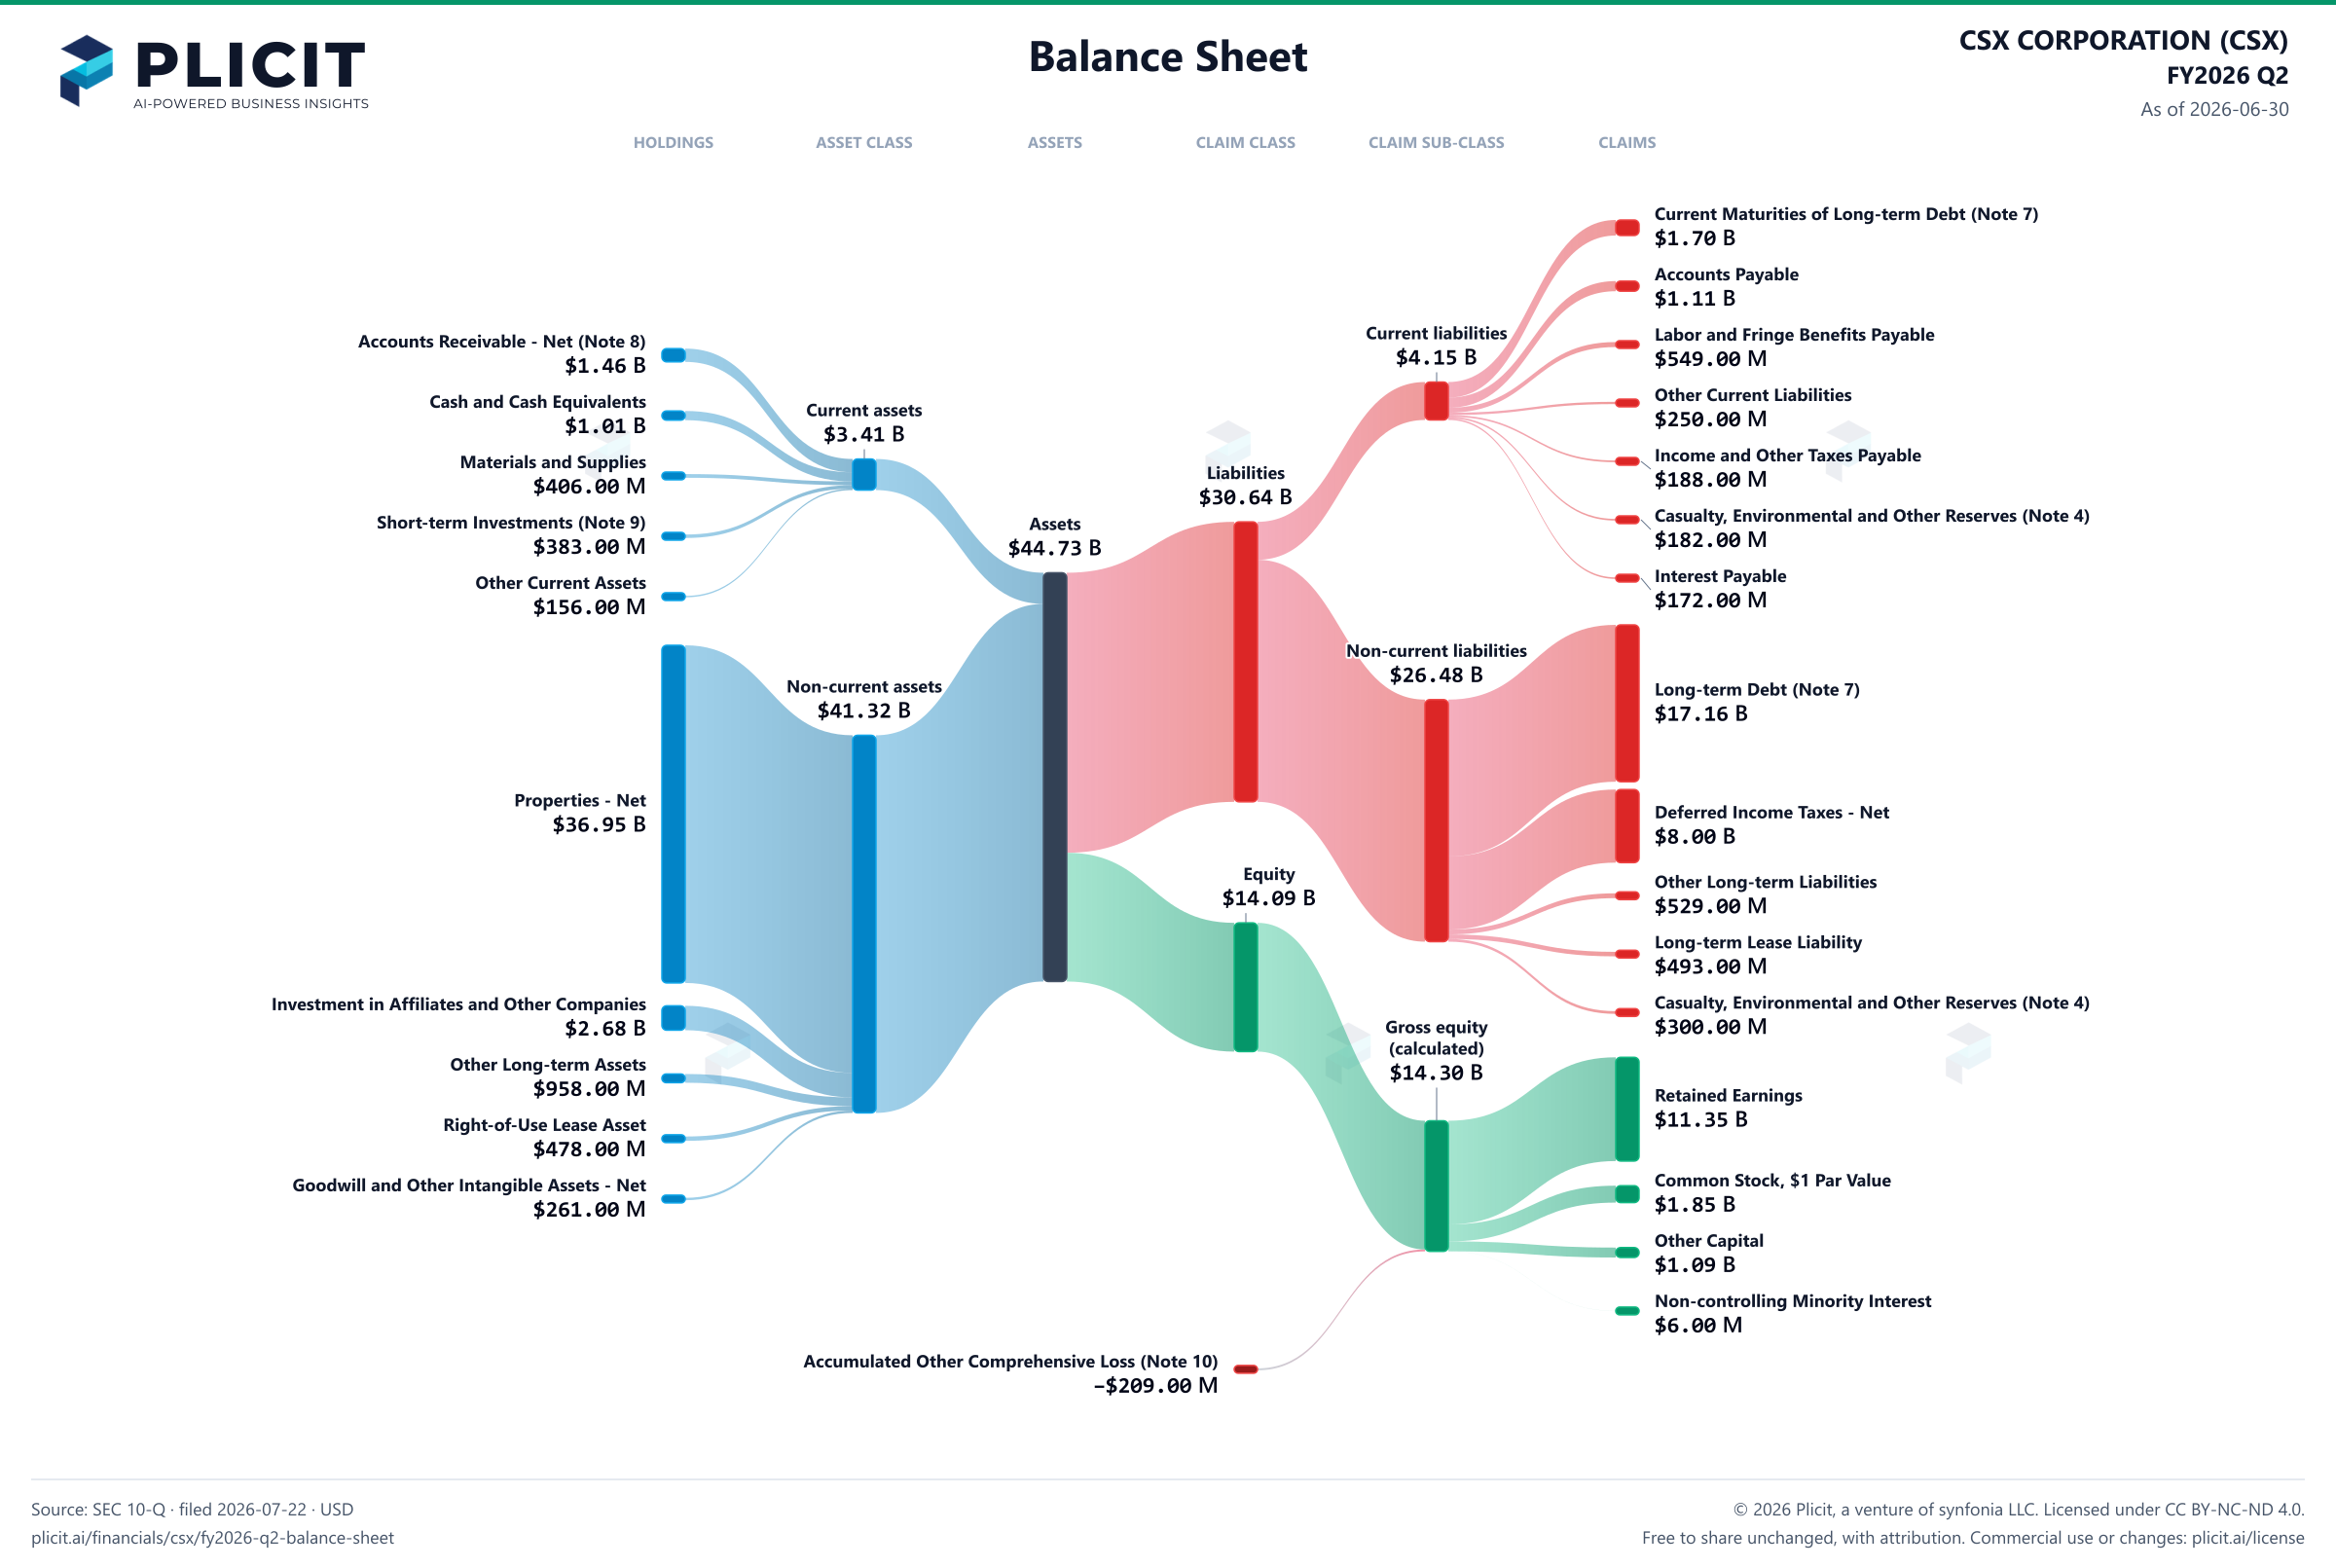
Balance sheet as of 2026-06-30. The chart shows assets, liabilities and equity at that date.
- Assets
- 44,726,000,000 US dollars
- Current assets
- 3,408,000,000 US dollars
- Non-current assets
- 41,318,000,000 US dollars
- Liabilities
- 30,638,000,000 US dollars
- Current liabilities
- 4,154,000,000 US dollars
- Non-current liabilities
- 26,484,000,000 US dollars
- Equity
- 14,088,000,000 US dollars
- Noncontrolling interest
- 6,000,000 US dollars. Included in consolidated equity; this amount is not added again.
- Properties
- 54,464,000,000 US dollars. Part of Properties - Net, drawn as one net amount.
- Accumulated Depreciation
- negative 17,518,000,000 US dollars. Part of Properties - Net, drawn as one net amount.
- Accounts Receivable - Net (Note 8)
- 1,456,000,000 US dollars
- Cash and Cash Equivalents
- 1,007,000,000 US dollars
- Materials and Supplies
- 406,000,000 US dollars
- Short-term Investments (Note 9)
- 383,000,000 US dollars
- Other Current Assets
- 156,000,000 US dollars
- Properties - Net
- 36,946,000,000 US dollars
- Investment in Affiliates and Other Companies
- 2,675,000,000 US dollars
- Other Long-term Assets
- 958,000,000 US dollars
- Right-of-Use Lease Asset
- 478,000,000 US dollars
- Goodwill and Other Intangible Assets - Net
- 261,000,000 US dollars
- Current Maturities of Long-term Debt (Note 7)
- 1,702,000,000 US dollars
- Accounts Payable
- 1,111,000,000 US dollars
- Labor and Fringe Benefits Payable
- 549,000,000 US dollars
- Other Current Liabilities
- 250,000,000 US dollars
- Income and Other Taxes Payable
- 188,000,000 US dollars
- Casualty, Environmental and Other Reserves (Note 4)
- 182,000,000 US dollars
- Interest Payable
- 172,000,000 US dollars
- Long-term Debt (Note 7)
- 17,162,000,000 US dollars
- Deferred Income Taxes - Net
- 8,000,000,000 US dollars
- Other Long-term Liabilities
- 529,000,000 US dollars
- Long-term Lease Liability
- 493,000,000 US dollars
- Casualty, Environmental and Other Reserves (Note 4)
- 300,000,000 US dollars
- Retained Earnings
- 11,352,000,000 US dollars
- Common Stock, $1 Par Value
- 1,852,000,000 US dollars
- Other Capital
- 1,087,000,000 US dollars
- Non-controlling Minority Interest
- 6,000,000 US dollars
- Accumulated Other Comprehensive Loss (Note 10)
- negative 209,000,000 US dollars
- Gross equity (calculated)
- 14,297,000,000 US dollars. Net equity plus the magnitudes of its negative contributions equals gross positive equity. The negative contributions enter this reconciliation as add-backs; their filed signs stay negative.
Chart connections
- Assets equal liabilities plus consolidated equity. Consolidated equity includes noncontrolling interests when reported.
- Treasury shares and other negative equity contributions reduce equity.
Free to share unchanged, with credit to Plicit.ai · CC BY-NC-ND 4.0Download PNG
Product waitlist
Health Check and Teardown for your own company
A health check uncovers insights of your private books, not a public ticker. Join this list to get notified as soon as we go-live!