
ENERGY TRANSFER LP (ET) FY2026 Q2 Balance Sheet

Balance Sheet

As of 2026-06-30

Swipe to see the full flow
ENERGY TRANSFER LP (ET) FY2026 Q2 Balance SheetBalance sheet as of 2026-06-30. The chart shows assets, liabilities and equity at that date.Current liabilities$19.86 BCurrent assets$23.11 BLiabilities(calculated)$97.65 BAssets$148.17 BNon-current liabilities$77.79 BNon-current assets$125.06 BEquity$50.52 BGross equity(calculated)$50.52 BHOLDINGSASSET CLASSASSETSCLAIM CLASSCLAIM SUB-CLASSCLAIMSAccounts receivable, netInventoriesCash and cash equivalentsOther current assetsAccounts receivable from related companiesIncome taxes receivableDerivative assetsProperty, plant and equipment, netIntangible assets, netGoodwillInvestments in unconsolidated affiliatesOther non-current assets, netLease right-of-use assets, netAccounts payable - Nonrelated PartyAccrued and other current liabilitiesOperating lease current liabilitiesAccounts payable - Related PartyCurrent maturities of long-term debtDerivative liabilitiesLong-term debt, less current maturitiesDeferred income taxesOther non-current liabilitiesNon-current operating lease liabilitiesRedeemable noncontrolling interestsCommon UnitholdersNoncontrolling interestsPreferred UnitholdersAccumulated other comprehensive incomeCurrent assetsNon-current assetsAssetsCurrent liabilitiesNon-current liabilitiesLiabilities (calculated)EquityGross equity (calculated)General PartnerAccounts payable - Nonrelated PartyAccounts payable - Nonrelated Party$13.72 BAccounts receivable, netAccounts receivable, net$16.82 BAccrued and other current liabilitiesAccrued and other current liabilities$5.86 BCurrent liabilitiesCurrent liabilities$19.86 BInventoriesInventories$4.39 BOperating lease current liabilitiesOperating lease current liabilities$215.00 MCurrent assetsCurrent assets$23.11 BCash and cash equivalentsCash and cash equivalents$1.02 BAccounts payable - Related PartyAccounts payable - Related Party$47.00 MLiabilities (calculated)Liabilities(calculated)$97.65 BOther current assetsOther current assets$627.00 MCurrent maturities of long-term debtCurrent maturities of long-term debt$12.00 MAccounts receivable from related companiesAccounts receivable from related companies$223.00 MAssetsAssets$148.17 BDerivative liabilitiesDerivative liabilities$8.00 MIncome taxes receivableIncome taxes receivable$28.00 MDerivative assetsDerivative assets$12.00 MNon-current liabilitiesNon-current liabilities$77.79 BLong-term debt, less current maturitiesLong-term debt, less current maturities$68.39 BNon-current assetsNon-current assets$125.06 BDeferred income taxesDeferred income taxes$5.57 BProperty, plant and equipment, netProperty, plant and equipment, net$104.10 BEquityEquity$50.52 BOther non-current liabilitiesOther non-current liabilities$1.95 BNon-current operating lease liabilitiesNon-current operating lease liabilities$1.62 BRedeemable noncontrolling interestsRedeemable noncontrolling interests$256.00 MIntangible assets, netIntangible assets, net$7.16 BGross equity (calculated)Gross equity(calculated)$50.52 BGoodwillGoodwill$5.61 BCommon UnitholdersCommon Unitholders$31.93 BInvestments in unconsolidated affiliatesInvestments in unconsolidated affiliates$3.64 BNoncontrolling interestsNoncontrolling interests$15.19 BOther non-current assets, netOther non-current assets, net$2.62 BPreferred UnitholdersPreferred Unitholders$3.36 BLease right-of-use assets, netLease right-of-use assets, net$1.94 BAccumulated other comprehensive incomeAccumulated other comprehensive income$49.00 MGeneral PartnerGeneral Partner−$1.00 M
Chart details

ENERGY TRANSFER LP (ET) FY2026 Q2 Balance Sheet

Balance sheet as of 2026-06-30. The chart shows assets, liabilities and equity at that date.

Assets
148,168,000,000 US dollars
Current assets
23,113,000,000 US dollars
Non-current assets
125,055,000,000 US dollars
Liabilities (calculated)
97,646,000,000 US dollars
Current liabilities
19,858,000,000 US dollars
Non-current liabilities
77,788,000,000 US dollars
Equity
50,522,000,000 US dollars
Accumulated depreciation and depletion
negative 41,977,000,000 US dollars. Part of Property, plant and equipment, net, drawn as one net amount.
Property, plant and equipment
146,073,000,000 US dollars. Part of Property, plant and equipment, net, drawn as one net amount.
Accounts receivable, net
16,818,000,000 US dollars
Inventories
4,385,000,000 US dollars
Cash and cash equivalents
1,020,000,000 US dollars
Other current assets
627,000,000 US dollars
Accounts receivable from related companies
223,000,000 US dollars
Income taxes receivable
28,000,000 US dollars
Derivative assets
12,000,000 US dollars
Property, plant and equipment, net
104,096,000,000 US dollars
Intangible assets, net
7,160,000,000 US dollars
Goodwill
5,608,000,000 US dollars
Investments in unconsolidated affiliates
3,637,000,000 US dollars
Other non-current assets, net
2,615,000,000 US dollars
Lease right-of-use assets, net
1,939,000,000 US dollars
Accounts payable - Nonrelated Party
13,720,000,000 US dollars
Accrued and other current liabilities
5,856,000,000 US dollars
Operating lease current liabilities
215,000,000 US dollars
Accounts payable - Related Party
47,000,000 US dollars
Current maturities of long-term debt
12,000,000 US dollars
Derivative liabilities
8,000,000 US dollars
Long-term debt, less current maturities
68,393,000,000 US dollars
Deferred income taxes
5,572,000,000 US dollars
Other non-current liabilities
1,946,000,000 US dollars
Non-current operating lease liabilities
1,621,000,000 US dollars
Redeemable noncontrolling interests
256,000,000 US dollars
Common Unitholders
31,927,000,000 US dollars
Noncontrolling interests
15,191,000,000 US dollars
Preferred Unitholders
3,356,000,000 US dollars
Accumulated other comprehensive income
49,000,000 US dollars
General Partner
negative 1,000,000 US dollars
Gross equity (calculated)
50,523,000,000 US dollars. Net equity plus the magnitudes of its negative contributions equals gross positive equity. The negative contributions enter this reconciliation as add-backs; their filed signs stay negative.

Chart connections

  • Assets equal liabilities plus consolidated equity. Consolidated equity includes noncontrolling interests when reported.
  • Treasury shares and other negative equity contributions reduce equity.
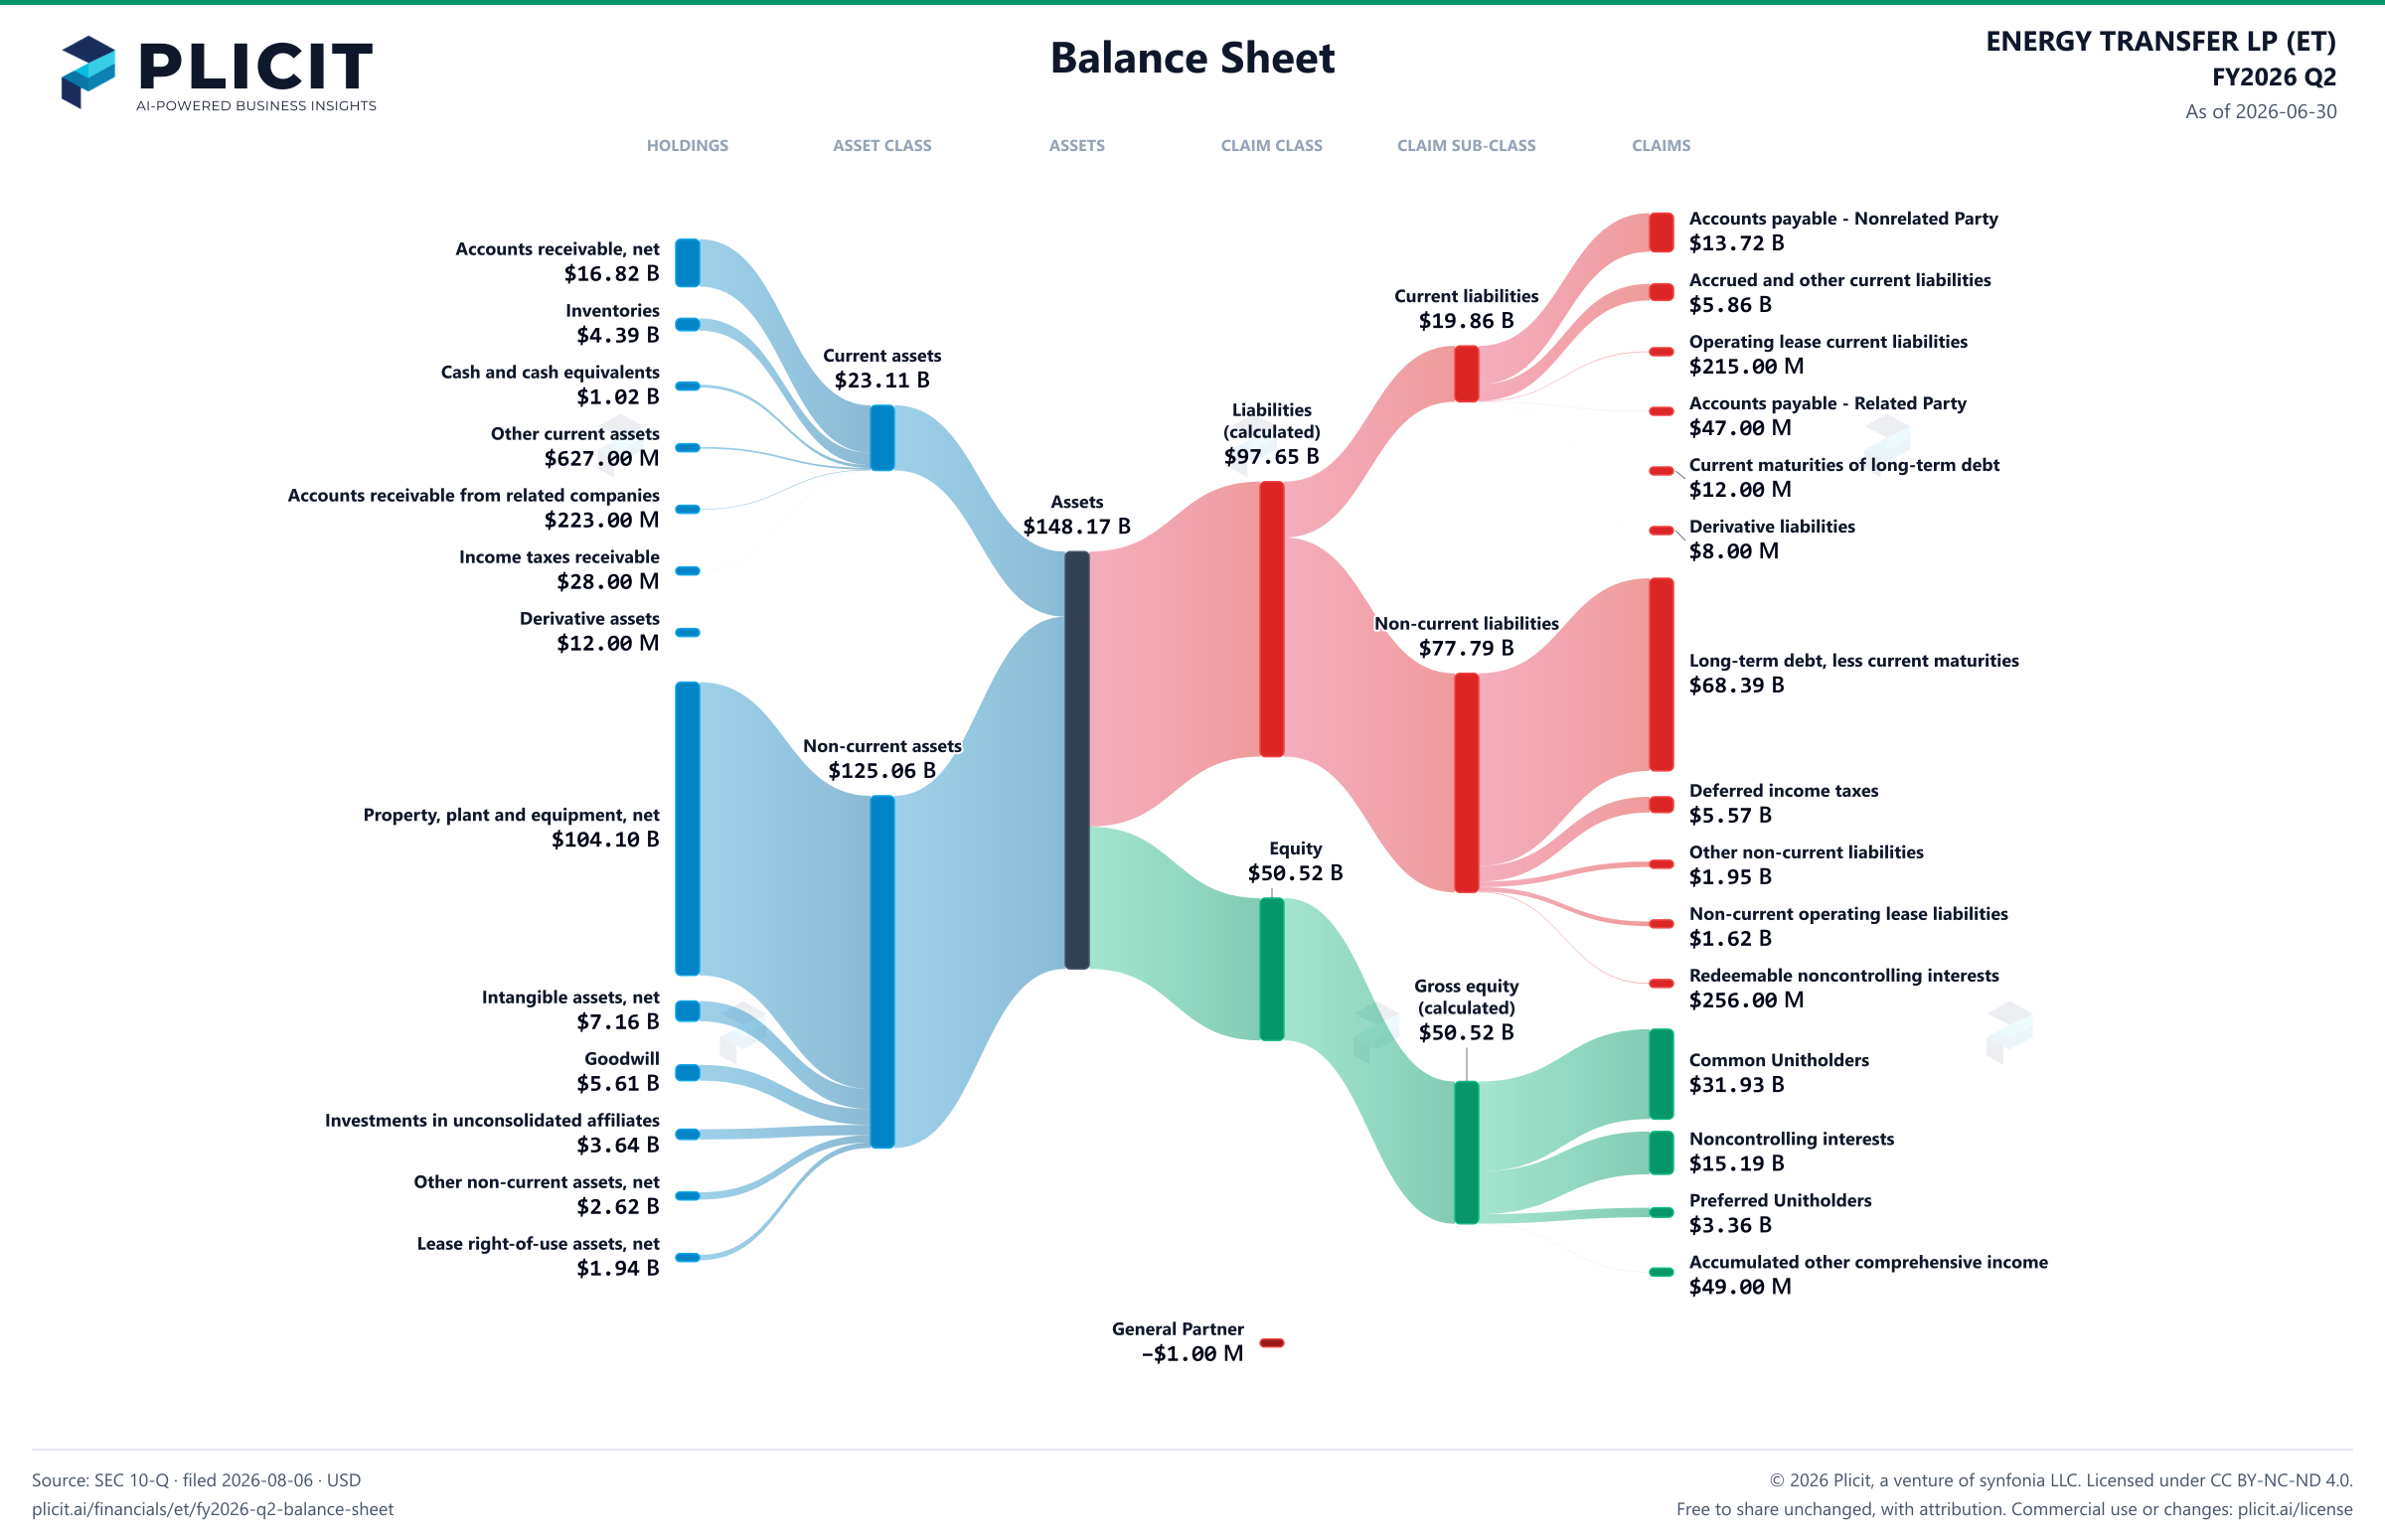
ENERGY TRANSFER LP (ET) FY2026 Q2 Balance Sheet Sankey chart
Free to share unchanged, with credit to Plicit.ai · CC BY-NC-ND 4.0Download PNG

Newsletter

Get the teardowns by email

Subscribe if you want the public-company teardowns in your inbox when they're released.

Product waitlist

Health Check and Teardown for your own company

A health check uncovers insights of your private books, not a public ticker. Join this list to get notified as soon as we go-live!