
ENERGY TRANSFER LP (ET) FY2025 Annual Balance Sheet
As of 2025-12-31
Balance Sheet
As of 2025-12-31
Swipe to see the full flow
Chart details
ENERGY TRANSFER LP (ET) FY2025 Annual Balance Sheet
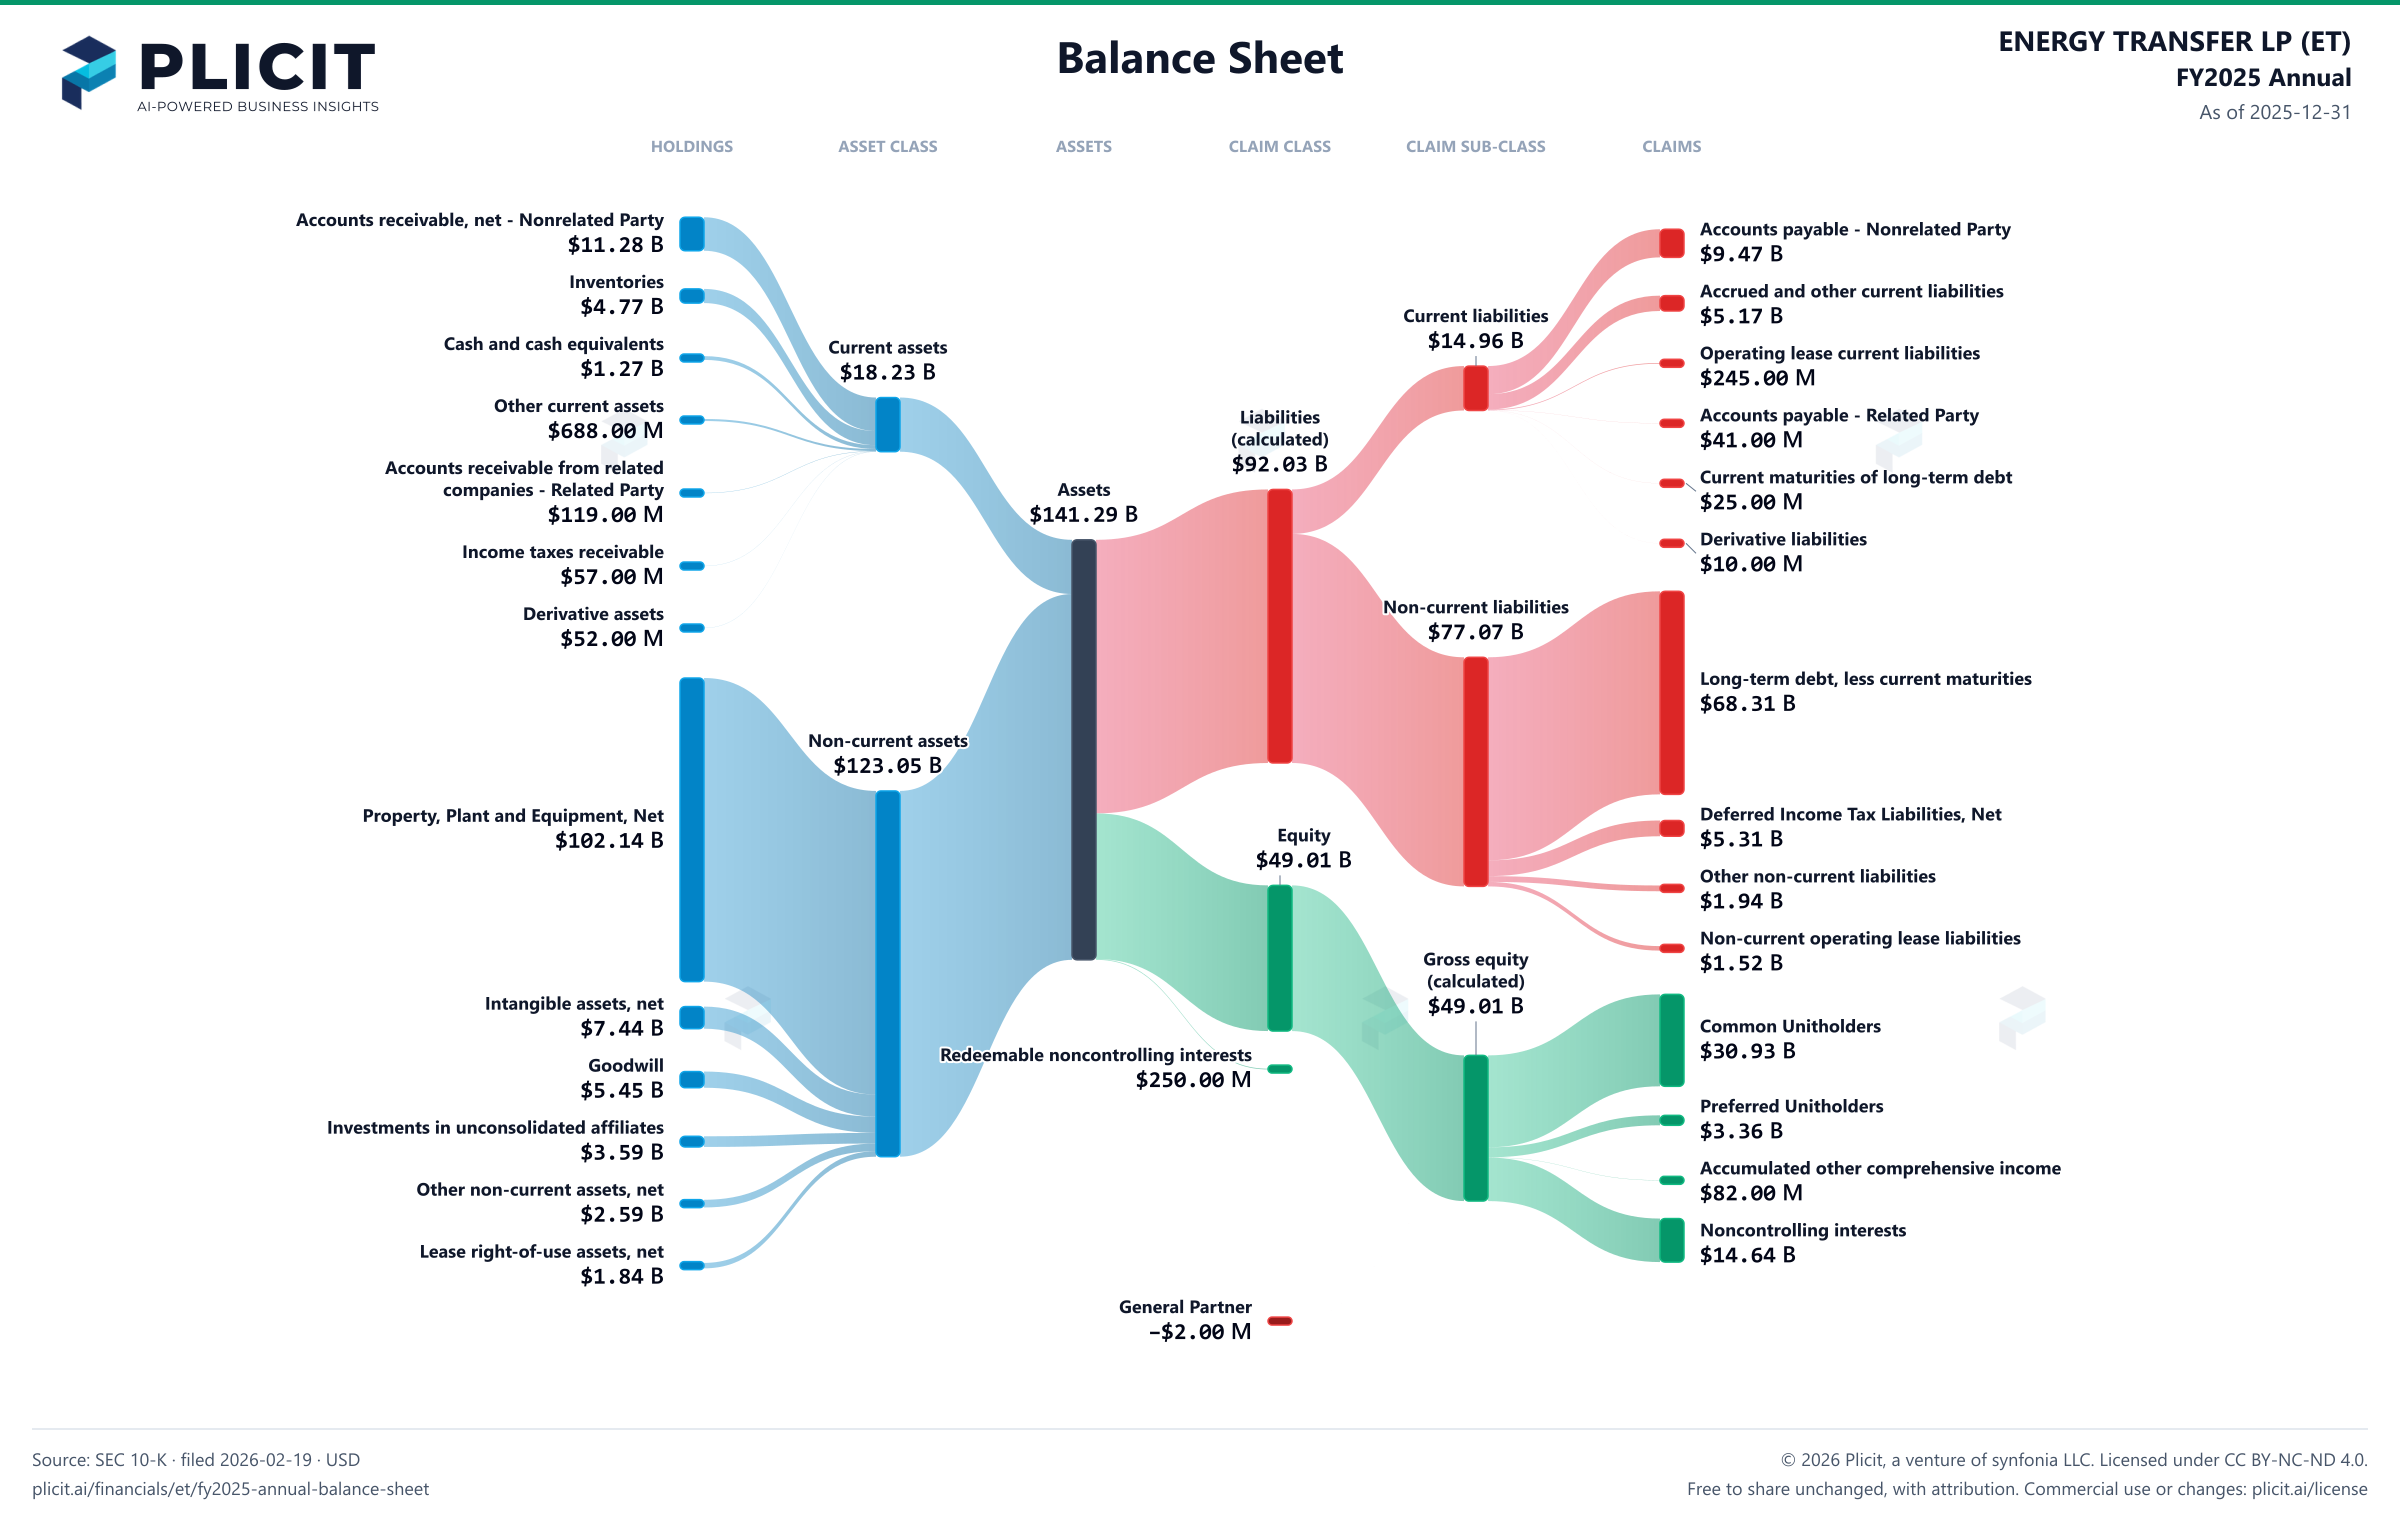
Balance sheet as of 2025-12-31. The chart shows assets, liabilities and equity at that date.
- Assets
- 141,286,000,000 US dollars
- Current assets
- 18,233,000,000 US dollars
- Non-current assets
- 123,053,000,000 US dollars
- Liabilities (calculated)
- 92,026,000,000 US dollars
- Current liabilities
- 14,955,000,000 US dollars
- Non-current liabilities
- 77,071,000,000 US dollars
- Equity
- 49,010,000,000 US dollars
- Redeemable noncontrolling interests
- 250,000,000 US dollars
- Noncontrolling interest
- 14,644,000,000 US dollars. Included in consolidated equity; this amount is not added again.
- Accumulated depreciation and depletion
- negative 39,141,000,000 US dollars. Part of Property, Plant and Equipment, Net, drawn as one net amount.
- Property, plant and equipment
- 141,283,000,000 US dollars. Part of Property, Plant and Equipment, Net, drawn as one net amount.
- Accounts receivable, net - Nonrelated Party
- 11,275,000,000 US dollars
- Inventories
- 4,770,000,000 US dollars
- Cash and cash equivalents
- 1,272,000,000 US dollars
- Other current assets
- 688,000,000 US dollars
- Accounts receivable from related companies - Related Party
- 119,000,000 US dollars
- Income taxes receivable
- 57,000,000 US dollars
- Derivative assets
- 52,000,000 US dollars
- Property, Plant and Equipment, Net
- 102,142,000,000 US dollars
- Intangible assets, net
- 7,438,000,000 US dollars
- Goodwill
- 5,452,000,000 US dollars
- Investments in unconsolidated affiliates
- 3,589,000,000 US dollars
- Other non-current assets, net
- 2,591,000,000 US dollars
- Lease right-of-use assets, net
- 1,841,000,000 US dollars
- Accounts payable - Nonrelated Party
- 9,469,000,000 US dollars
- Accrued and other current liabilities
- 5,165,000,000 US dollars
- Operating lease current liabilities
- 245,000,000 US dollars
- Accounts payable - Related Party
- 41,000,000 US dollars
- Current maturities of long-term debt
- 25,000,000 US dollars
- Derivative liabilities
- 10,000,000 US dollars
- Long-term debt, less current maturities
- 68,308,000,000 US dollars
- Deferred Income Tax Liabilities, Net
- 5,307,000,000 US dollars
- Other non-current liabilities
- 1,941,000,000 US dollars
- Non-current operating lease liabilities
- 1,515,000,000 US dollars
- Common Unitholders (3,439,986,779 and 3,431,088,022 units authorized, issued and outstanding as of December 31, 2025 and 2024, respectively)
- 30,930,000,000 US dollars
- Preferred Unitholders (44,398,959 and 44,898,959 units authorized, issued and outstanding as of December 31, 2025 and 2024, respectively)
- 3,356,000,000 US dollars
- Accumulated other comprehensive income
- 82,000,000 US dollars
- Noncontrolling interests
- 14,644,000,000 US dollars
- General Partner
- negative 2,000,000 US dollars
- Gross equity (calculated)
- 49,012,000,000 US dollars. Net equity plus the magnitudes of its negative contributions equals gross positive equity. The negative contributions enter this reconciliation as add-backs; their filed signs stay negative.
Chart connections
- Assets equal liabilities plus temporary equity plus consolidated equity. Consolidated equity includes noncontrolling interests when reported.
- Treasury shares and other negative equity contributions reduce equity.
Free to share unchanged, with credit to Plicit.ai · CC BY-NC-ND 4.0Download PNG
Product waitlist
Health Check and Teardown for your own company
A health check uncovers insights of your private books, not a public ticker. Join this list to get notified as soon as we go-live!