
FedEx Corporation (FDX) FY2024 Annual P&L / Income Statement

Revenue by Business Segment by Geography

2023-06-01 to 2024-05-31

Swipe to see the full flow
FedEx Corporation (FDX) FY2024 Annual P&L / Income StatementIncome statement for 2023-06-01 through 2024-05-31. View: Segments by Geographical. Revenue uses this breakdown; costs and expenses retain the consolidated categories.SOURCESREVENUEOPERATINGPRE-TAXNETUndisclosed (calculated)FedEx Express Segment - InternationalFedEx Ground Segment - InternationalFedEx Freight Segment - InternationalFedEx Services Segment - InternationalOther international revenue - InternationalREVENUEOPERATING INCOMETOTAL OPERATING EXPENSESSalaries and employee benefitsPurchased transportationFuelRentals and landing feesDepreciation and amortizationMaintenance and repairsBusiness optimization and realignment costsOtherGoodwill and other asset impairment chargesTOTAL OTHER INCOME (EXPENSE)INCOME BEFORE INCOME TAXESNET INCOMEPROVISION FOR INCOME TAXESTOTAL OTHER INCOME (EXPENSE)TOTAL OTHERINCOME (EXPENSE)$277.00 MINCOME BEFORE INCOME TAXESINCOME BEFOREINCOME TAXES$5.84 BREVENUEREVENUE$87.69 BOPERATING INCOMEOPERATING INCOME$5.56 BNET INCOMENET INCOME$4.33 BTOTAL OPERATING EXPENSESTOTAL OPERATINGEXPENSES$82.13 BPROVISION FOR INCOME TAXESPROVISION FORINCOME TAXES$1.51 BUndisclosed (calculated)Undisclosed (calculated)$63.53 BSalaries and employee benefitsSalaries and employee benefits$30.96 BPurchased transportationPurchased transportation$20.92 BFedEx Express Segment - InternationalFedEx ExpressSegment - International$22.29 BFuelFuel$4.71 BFedEx Ground Segment - InternationalFedEx Ground Segment - International$844.00 MRentals and landing feesRentals and landing fees$4.57 BFedEx Freight Segment - InternationalFedEx Freight Segment - International$266.00 MDepreciation and amortizationDepreciation and amortization$4.29 BFedEx Services Segment - InternationalFedEx ServicesSegment - International$1.00 MMaintenance and repairsMaintenance and repairs$3.29 BOther international revenue - InternationalOther internationalrevenue - International$760.00 MBusiness optimization and realignment costsBusiness optimizationand realignment costs$582.00 MOtherOther$12.65 BGoodwill and other asset impairment chargesGoodwill and other assetimpairment charges$157.00 M
Chart details

FedEx Corporation (FDX) FY2024 Annual P&L / Income Statement

Income statement for 2023-06-01 through 2024-05-31. View: Segments by Geographical. Revenue uses this breakdown; costs and expenses retain the consolidated categories.

REVENUE
87,693,000,000 US dollars
TOTAL OPERATING EXPENSES
82,134,000,000 US dollars
OPERATING INCOME
5,559,000,000 US dollars
TOTAL OTHER INCOME (EXPENSE)
277,000,000 US dollars
INCOME BEFORE INCOME TAXES
5,836,000,000 US dollars
PROVISION FOR INCOME TAXES
1,505,000,000 US dollars
NET INCOME
4,331,000,000 US dollars
FedEx Express Segment - International
22,291,000,000 US dollars
FedEx Freight Segment - International
266,000,000 US dollars
FedEx Ground Segment - International
844,000,000 US dollars
FedEx Services Segment - International
1,000,000 US dollars
Other international revenue - International
760,000,000 US dollars
Undisclosed (calculated)
63,531,000,000 US dollars
Salaries and employee benefits
30,961,000,000 US dollars
Purchased transportation
20,921,000,000 US dollars
Rentals and landing fees
4,571,000,000 US dollars
Depreciation and amortization
4,287,000,000 US dollars
Fuel
4,710,000,000 US dollars
Maintenance and repairs
3,291,000,000 US dollars
Business optimization and realignment costs
582,000,000 US dollars
Goodwill and other asset impairment charges
157,000,000 US dollars
Other
12,654,000,000 US dollars

Chart connections

  • Revenue minus operating expenses equals operating income.
  • Operating income plus other income or expense equals income before tax. Income before tax less income tax expense or benefit equals net income.
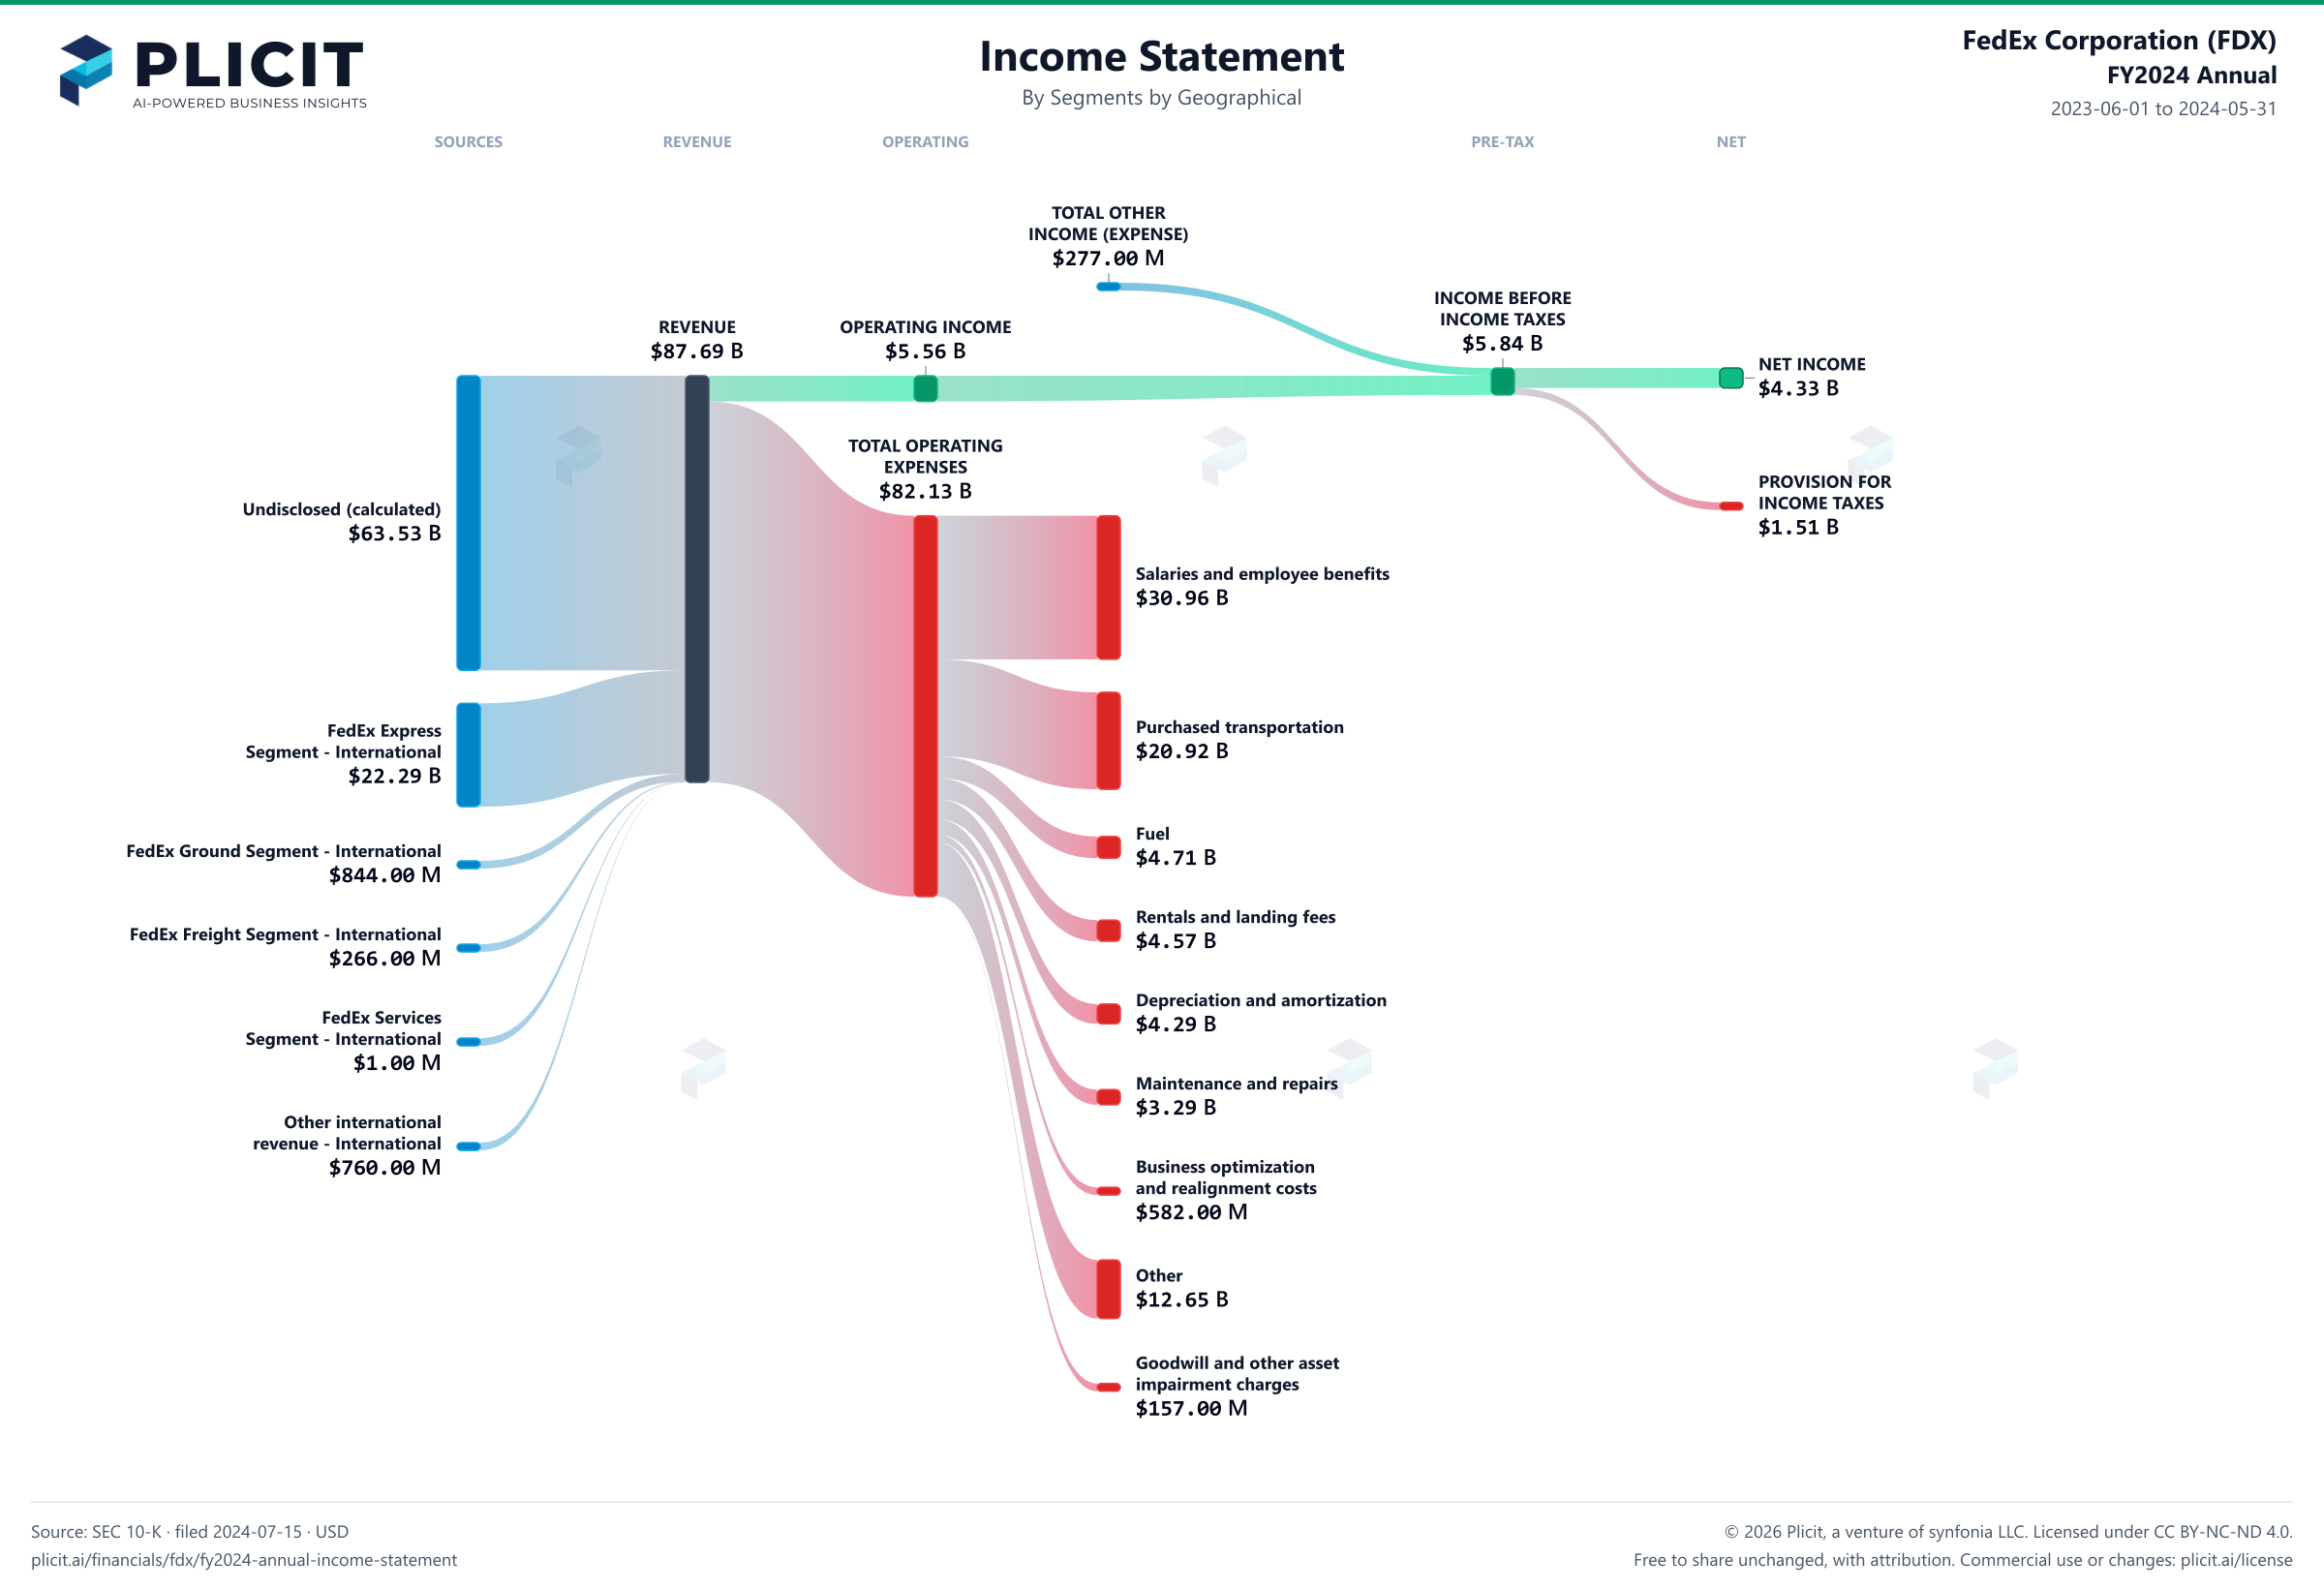
FedEx Corporation (FDX) FY2024 Annual P&L / Income Statement Sankey chart, Segments by Geographical view
Free to share unchanged, with credit to Plicit.ai · CC BY-NC-ND 4.0Download PNG

Operating margin

6.3%

Operating profit / revenue

Cash conversion

191.9%

Operating cash / net income, same period

Newsletter

Get the teardowns by email

Subscribe if you want the public-company teardowns in your inbox when they're released.

Product waitlist

Health Check and Teardown for your own company

A health check uncovers insights of your private books, not a public ticker. Join this list to get notified as soon as we go-live!