
FedEx Corporation (FDX) FY2026 Annual Balance Sheet
As of 2026-05-31
Balance Sheet
As of 2026-05-31
Swipe to see the full flow
Chart details
FedEx Corporation (FDX) FY2026 Annual Balance Sheet
Balance sheet as of 2026-05-31. The chart shows assets, liabilities and equity at that date.
- Assets
- 98,937,000,000 US dollars
- Current assets
- 27,903,000,000 US dollars
- Non-current assets
- 71,034,000,000 US dollars
- Liabilities (calculated)
- 67,290,000,000 US dollars
- Current liabilities
- 18,912,000,000 US dollars
- Non-current liabilities
- 48,378,000,000 US dollars
- Equity
- 31,647,000,000 US dollars
- Aircraft and related equipment
- 32,107,000,000 US dollars. Part of Net property and equipment, drawn as one net amount.
- Package handling and ground support equipment
- 19,816,000,000 US dollars. Part of Net property and equipment, drawn as one net amount.
- Information technology
- 9,942,000,000 US dollars. Part of Net property and equipment, drawn as one net amount.
- Vehicles and trailers
- 11,150,000,000 US dollars. Part of Net property and equipment, drawn as one net amount.
- Facilities and other
- 17,911,000,000 US dollars. Part of Net property and equipment, drawn as one net amount.
- Less accumulated depreciation and amortization
- negative 48,882,000,000 US dollars. Part of Net property and equipment, drawn as one net amount.
- Cash and cash equivalents
- 13,311,000,000 US dollars
- Receivables, less allowances of $864 and $773
- 12,672,000,000 US dollars
- Prepaid expenses and other
- 1,251,000,000 US dollars
- Spare parts, supplies, and fuel, less allowances of $324 and $308
- 669,000,000 US dollars
- Net property and equipment
- 42,044,000,000 US dollars
- Operating lease right-of-use assets, net
- 16,822,000,000 US dollars
- Goodwill
- 6,733,000,000 US dollars
- Other assets
- 5,435,000,000 US dollars
- Accrued expenses
- 5,725,000,000 US dollars
- Accounts payable
- 4,327,000,000 US dollars
- Accrued salaries and employee benefits
- 3,759,000,000 US dollars
- Operating lease liabilities
- 2,680,000,000 US dollars
- Current portion of long-term debt
- 1,676,000,000 US dollars
- Short-term borrowings
- 745,000,000 US dollars
- LONG-TERM DEBT, LESS CURRENT PORTION
- 23,293,000,000 US dollars
- Operating lease liabilities
- 14,549,000,000 US dollars
- Self-insurance accruals
- 4,413,000,000 US dollars
- Deferred income taxes
- 3,664,000,000 US dollars
- Pension, postretirement healthcare, and other benefit obligations
- 1,625,000,000 US dollars
- Other liabilities
- 834,000,000 US dollars
- Retained earnings
- 44,461,000,000 US dollars
- Additional paid-in capital
- 4,717,000,000 US dollars
- Common stock, $0.10 par value; 800 million shares authorized; 318 million shares issued as of May 31, 2026 and 2025
- 32,000,000 US dollars
- Preferred Stock, Value, Issued
- 0 US dollars
- Treasury stock, at cost; 78 million shares as of May 31, 2026 and 80 million shares as of May 31, 2025
- negative 16,336,000,000 US dollars
- Accumulated other comprehensive loss
- negative 1,227,000,000 US dollars
- Gross equity (calculated)
- 49,210,000,000 US dollars. Net equity plus the magnitudes of its negative contributions equals gross positive equity. The negative contributions enter this reconciliation as add-backs; their filed signs stay negative.
Chart connections
- Assets equal liabilities plus consolidated equity. Consolidated equity includes noncontrolling interests when reported.
- Treasury shares and other negative equity contributions reduce equity.
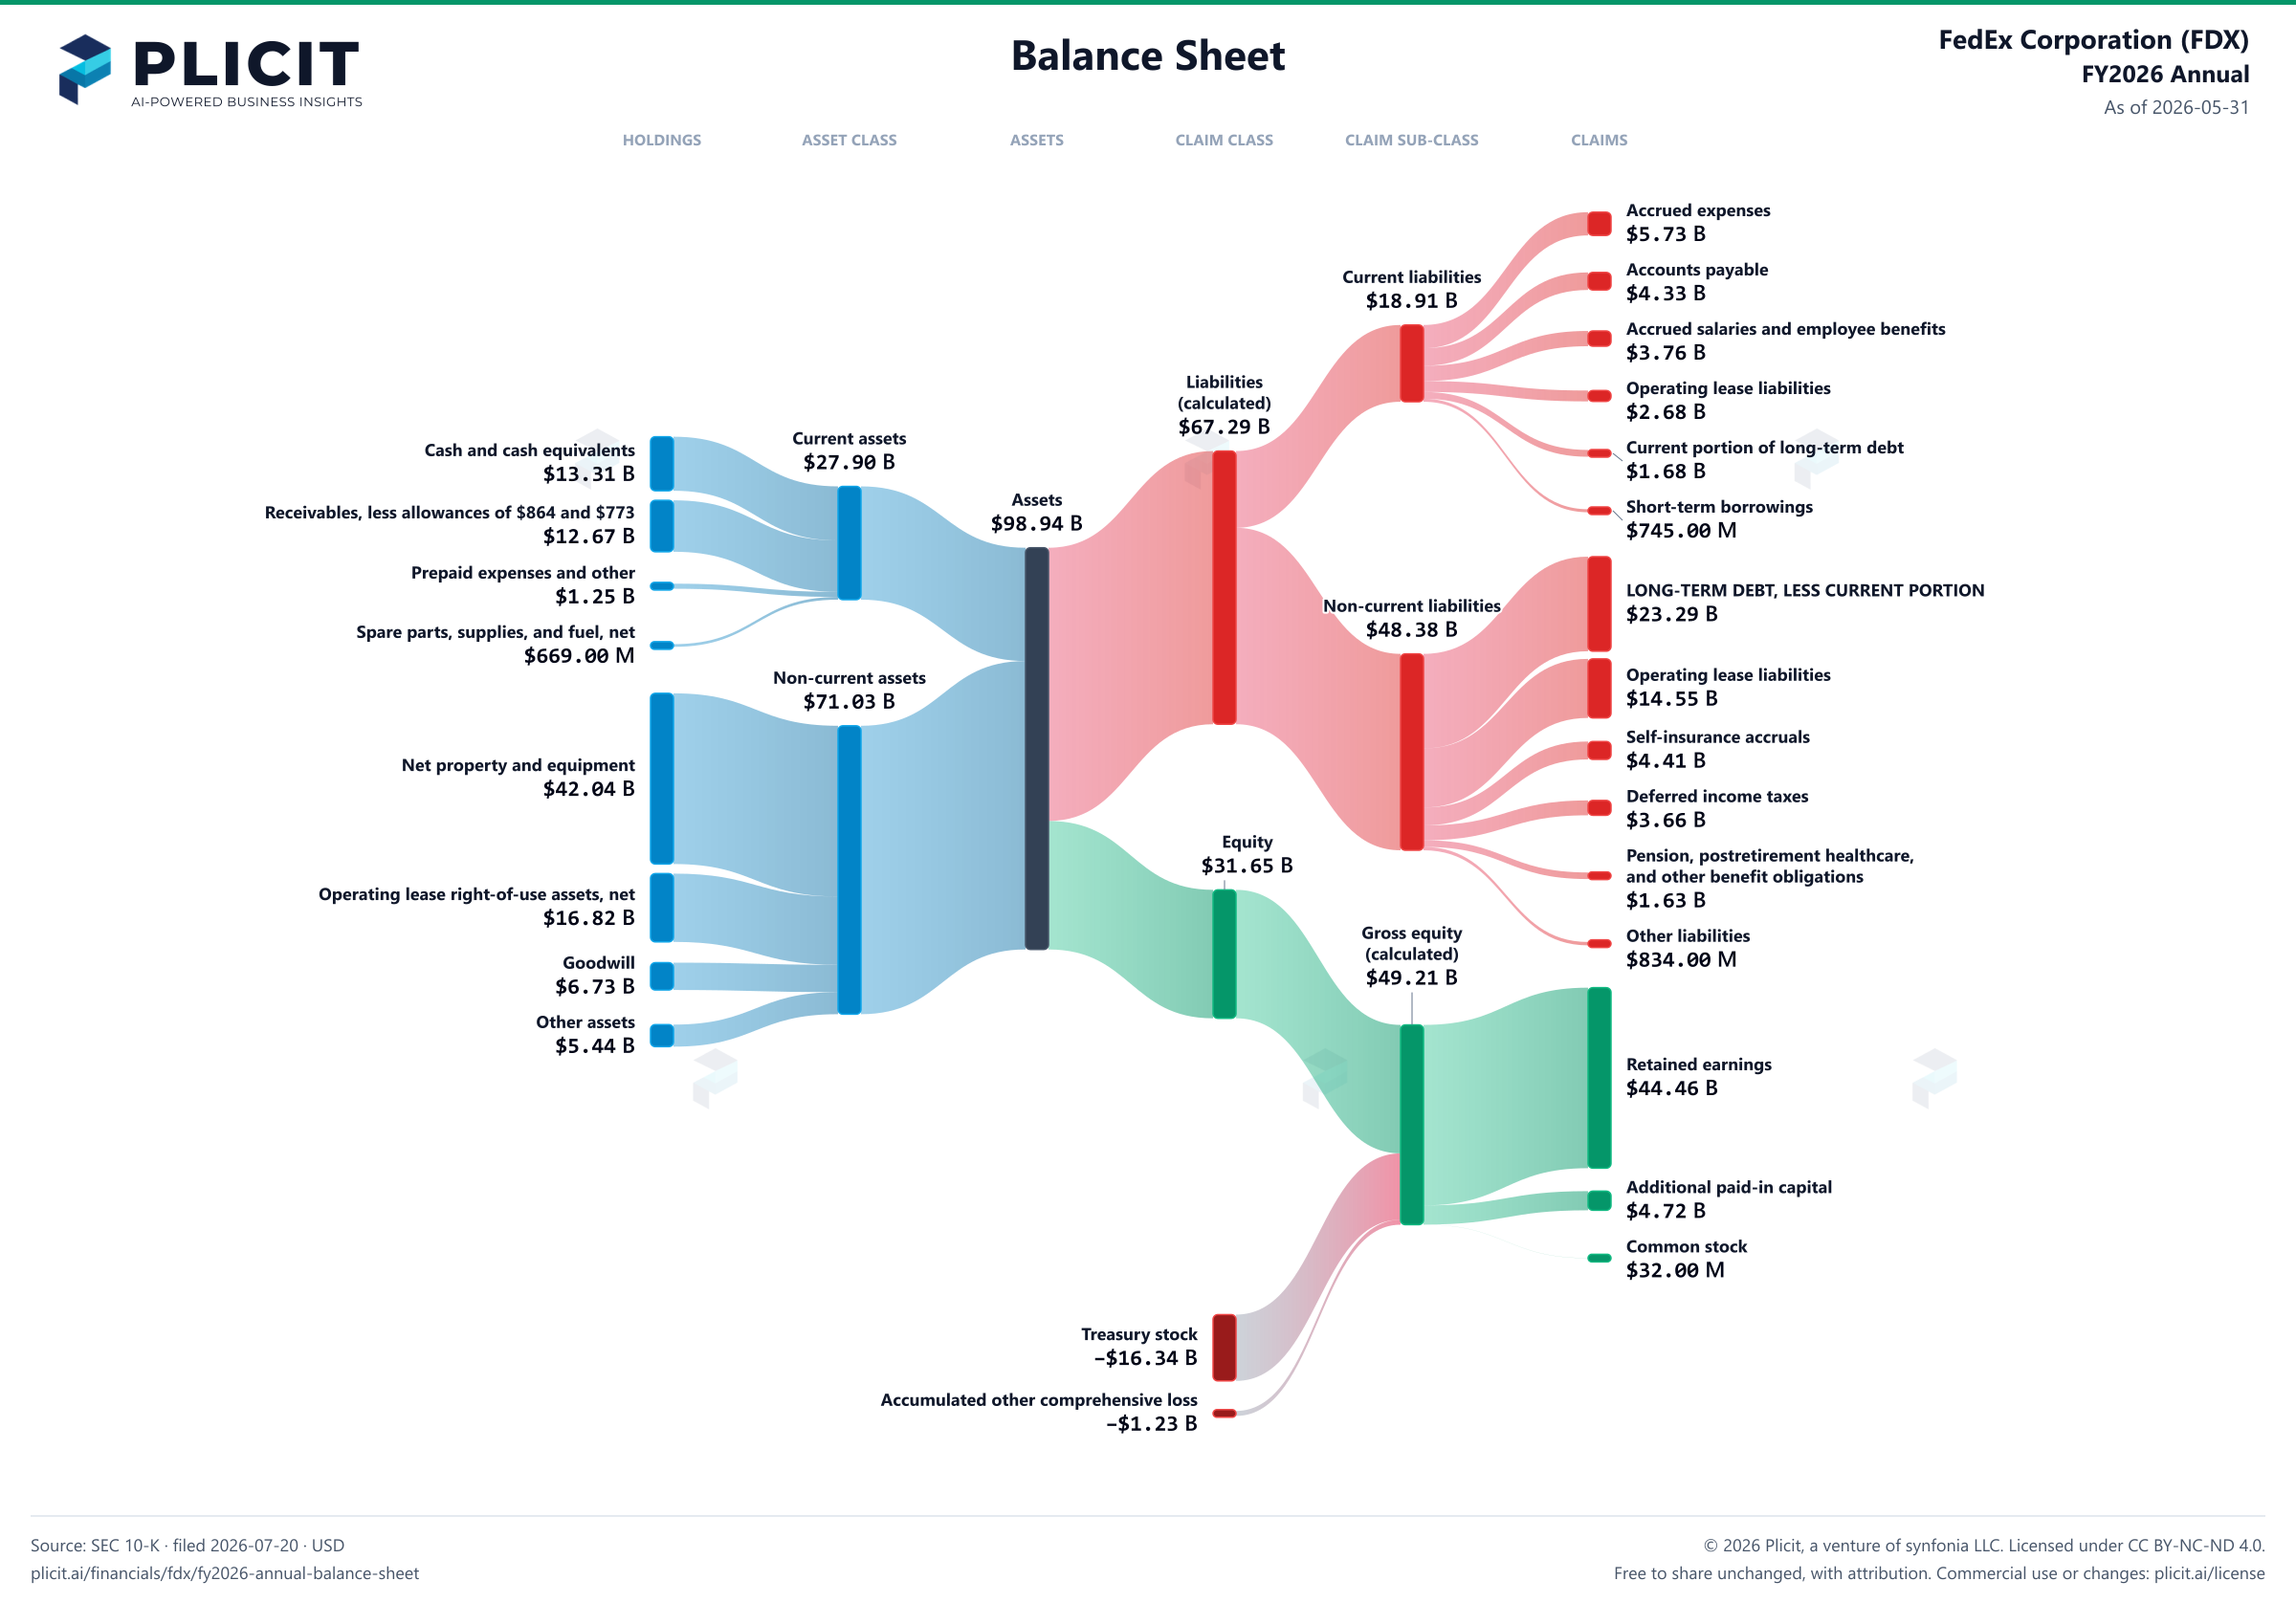
Free to share unchanged, with credit to Plicit.ai · CC BY-NC-ND 4.0Download PNG
Product waitlist
Health Check and Teardown for your own company
A health check uncovers insights of your private books, not a public ticker. Join this list to get notified as soon as we go-live!