
FedEx Corporation (FDX) FY2026 Q3 Balance Sheet

Balance Sheet

As of 2026-02-28

Swipe to see the full flow
FedEx Corporation (FDX) FY2026 Q3 Balance SheetBalance sheet as of 2026-02-28. The chart shows assets, liabilities and equity at that date.Current liabilities$17.29 BLiabilities(calculated)$64.93 BCurrent assets$25.48 BAssets$94.73 BNon-current liabilities$47.64 BNon-current assets$69.26 BEquity$29.80 BGross equity(calculated)$47.51 BHOLDINGSASSET CLASSASSETSCLAIM CLASSCLAIM SUB-CLASSCLAIMSReceivables, less allowances of $932 and $773Cash and cash equivalentsRestricted cashPrepaid expenses and otherSpare parts, supplies, and fuel, less allowances of $322 and $308Net property and equipmentOperating lease right-of-use assets, netGoodwillOther assetsAccrued expensesAccounts payableAccrued salaries and employee benefitsOperating lease liabilitiesCurrent portion of long-term debtLONG-TERM DEBT, LESS CURRENT PORTIONOperating lease liabilitiesSelf-insurance accrualsDeferred income taxesPension, postretirement healthcare, and other benefit obligationsOther liabilitiesRetained earningsAdditional paid-in capitalCommon stock, $0.10 par value; 800 million shares authorized; 318 million shares issued as of February 28, 2026 and May 31, 2025Current assetsNon-current assetsAssetsCurrent liabilitiesNon-current liabilitiesLiabilities (calculated)EquityGross equity (calculated)Treasury Stock, ValueAccumulated other comprehensive lossAccrued expensesAccrued expenses$5.01 BCurrent liabilitiesCurrent liabilities$17.29 BAccounts payableAccounts payable$4.15 BAccrued salaries and employee benefitsAccrued salaries and employee benefits$3.08 BLiabilities (calculated)Liabilities(calculated)$64.93 BOperating lease liabilitiesOperating lease liabilities$2.62 BReceivables, less allowances of $932 and $773Receivables, less allowances of $932 and $773$11.81 BCurrent assetsCurrent assets$25.48 BCurrent portion of long-term debtCurrent portion of long-term debt$2.42 BCash and cash equivalentsCash and cash equivalents$8.01 BAssetsAssets$94.73 BRestricted cashRestricted cash$3.68 BLONG-TERM DEBT, LESS CURRENT PORTIONLONG-TERM DEBT, LESS CURRENT PORTION$22.83 BNon-current liabilitiesNon-current liabilities$47.64 BPrepaid expenses and otherPrepaid expenses and other$1.35 BOperating lease liabilitiesOperating lease liabilities$14.15 BSpare parts, supplies, and fuel, less allowances of $322 and $308Spare parts, supplies, and fuel, net$631.00 MNon-current assetsNon-current assets$69.26 BSelf-insurance accrualsSelf-insurance accruals$4.32 BDeferred income taxesDeferred income taxes$3.84 BNet property and equipmentNet property and equipment$41.54 BPension, postretirement healthcare, and other benefit obligationsPension, postretirement healthcare,and other benefit obligations$1.68 BEquityEquity$29.80 BOther liabilitiesOther liabilities$823.00 MOperating lease right-of-use assets, netOperating lease right-of-use assets, net$16.39 BGross equity (calculated)Gross equity(calculated)$47.51 BGoodwillGoodwill$6.76 BRetained earningsRetained earnings$42.86 BOther assetsOther assets$4.57 BAdditional paid-in capitalAdditional paid-in capital$4.61 BCommon stock, $0.10 par value; 800 million shares authorized; 318 million shares issued as of February 28, 2026 and May 31, 2025Common stock$32.00 MTreasury Stock, ValueTreasury Stock, Value−$16.49 BAccumulated other comprehensive lossAccumulated other comprehensive loss−$1.22 B
Chart details

FedEx Corporation (FDX) FY2026 Q3 Balance Sheet

Balance sheet as of 2026-02-28. The chart shows assets, liabilities and equity at that date.

Assets
94,733,000,000 US dollars
Current assets
25,477,000,000 US dollars
Non-current assets
69,256,000,000 US dollars
Liabilities (calculated)
64,929,000,000 US dollars
Current liabilities
17,287,000,000 US dollars
Non-current liabilities
47,642,000,000 US dollars
Equity
29,804,000,000 US dollars
PROPERTY AND EQUIPMENT, AT COST
90,106,000,000 US dollars. Part of Net property and equipment, drawn as one net amount.
Less accumulated depreciation and amortization
negative 48,567,000,000 US dollars. Part of Net property and equipment, drawn as one net amount.
Receivables, less allowances of $932 and $773
11,807,000,000 US dollars
Cash and cash equivalents
8,008,000,000 US dollars
Restricted cash
3,680,000,000 US dollars
Prepaid expenses and other
1,351,000,000 US dollars
Spare parts, supplies, and fuel, less allowances of $322 and $308
631,000,000 US dollars
Net property and equipment
41,539,000,000 US dollars
Operating lease right-of-use assets, net
16,391,000,000 US dollars
Goodwill
6,758,000,000 US dollars
Other assets
4,568,000,000 US dollars
Accrued expenses
5,008,000,000 US dollars
Accounts payable
4,154,000,000 US dollars
Accrued salaries and employee benefits
3,079,000,000 US dollars
Operating lease liabilities
2,624,000,000 US dollars
Current portion of long-term debt
2,422,000,000 US dollars
LONG-TERM DEBT, LESS CURRENT PORTION
22,831,000,000 US dollars
Operating lease liabilities
14,145,000,000 US dollars
Self-insurance accruals
4,320,000,000 US dollars
Deferred income taxes
3,841,000,000 US dollars
Pension, postretirement healthcare, and other benefit obligations
1,682,000,000 US dollars
Other liabilities
823,000,000 US dollars
Retained earnings
42,864,000,000 US dollars
Additional paid-in capital
4,614,000,000 US dollars
Common stock, $0.10 par value; 800 million shares authorized; 318 million shares issued as of February 28, 2026 and May 31, 2025
32,000,000 US dollars
Treasury Stock, Value
negative 16,486,000,000 US dollars
Accumulated other comprehensive loss
negative 1,220,000,000 US dollars
Gross equity (calculated)
47,510,000,000 US dollars. Net equity plus the magnitudes of its negative contributions equals gross positive equity. The negative contributions enter this reconciliation as add-backs; their filed signs stay negative.

Chart connections

  • Assets equal liabilities plus consolidated equity. Consolidated equity includes noncontrolling interests when reported.
  • Treasury shares and other negative equity contributions reduce equity.
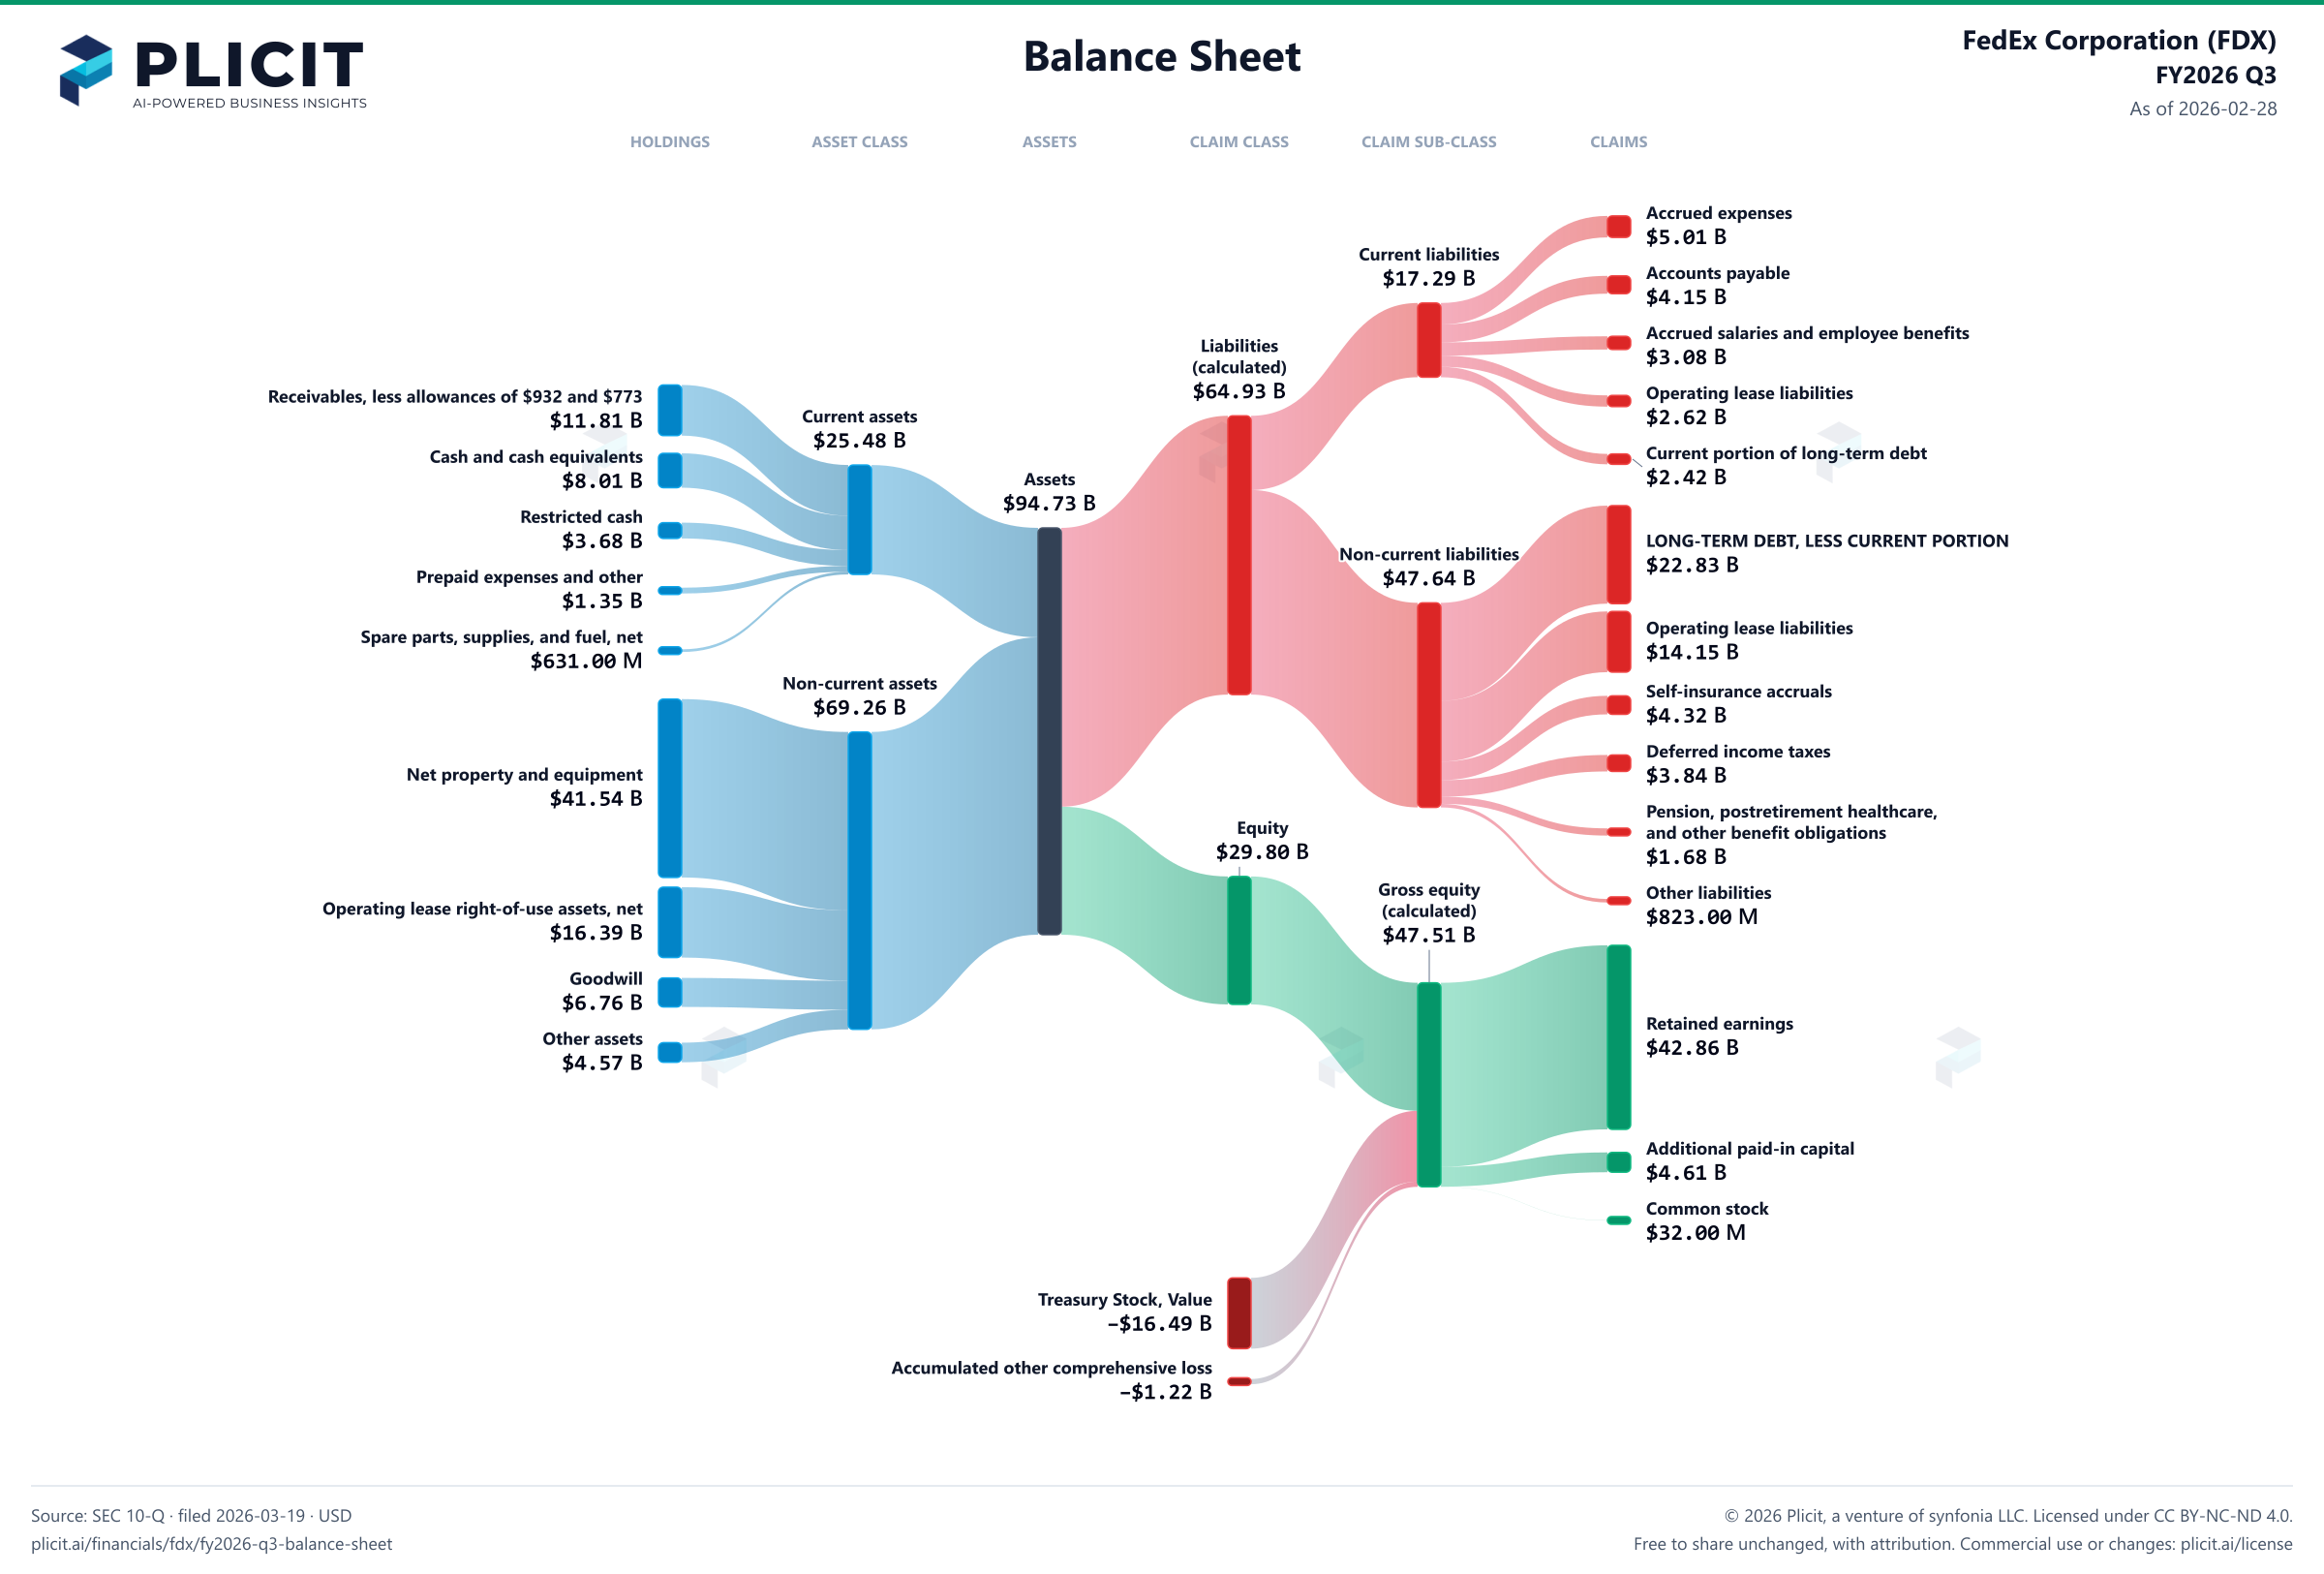
FedEx Corporation (FDX) FY2026 Q3 Balance Sheet Sankey chart
Free to share unchanged, with credit to Plicit.ai · CC BY-NC-ND 4.0Download PNG

Newsletter

Get the teardowns by email

Subscribe if you want the public-company teardowns in your inbox when they're released.

Product waitlist

Health Check and Teardown for your own company

A health check uncovers insights of your private books, not a public ticker. Join this list to get notified as soon as we go-live!