
GREIF, INC. (GEF) FY2026 Q3 Balance Sheet
As of 2026-06-30
Balance Sheet
As of 2026-06-30
Swipe to see the full flow
Chart details
GREIF, INC. (GEF) FY2026 Q3 Balance Sheet
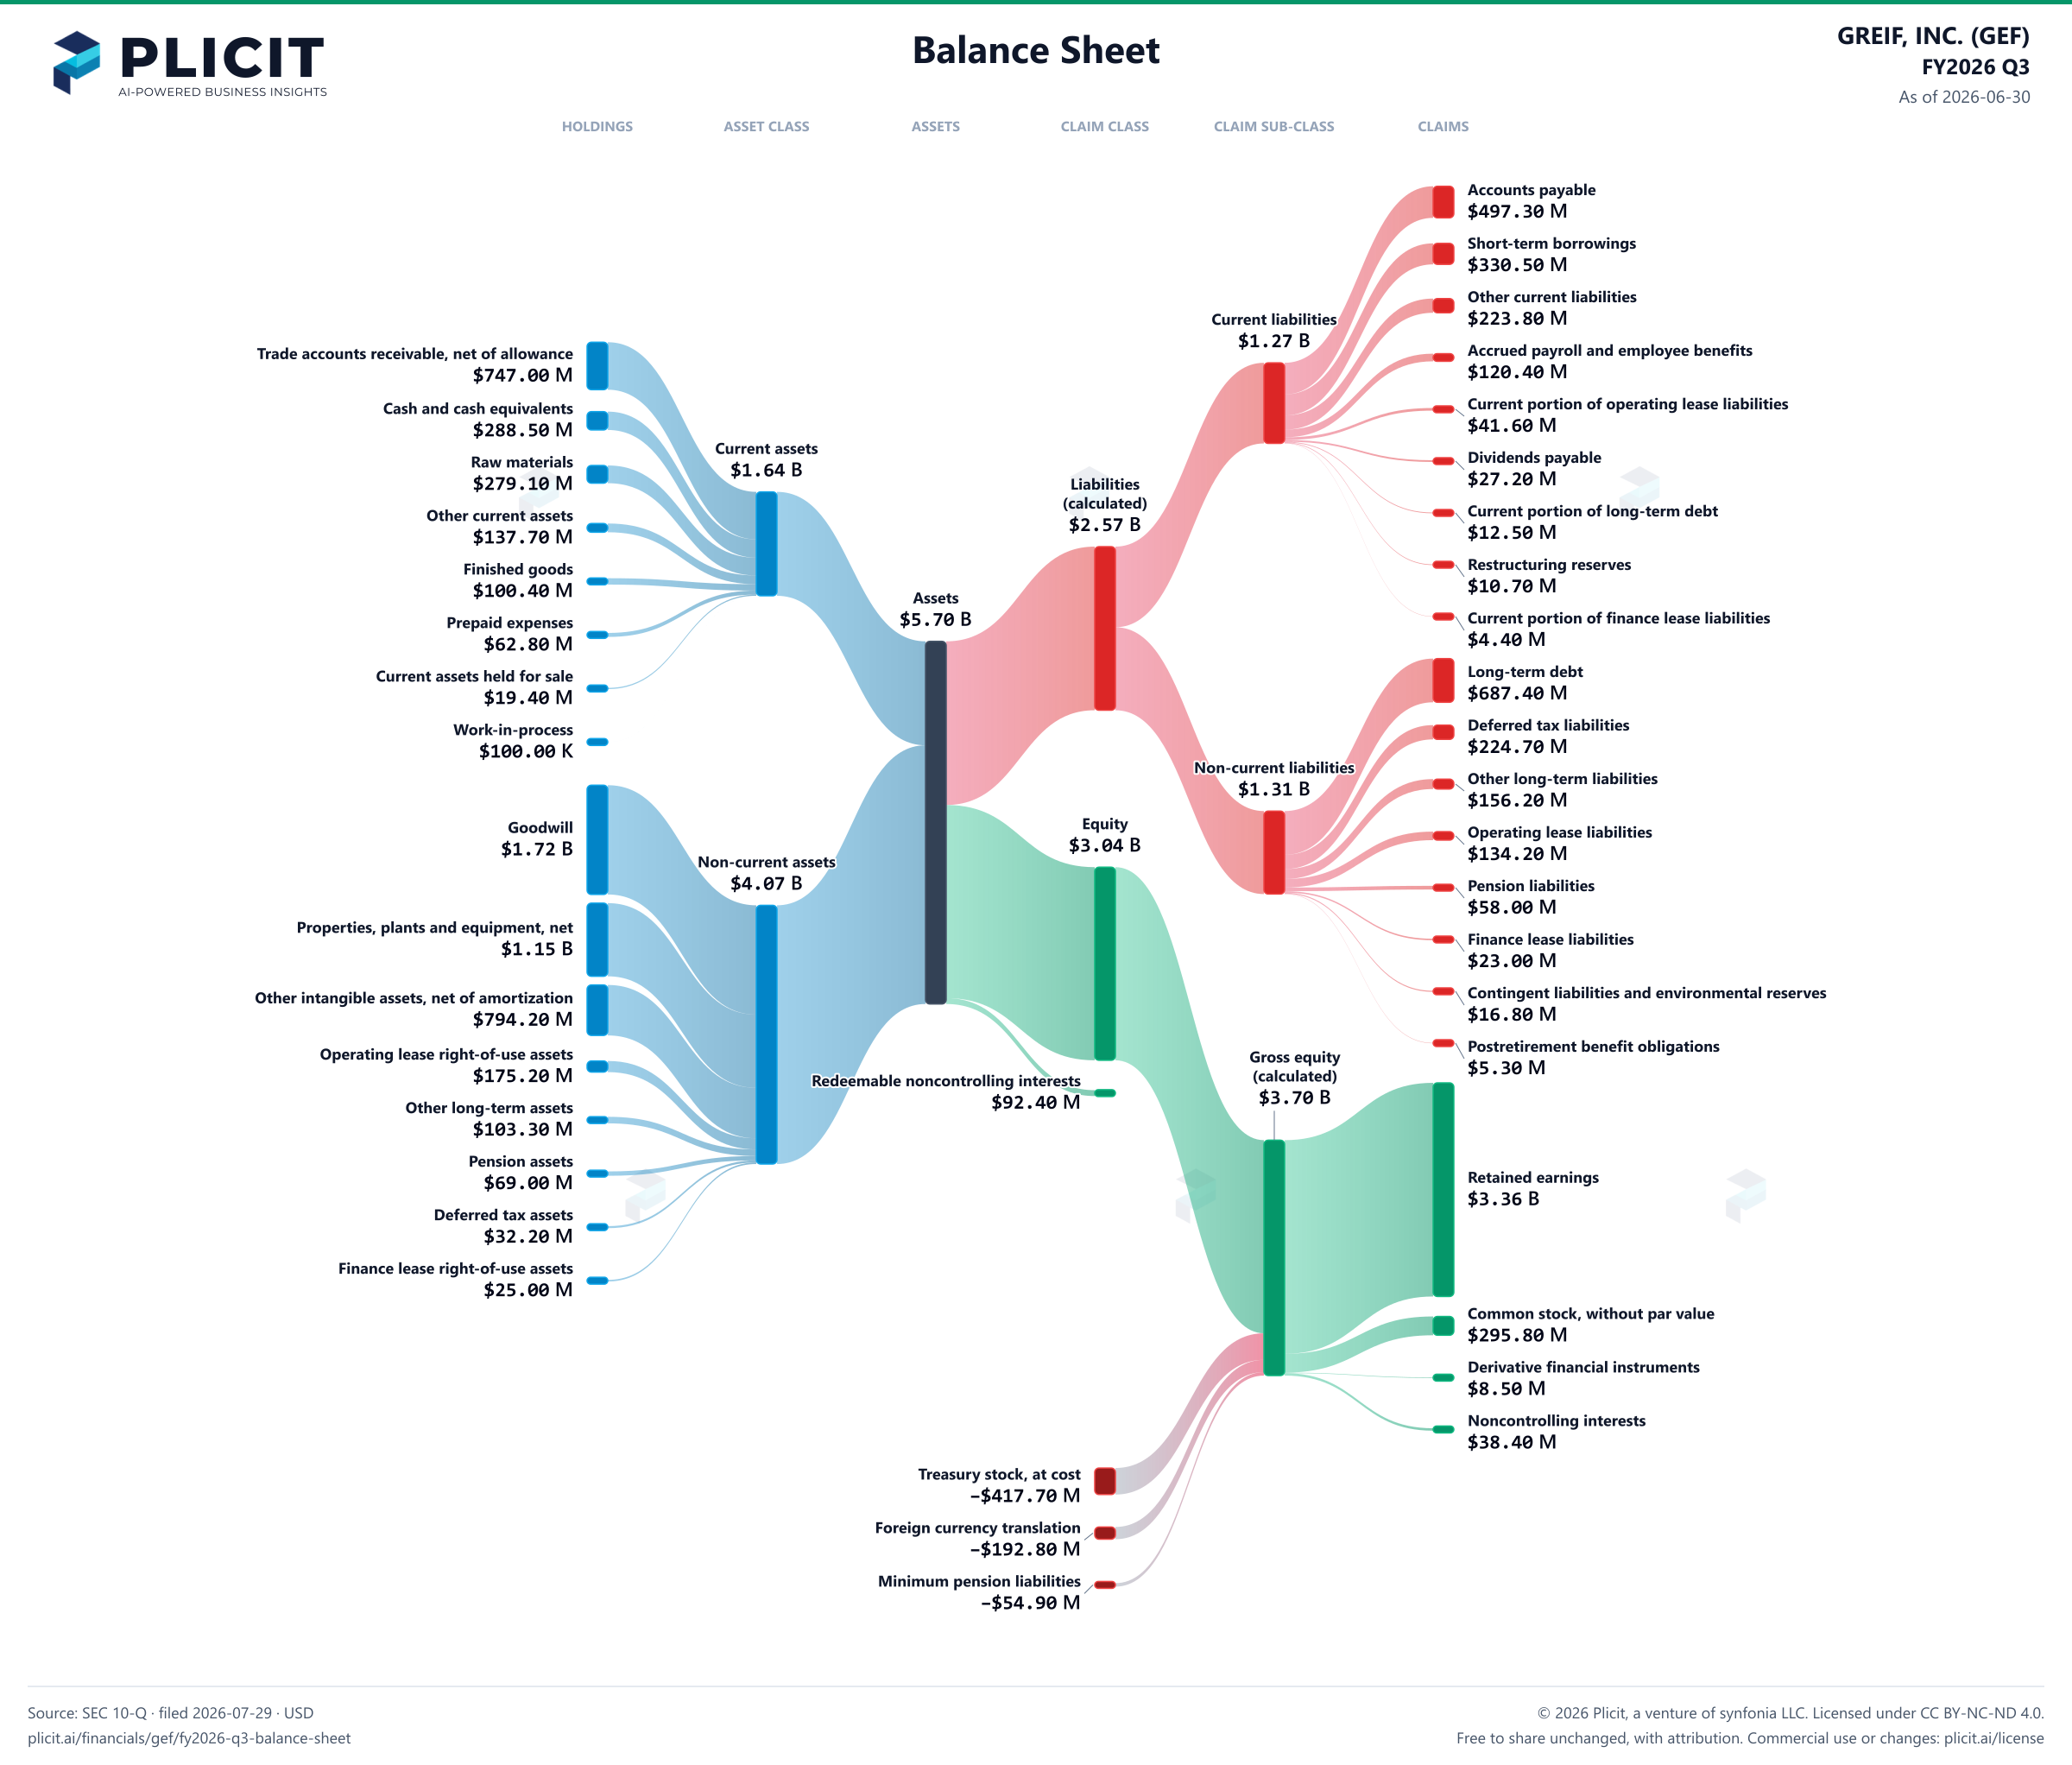
Balance sheet as of 2026-06-30. The chart shows assets, liabilities and equity at that date.
- Assets
- 5,704,200,000 US dollars
- Current assets
- 1,635,000,000 US dollars
- Non-current assets
- 4,069,200,000 US dollars
- Liabilities (calculated)
- 2,574,000,000 US dollars
- Current liabilities
- 1,268,400,000 US dollars
- Non-current liabilities
- 1,305,600,000 US dollars
- Equity
- 3,037,800,000 US dollars
- Redeemable noncontrolling interests
- 92,400,000 US dollars
- Noncontrolling interest
- 38,400,000 US dollars. Included in consolidated equity; this amount is not added again.
- Land
- 121,000,000 US dollars. Part of Properties, plants and equipment, net, drawn as one net amount.
- Buildings
- 511,300,000 US dollars. Part of Properties, plants and equipment, net, drawn as one net amount.
- Machinery and equipment
- 1,805,100,000 US dollars. Part of Properties, plants and equipment, net, drawn as one net amount.
- Capital projects in progress
- 182,200,000 US dollars. Part of Properties, plants and equipment, net, drawn as one net amount.
- Accumulated depreciation
- negative 1,468,300,000 US dollars. Part of Properties, plants and equipment, net, drawn as one net amount.
- Trade accounts receivable, net of allowance
- 747,000,000 US dollars
- Cash and cash equivalents
- 288,500,000 US dollars
- Raw materials
- 279,100,000 US dollars
- Other current assets
- 137,700,000 US dollars
- Finished goods
- 100,400,000 US dollars
- Prepaid expenses
- 62,800,000 US dollars
- Current assets held for sale
- 19,400,000 US dollars
- Work-in-process
- 100,000 US dollars
- Goodwill
- 1,719,000,000 US dollars
- Properties, plants and equipment, net
- 1,151,300,000 US dollars
- Other intangible assets, net of amortization
- 794,200,000 US dollars
- Operating lease right-of-use assets
- 175,200,000 US dollars
- Other long-term assets
- 103,300,000 US dollars
- Pension assets
- 69,000,000 US dollars
- Deferred tax assets
- 32,200,000 US dollars
- Finance lease right-of-use assets
- 25,000,000 US dollars
- Noncurrent assets held for sale
- 0 US dollars
- Accounts payable
- 497,300,000 US dollars
- Short-term borrowings
- 330,500,000 US dollars
- Other current liabilities
- 223,800,000 US dollars
- Accrued payroll and employee benefits
- 120,400,000 US dollars
- Current portion of operating lease liabilities
- 41,600,000 US dollars
- Dividends payable
- 27,200,000 US dollars
- Current portion of long-term debt
- 12,500,000 US dollars
- Restructuring reserves
- 10,700,000 US dollars
- Current portion of finance lease liabilities
- 4,400,000 US dollars
- Current liabilities held for sale
- 0 US dollars
- Long-term debt
- 687,400,000 US dollars
- Deferred tax liabilities
- 224,700,000 US dollars
- Other long-term liabilities
- 156,200,000 US dollars
- Operating lease liabilities
- 134,200,000 US dollars
- Pension liabilities
- 58,000,000 US dollars
- Finance lease liabilities
- 23,000,000 US dollars
- Contingent liabilities and environmental reserves
- 16,800,000 US dollars
- Postretirement benefit obligations
- 5,300,000 US dollars
- Retained earnings
- 3,360,500,000 US dollars
- Common stock, without par value
- 295,800,000 US dollars
- Derivative financial instruments
- 8,500,000 US dollars
- Noncontrolling interests
- 38,400,000 US dollars
- Treasury stock, at cost
- negative 417,700,000 US dollars
- Foreign currency translation
- negative 192,800,000 US dollars
- Minimum pension liabilities
- negative 54,900,000 US dollars
- Gross equity (calculated)
- 3,703,200,000 US dollars. Net equity plus the magnitudes of its negative contributions equals gross positive equity. The negative contributions enter this reconciliation as add-backs; their filed signs stay negative.
Chart connections
- Assets equal liabilities plus temporary equity plus consolidated equity. Consolidated equity includes noncontrolling interests when reported.
- Treasury shares and other negative equity contributions reduce equity.
Free to share unchanged, with credit to Plicit.ai · CC BY-NC-ND 4.0Download PNG
Product waitlist
Health Check and Teardown for your own company
A health check uncovers insights of your private books, not a public ticker. Join this list to get notified as soon as we go-live!