
GREIF, INC. (GEF) FY2026 Q3 P&L / Income Statement

Revenue by Business Segment by Geography

2026-04-01 to 2026-06-30

Swipe to see the full flow
GREIF, INC. (GEF) FY2026 Q3 P&L / Income StatementIncome statement for 2026-04-01 through 2026-06-30. View: Segments by Geographical. Revenue uses this breakdown; costs and expenses retain the consolidated categories.SOURCESREVENUEGROSSOPERATINGPRE-TAXNETSustainable Fiber Solutions - UNITED STATESDurable Metal Solutions - Europe, Middle East and AfricaCustomized Polymer Solutions - Europe, Middle East and AfricaCustomized Polymer Solutions - UNITED STATESDurable Metal Solutions - Asia Pacific and Other AmericasDurable Metal Solutions - UNITED STATESCustomized Polymer Solutions - Asia Pacific and Other AmericasSustainable Fiber Solutions - Asia Pacific and Other AmericasInnovative Closure Solutions - Europe, Middle East and AfricaInnovative Closure Solutions - Asia Pacific and Other AmericasInnovative Closure Solutions - UNITED STATESSustainable Fiber Solutions - Europe, Middle East and AfricaNet salesGross profitCost of products soldOperating profitOperating costs, including other operating expenses (calculated)Selling, general and administrative expensesAcquisition and integration related costsNon-cash asset impairment chargesLoss (gain) on disposal of properties, plants and equipment, netRestructuring and other chargesIncome from continuing operations before income tax expense and equity earnings of unconsolidated affiliates, netOther income (expense), net (calculated)Net incomeIncome tax expenseNet income (loss) from discontinued operations, net of taxEquity earnings of unconsolidated affiliates, net of taxEquity earnings of unconsolidated affiliates, net of taxEquity earningsof unconsolidatedaffiliates, net of tax$600.00 KNet salesNet sales$1.17 BGross profitGross profit$272.60 MOperating profitOperating profit$107.90 MIncome from continuing operations before income tax expense and equity earnings of unconsolidated affiliates, netPretax income$99.90 MNet incomeNet income$81.60 MSustainable Fiber Solutions - UNITED STATESSustainable FiberSolutions - UNITED STATES$333.40 MOperating costs, including other operating expenses (calculated)Operating costs(calculated)$164.70 MIncome tax expenseIncome tax expense$17.90 MCost of products soldCost of products sold$893.00 MSelling, general and administrative expensesSelling, general andadministrative expenses$149.50 MDurable Metal Solutions - Europe, Middle East and AfricaDurable Metal Solutions -Europe, Middle East and Africa$238.50 MOther income (expense), net (calculated)Other income,net (calculated)−$8.00 MAcquisition and integration related costsAcquisition andintegration related costs$1.50 MCustomized Polymer Solutions - Europe, Middle East and AfricaCustomized Polymer Solutions -Europe, Middle East and Africa$160.40 MNet income (loss) from discontinued operations, net of taxNet income (loss)from discontinuedoperations, net of tax−$1.00 MNon-cash asset impairment chargesNon-cash assetimpairment charges$1.40 MCustomized Polymer Solutions - UNITED STATESCustomized PolymerSolutions - UNITED STATES$160.20 MLoss (gain) on disposal of properties, plants and equipment, netLoss (gain) on disposalof properties, plantsand equipment, net$200.00 KDurable Metal Solutions - Asia Pacific and Other AmericasDurable Metal Solutions - AsiaPacific and Other Americas$94.30 MDurable Metal Solutions - UNITED STATESDurable Metal Solutions- UNITED STATES$72.80 MRestructuring and other chargesRestructuring and other charges$12.10 MCustomized Polymer Solutions - Asia Pacific and Other AmericasCustomized Polymer Solutions -Asia Pacific and Other Americas$63.20 MSustainable Fiber Solutions - Asia Pacific and Other AmericasSustainable Fiber Solutions -Asia Pacific and Other Americas$12.80 MInnovative Closure Solutions - Europe, Middle East and AfricaInnovative Closure Solutions -Europe, Middle East and Africa$12.30 MInnovative Closure Solutions - Asia Pacific and Other AmericasInnovative Closure Solutions -Asia Pacific and Other Americas$9.20 MInnovative Closure Solutions - UNITED STATESInnovative ClosureSolutions - UNITED STATES$8.20 MSustainable Fiber Solutions - Europe, Middle East and AfricaSustainable Fiber Solutions -Europe, Middle East and Africa$300.00 K
Chart details

GREIF, INC. (GEF) FY2026 Q3 P&L / Income Statement

Income statement for 2026-04-01 through 2026-06-30. View: Segments by Geographical. Revenue uses this breakdown; costs and expenses retain the consolidated categories.

Net sales
1,165,600,000 US dollars
Cost of products sold
893,000,000 US dollars
Gross profit
272,600,000 US dollars
Operating costs, including other operating expenses (calculated)
164,700,000 US dollars
Operating profit
107,900,000 US dollars
Other income (expense), net (calculated)
negative 8,000,000 US dollars
Income from continuing operations before income tax expense and equity earnings of unconsolidated affiliates, net
99,900,000 US dollars
Income tax expense
17,900,000 US dollars
Net income
81,600,000 US dollars
Customized Polymer Solutions - UNITED STATES
160,200,000 US dollars
Customized Polymer Solutions - Asia Pacific and Other Americas
63,200,000 US dollars
Customized Polymer Solutions - Europe, Middle East and Africa
160,400,000 US dollars
Durable Metal Solutions - UNITED STATES
72,800,000 US dollars
Durable Metal Solutions - Asia Pacific and Other Americas
94,300,000 US dollars
Durable Metal Solutions - Europe, Middle East and Africa
238,500,000 US dollars
Innovative Closure Solutions - UNITED STATES
8,200,000 US dollars
Innovative Closure Solutions - Asia Pacific and Other Americas
9,200,000 US dollars
Innovative Closure Solutions - Europe, Middle East and Africa
12,300,000 US dollars
Sustainable Fiber Solutions - UNITED STATES
333,400,000 US dollars
Sustainable Fiber Solutions - Asia Pacific and Other Americas
12,800,000 US dollars
Sustainable Fiber Solutions - Europe, Middle East and Africa
300,000 US dollars
Selling, general and administrative expenses
149,500,000 US dollars
Acquisition and integration related costs
1,500,000 US dollars
Restructuring and other charges
12,100,000 US dollars
Non-cash asset impairment charges
1,400,000 US dollars
Loss (gain) on disposal of properties, plants and equipment, net
200,000 US dollars
Loss on disposal of businesses, net
0 US dollars
Equity earnings of unconsolidated affiliates, net of tax
600,000 US dollars. Reported below-tax contribution to net income.
Net income (loss) from discontinued operations, net of tax
negative 1,000,000 US dollars. Reported below-tax contribution to net income.

Chart connections

  • Revenue less cost of revenue equals gross profit; gross profit less operating expenses equals operating income.
  • Operating income plus other income or expense equals income before tax. Income before tax less income tax expense or benefit, plus the explicitly reported below-tax contributions, equals net income.
  • Of which attributable to GREIF, INC.: $77.80 M; to noncontrolling interests: $3.80 M.
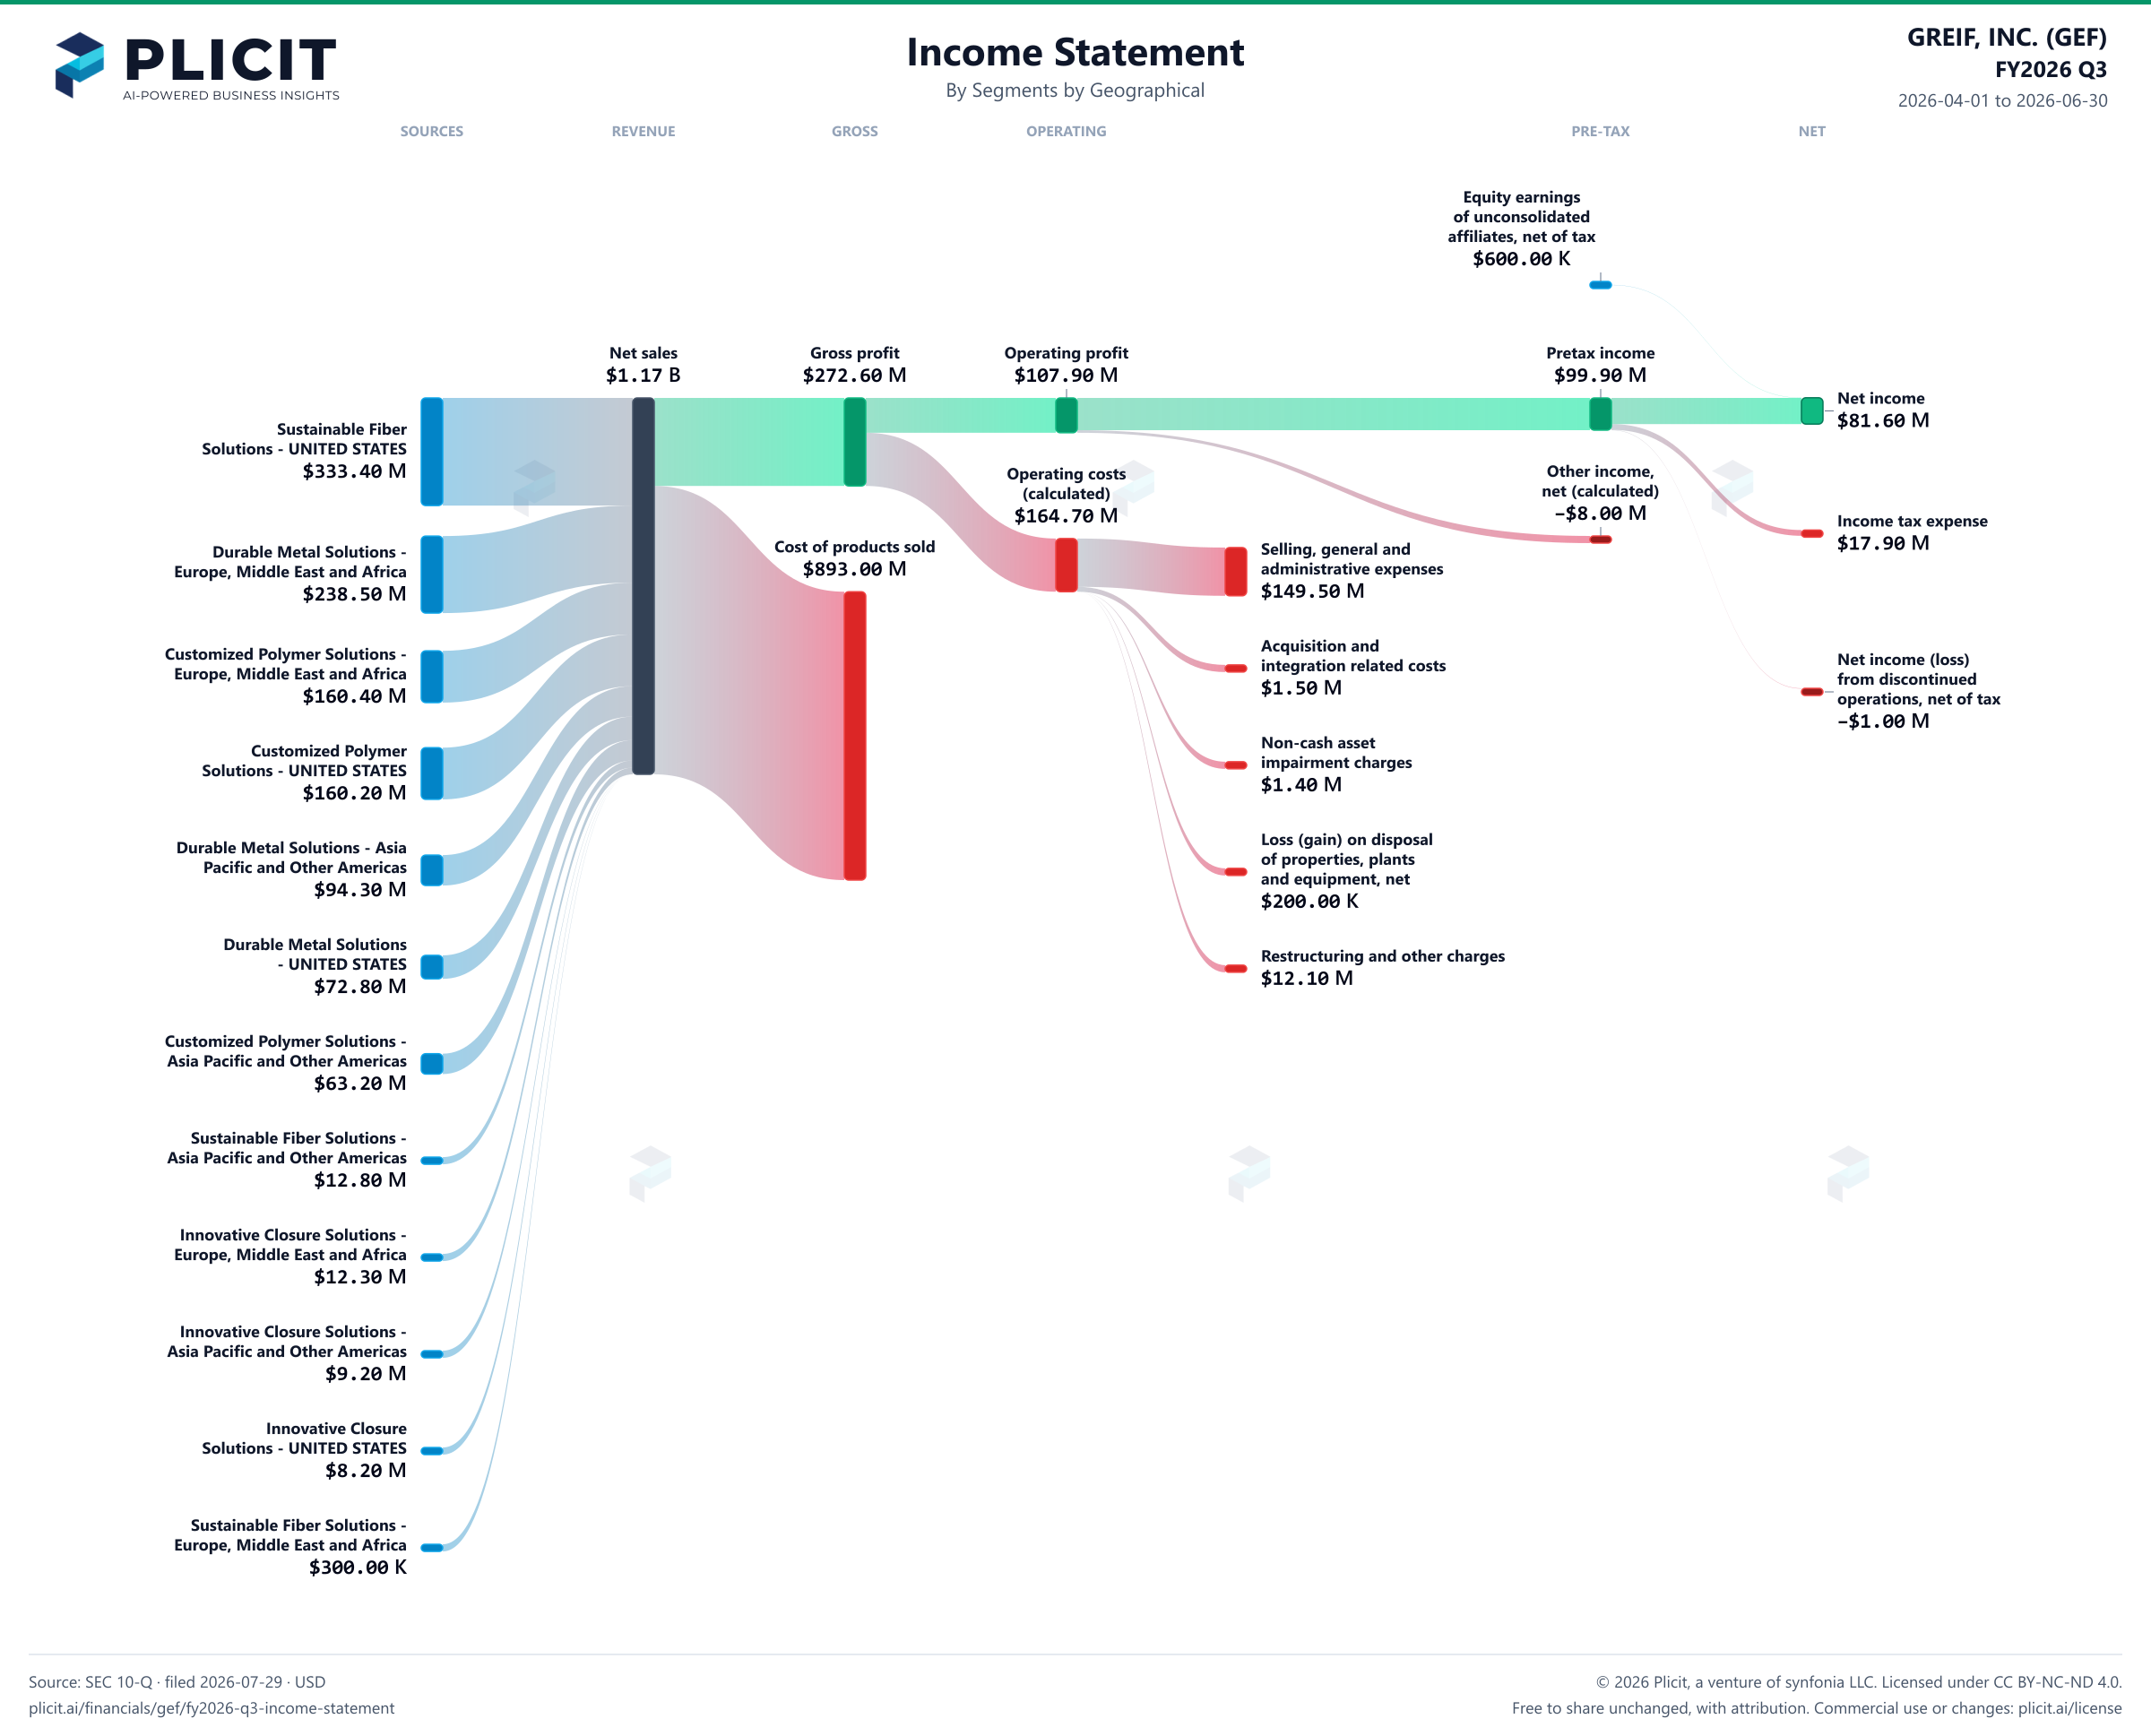
GREIF, INC. (GEF) FY2026 Q3 P&L / Income Statement Sankey chart, Segments by Geographical view
Free to share unchanged, with credit to Plicit.ai · CC BY-NC-ND 4.0Download PNG

Gross margin

23.4%

Gross profit / revenue

Operating margin

9.3%

Operating profit / revenue

Cash conversion

95.3%

Operating cash / net income, same period

Newsletter

Get the teardowns by email

Subscribe if you want the public-company teardowns in your inbox when they're released.

Product waitlist

Health Check and Teardown for your own company

A health check uncovers insights of your private books, not a public ticker. Join this list to get notified as soon as we go-live!