
Group 1 Automotive, Inc (GPI) FY2026 Q2 P&L / Income Statement

Revenue by Business Segment by Product and Service

2026-04-01 to 2026-06-30

Swipe to see the full flow
Group 1 Automotive, Inc (GPI) FY2026 Q2 P&L / Income StatementIncome statement for 2026-04-01 through 2026-06-30. View: Segments by Product and Service. Revenue uses this breakdown; costs and expenses retain the consolidated categories.SOURCESREVENUEGROSSOPERATINGPRE-TAXNETUnited States Segment - New vehicle retail salesUnited States Segment - Used vehicle retail salesUnited Kingdom Segment - Used vehicle retail salesUnited Kingdom Segment - New vehicle retail salesUnited States Segment - Parts and service salesUnited States Segment - Finance, insurance and other, netUnited Kingdom Segment - Parts and service salesUnited States Segment - Used vehicle wholesale salesUnited Kingdom Segment - Used vehicle wholesale salesUnited Kingdom Segment - Finance, insurance and other, netUndisclosed (calculated)Total revenuesGROSS PROFITTotal cost of salesINCOME FROM OPERATIONSOperating expenses (calculated)Selling, general and administrative expensesDepreciation and amortization expenseRestructuring chargesAsset impairmentsINCOME BEFORE INCOME TAXESOther income (expense), net (calculated)NET INCOMEProvision for income taxesNet income from discontinued operationsNet income from discontinued operationsNet income fromdiscontinuedoperations$300.00 KINCOME FROM OPERATIONSINCOME FROMOPERATIONS$203.10 MINCOME BEFORE INCOME TAXESINCOME BEFOREINCOME TAXES$134.40 MTotal revenuesTotal revenues$5.39 BGROSS PROFITGROSS PROFIT$860.60 MNET INCOMENET INCOME$103.30 MOperating expenses (calculated)Operating expenses(calculated)$657.50 MUnited States Segment - New vehicle retail salesU.S. - New vehicle retail sales$2.02 BProvision for income taxesProvision forincome taxes$31.40 MTotal cost of salesTotal cost of sales$4.52 BSelling, general and administrative expensesSelling, general andadministrative expenses$623.50 MOther income (expense), net (calculated)Other income,net (calculated)−$68.70 MUnited States Segment - Used vehicle retail salesU.S. - Used vehicle retail sales$1.11 BDepreciation and amortization expenseDepreciation andamortization expense$30.90 MUnited Kingdom Segment - Used vehicle retail salesU.K. - Used vehicle retail sales$605.50 MRestructuring chargesRestructuring charges$2.10 MUnited Kingdom Segment - New vehicle retail salesU.K. - New vehicle retail sales$583.10 MAsset impairmentsAsset impairments$1.00 MUnited States Segment - Parts and service salesU.S. - Parts and service sales$531.00 MUnited States Segment - Finance, insurance and other, netU.S. - Finance,insurance and other, net$178.80 MUnited Kingdom Segment - Parts and service salesU.K. - Parts and service sales$161.30 MUnited States Segment - Used vehicle wholesale salesU.S. - Used vehicle wholesale sales$87.70 MUnited Kingdom Segment - Used vehicle wholesale salesU.K. - Used vehicle wholesale sales$63.80 MUnited Kingdom Segment - Finance, insurance and other, netU.K. - Finance,insurance and other, net$38.00 MUndisclosed (calculated)Undisclosed (calculated)$100.00 K
Chart details

Group 1 Automotive, Inc (GPI) FY2026 Q2 P&L / Income Statement

Income statement for 2026-04-01 through 2026-06-30. View: Segments by Product and Service. Revenue uses this breakdown; costs and expenses retain the consolidated categories.

Total revenues
5,385,100,000 US dollars
Total cost of sales
4,524,500,000 US dollars
GROSS PROFIT
860,600,000 US dollars
Operating expenses (calculated)
657,500,000 US dollars
INCOME FROM OPERATIONS
203,100,000 US dollars
Other income (expense), net (calculated)
negative 68,700,000 US dollars
INCOME BEFORE INCOME TAXES
134,400,000 US dollars
Provision for income taxes
31,400,000 US dollars
NET INCOME
103,300,000 US dollars
United Kingdom Segment - New vehicle retail sales
583,100,000 US dollars
United Kingdom Segment - Parts and service sales
161,300,000 US dollars
United Kingdom Segment - Used vehicle retail sales
605,500,000 US dollars
United Kingdom Segment - Used vehicle wholesale sales
63,800,000 US dollars
United Kingdom Segment - Finance, insurance and other, net
38,000,000 US dollars
United States Segment - New vehicle retail sales
2,023,000,000 US dollars
United States Segment - Parts and service sales
531,000,000 US dollars
United States Segment - Used vehicle retail sales
1,112,800,000 US dollars
United States Segment - Used vehicle wholesale sales
87,700,000 US dollars
United States Segment - Finance, insurance and other, net
178,800,000 US dollars
Undisclosed (calculated)
100,000 US dollars
Asset impairments
1,000,000 US dollars
Depreciation and amortization expense
30,900,000 US dollars
Restructuring charges
2,100,000 US dollars
Selling, general and administrative expenses
623,500,000 US dollars
Net income from discontinued operations
300,000 US dollars. Reported below-tax contribution to net income.

Chart connections

  • Revenue less cost of revenue equals gross profit; gross profit less operating expenses equals operating income.
  • Operating income plus other income or expense equals income before tax. Income before tax less income tax expense or benefit, plus the explicitly reported below-tax contributions, equals net income.
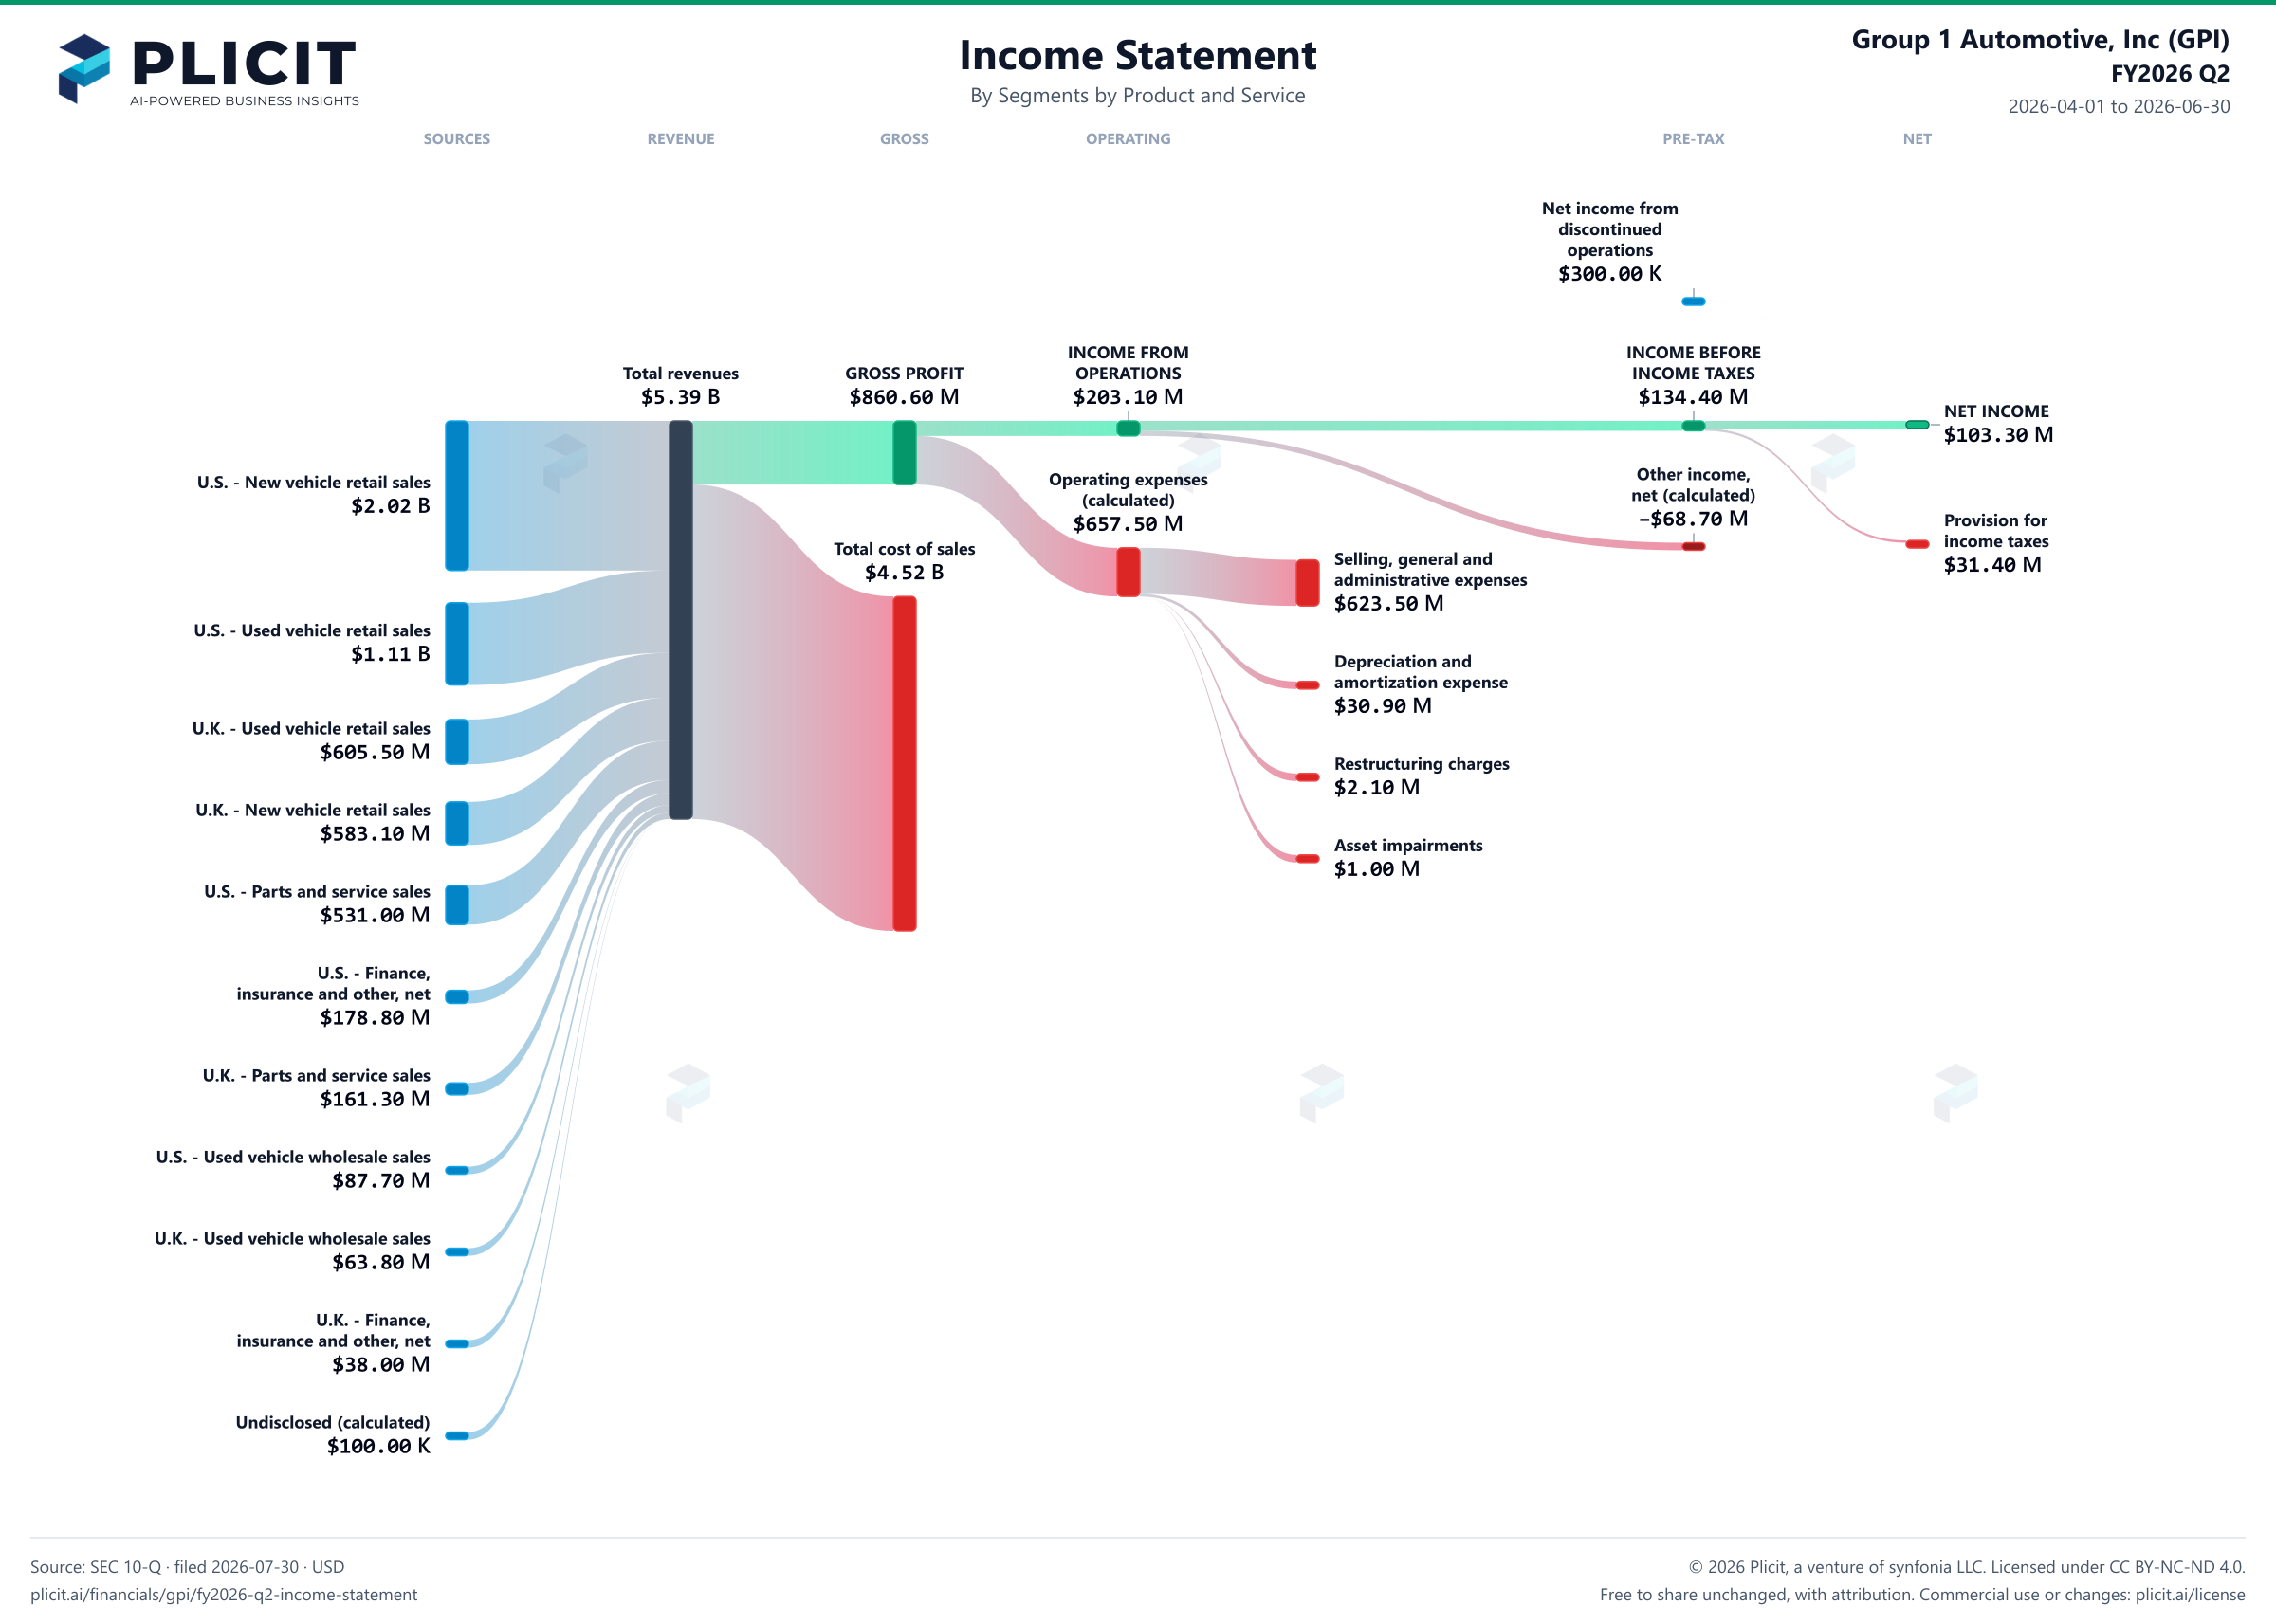
Group 1 Automotive, Inc (GPI) FY2026 Q2 Revenue by Business Segment by Product and Service Sankey chart
Free to share unchanged, with credit to Plicit.ai · CC BY-NC-ND 4.0Download PNG

Gross margin

16.0%

Gross profit / revenue

Operating margin

3.8%

Operating profit / revenue

Cash conversion

60.6%

Operating cash / net income, same period

Newsletter

Get the teardowns by email

Subscribe if you want the public-company teardowns in your inbox when they're released.

Product waitlist

Health Check and Teardown for your own company

A health check uncovers insights of your private books, not a public ticker. Join this list to get notified as soon as we go-live!