
The Goldman Sachs Group, Inc. (GS) FY2026 Q1 Balance Sheet

Balance Sheet

As of 2026-03-31

Swipe to see the full flow
The Goldman Sachs Group, Inc. (GS) FY2026 Q1 Balance SheetBalance sheet as of 2026-03-31. The chart shows assets, liabilities and equity at that date.Liabilities$1.94 TAssets$2.06 TEquity$122.78 BGross equity(calculated)$250.61 BHOLDINGSASSETSCLAIM CLASSCLAIM SUB-CLASSCLAIMSTrading assets (at fair value and includes $181,306 and $158,641 pledged as collateral)Loans (net of allowance of $2,345 and $2,148, and includes $4,379 and $4,905 at fair value)Securities borrowed (includes $61,700 and $51,581 at fair value)Customer and other receivables (includes $325 and $315 at fair value)Cash and cash equivalentsSecurities purchased under agreements to resell (at fair value)Available-for-sale securities (at fair value; amortized cost of $137,897 and $99,116)Held-to-maturity securitiesOther assets (includes $192 and $180 at fair value)Other investments (includes $24,748 and $24,938 at fair value)Deposits (includes $92,248 and $76,569 at fair value)Unsecured long-term borrowings (includes $125,666 and $112,683 at fair value)Trading liabilities (at fair value)Customer and other payablesSecurities sold under agreements to repurchase (at fair value)Unsecured short-term borrowingsSecurities loaned (includes $12,586 and $11,995 at fair value)Other secured financings (includes $36,139 and $27,833 at fair value)Other liabilities (includes $256 and $111 at fair value)Retained earningsAdditional paid-in capitalPreferred stock; aggregate liquidation preference of $13,703 and $15,153Share-based awardsCommon stock; 935,410,692 and 931,995,446 shares issued, and 294,574,329 and 296,476,742 shares outstandingAssetsLiabilitiesEquityGross equity (calculated)Stock held in treasury, at cost; 640,836,365 and 635,518,706 sharesAccumulated other comprehensive lossDeposits (includes $92,248 and $76,569 at fair value)Deposits (includes $92,248 and $76,569 at fair value)$561.26 BLiabilitiesLiabilities$1.94 TUnsecured long-term borrowings (includes $125,666 and $112,683 at fair value)Unsecured long-term borrowings$315.43 BTrading assets (at fair value and includes $181,306 and $158,641 pledged as collateral)Trading assets$758.02 BTrading liabilities (at fair value)Trading liabilities (at fair value)$312.22 BAssetsAssets$2.06 TCustomer and other payablesCustomer and other payables$293.04 BLoans (net of allowance of $2,345 and $2,148, and includes $4,379 and $4,905 at fair value)Loans$252.85 BSecurities sold under agreements to repurchase (at fair value)Securities sold under agreements to repurchase$259.45 BSecurities borrowed (includes $61,700 and $51,581 at fair value)Securities borrowed$233.08 BUnsecured short-term borrowingsUnsecured short-term borrowings$80.88 BCustomer and other receivables (includes $325 and $315 at fair value)Customer and other receivables$209.48 BSecurities loaned (includes $12,586 and $11,995 at fair value)Securities loaned$55.28 BCash and cash equivalentsCash and cash equivalents$179.53 BOther secured financings (includes $36,139 and $27,833 at fair value)Other secured financings$36.34 BSecurities purchased under agreements to resell (at fair value)Securities purchased under agreements to resell$152.88 BOther liabilities (includes $256 and $111 at fair value)Other liabilities (includes $256 and $111 at fair value)$23.51 BAvailable-for-sale securities (at fair value; amortized cost of $137,897 and $99,116)Available-for-sale securities$137.01 BEquityEquity$122.78 BRetained earningsRetained earnings$169.32 BHeld-to-maturity securitiesHeld-to-maturity securities$74.89 BGross equity (calculated)Gross equity(calculated)$250.61 BAdditional paid-in capitalAdditional paid-in capital$61.79 BOther assets (includes $192 and $180 at fair value)Other assets (includes $192 and $180 at fair value)$36.71 BPreferred stock; aggregate liquidation preference of $13,703 and $15,153Preferred stock$13.70 BOther investments (includes $24,748 and $24,938 at fair value)Other investments$25.73 BShare-based awardsShare-based awards$5.80 BCommon stock; 935,410,692 and 931,995,446 shares issued, and 294,574,329 and 296,476,742 shares outstandingCommon stock$9.00 MStock held in treasury, at cost; 640,836,365 and 635,518,706 sharesStock held in treasury−$125.92 BAccumulated other comprehensive lossAccumulated other comprehensive loss−$1.91 B
Chart details

The Goldman Sachs Group, Inc. (GS) FY2026 Q1 Balance Sheet

Balance sheet as of 2026-03-31. The chart shows assets, liabilities and equity at that date.

Assets
2,060,180,000,000 US dollars
Liabilities
1,937,398,000,000 US dollars
Equity
122,782,000,000 US dollars
Trading assets (at fair value and includes $181,306 and $158,641 pledged as collateral)
758,018,000,000 US dollars
Loans (net of allowance of $2,345 and $2,148, and includes $4,379 and $4,905 at fair value)
252,849,000,000 US dollars
Securities borrowed (includes $61,700 and $51,581 at fair value)
233,083,000,000 US dollars
Customer and other receivables (includes $325 and $315 at fair value)
209,484,000,000 US dollars
Cash and cash equivalents
179,530,000,000 US dollars
Securities purchased under agreements to resell (at fair value)
152,875,000,000 US dollars
Available-for-sale securities (at fair value; amortized cost of $137,897 and $99,116)
137,014,000,000 US dollars
Held-to-maturity securities
74,889,000,000 US dollars
Other assets (includes $192 and $180 at fair value)
36,707,000,000 US dollars
Other investments (includes $24,748 and $24,938 at fair value)
25,731,000,000 US dollars
Deposits (includes $92,248 and $76,569 at fair value)
561,263,000,000 US dollars
Unsecured long-term borrowings (includes $125,666 and $112,683 at fair value)
315,426,000,000 US dollars
Trading liabilities (at fair value)
312,220,000,000 US dollars
Customer and other payables
293,039,000,000 US dollars
Securities sold under agreements to repurchase (at fair value)
259,452,000,000 US dollars
Unsecured short-term borrowings
80,878,000,000 US dollars
Securities loaned (includes $12,586 and $11,995 at fair value)
55,278,000,000 US dollars
Other secured financings (includes $36,139 and $27,833 at fair value)
36,336,000,000 US dollars
Other liabilities (includes $256 and $111 at fair value)
23,506,000,000 US dollars
Retained earnings
169,316,000,000 US dollars
Additional paid-in capital
61,786,000,000 US dollars
Preferred stock; aggregate liquidation preference of $13,703 and $15,153
13,703,000,000 US dollars
Share-based awards
5,798,000,000 US dollars
Common stock; 935,410,692 and 931,995,446 shares issued, and 294,574,329 and 296,476,742 shares outstanding
9,000,000 US dollars
Nonvoting common stock; no shares issued and outstanding
0 US dollars
Stock held in treasury, at cost; 640,836,365 and 635,518,706 shares
negative 125,918,000,000 US dollars
Accumulated other comprehensive loss
negative 1,912,000,000 US dollars
Gross equity (calculated)
250,612,000,000 US dollars. Net equity plus the magnitudes of its negative contributions equals gross positive equity. The negative contributions enter this reconciliation as add-backs; their filed signs stay negative.

Chart connections

  • Assets equal liabilities plus consolidated equity. Consolidated equity includes noncontrolling interests when reported.
  • Treasury shares and other negative equity contributions reduce equity.
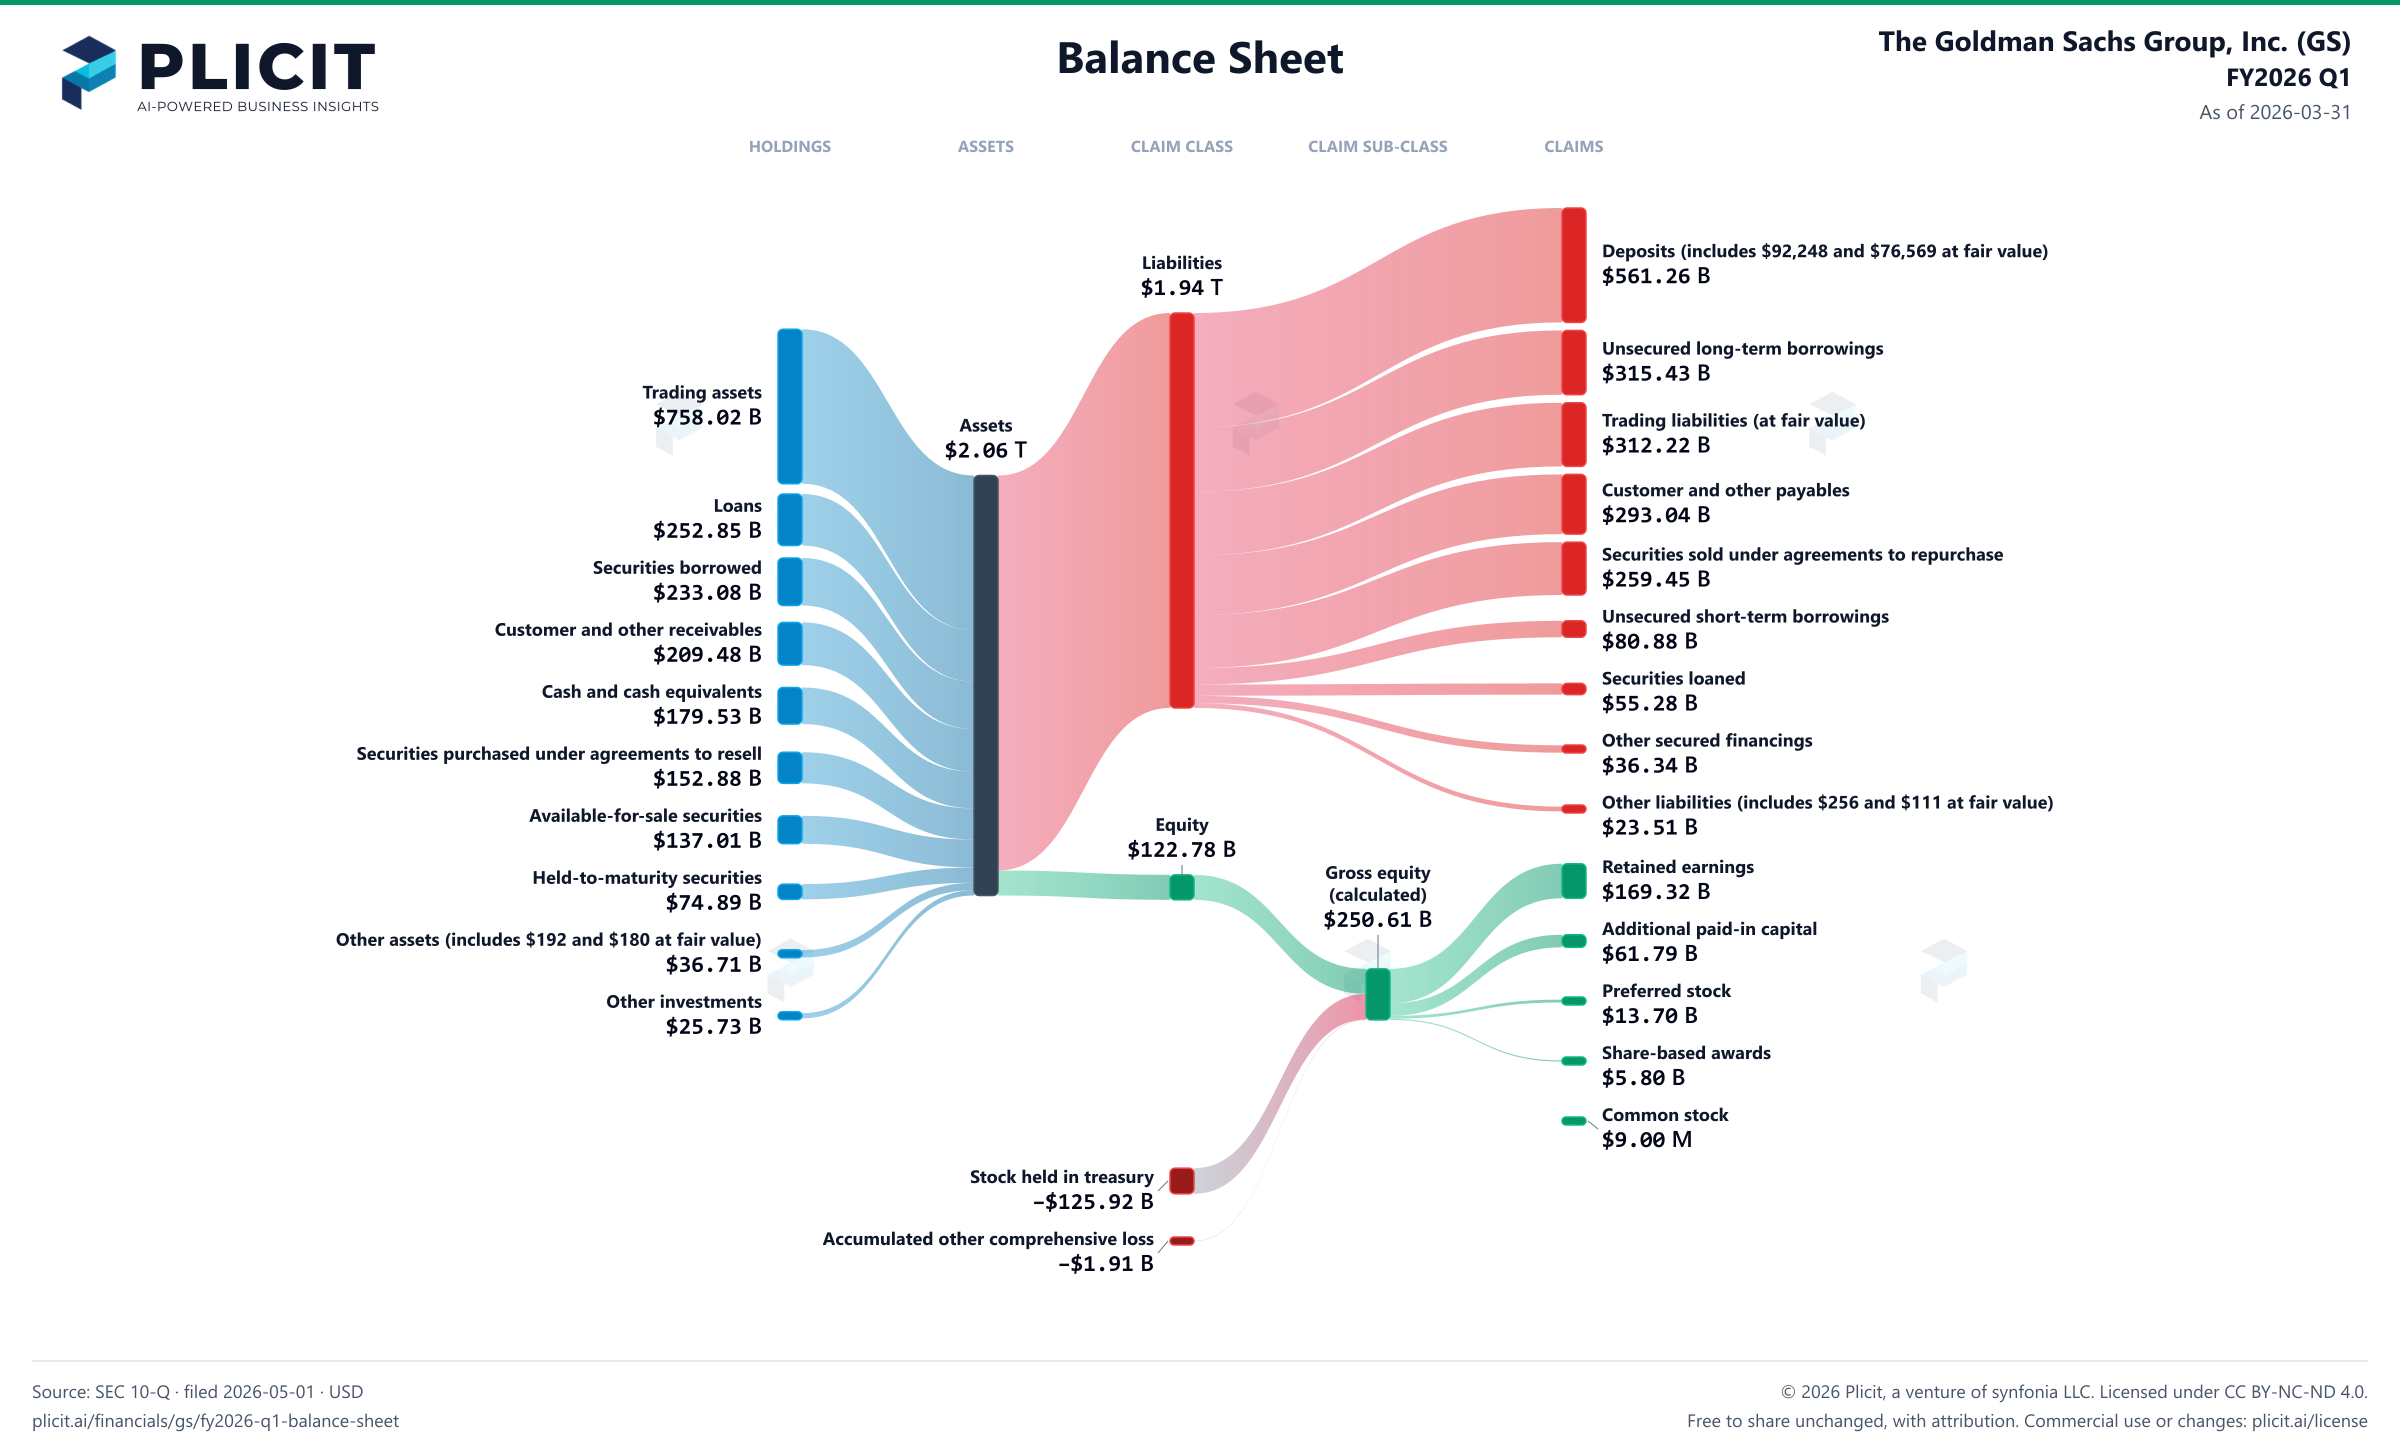
The Goldman Sachs Group, Inc. (GS) FY2026 Q1 Balance Sheet Sankey chart
Free to share unchanged, with credit to Plicit.ai · CC BY-NC-ND 4.0Download PNG

Newsletter

Get the teardowns by email

Subscribe if you want the public-company teardowns in your inbox when they're released.

Product waitlist

Health Check and Teardown for your own company

A health check uncovers insights of your private books, not a public ticker. Join this list to get notified as soon as we go-live!